

 PDF
PDF ePub
ePub Citation
 Print
Print


INTRODUCTION
Liver fibrosis represents one of the greatest global health problems, with a worldwide mortality inferable to cirrhosis and primary liver cancer of around 1.5 million deaths per year.1 Fibrosis of the liver is a superfluous accumulation of scar tissue that results from proceeding inflammation and death of liver cells that occur in most types of liver diseases with several types of etiologies such as immunological responses, metabolic disorders, infection and toxins.2 Despite decades of clinical and basic research effort, knowledge of the exact mechanisms leading to liver fibrosis have not yet been revealed.
Activation of hepatic stellate cells (HSCs) is considered to play a key role in initiation of fibrogenesis of the liver. HSCs and adjacent cells proliferate, becoming contractile cells termed myofibroblasts that serve as significant effector cells of fibrogenesis with the production ofexcessive extracellular matrix, both in amount and composition.3 One of important factors in the process and progress of liver fibrosis is transforming growth factor-β (TGF-β) that is produced by kupffer cells and HSCs. When the TGF-β receptor is engaged, it activates Smad signaling. Activation of this pathway induces transcription of type I and II collagens, promoting the liver fibrogenesis process.4
The Receptor for advanced glycation end products (RAGE) is a 47 to 55 kDa molecular mass multiligand cell surface receptor that belongs to the immunoglobulin superfamily. There are several ligands for RAGE which comprise advanced glycation endproducts (AGE), and non-AGE ligands such as, the high mobility group family proteins, including the prototypes HMGB1/amphoterin, members of the S100/calgranulin protein family and amyloid-β peptide. Based on the type of ligand, RAGE plays a key role in many physiological andpathological events including development, complications of diabetes, inflammation, neurodegenerative diseases and cancer.567
The liver has a central role in several important metabolic and biochemical pathways. The functions of the liver are performed by several types of cells, including hepatocytes, sinusoidal cells, Kupffer cells and HSCs. There is evidence that RAGE is expressed in the different cell types in the liver.8 Previous reports have shown that RAGE is overexpressed during the activation and transition of HSCs to myofibroblasts.9 Another study also has shown that HMGB1 can intensify fibrogenesis via activation of HSCs and alteration of the expression of a number of genes.10
Tyrosine kinases (TKs) were found to play a key role in liver fibrogenesis and they were overexpressed in the activated HSCs.11 Based on the important role of TKs in non-malignant diseases such as fibrotic disorders, inhibition of TKs can reveal favorable effects on the activation processes of HSCs. Recent data have shown that nilotinib as a second generation tyrosine kinase inhibitor has beneficial effects on liver fibrosis and reduces collagen accumulation and improves liver fibrogenesis.12 However, at the molecular levels the exact mechanisms still require clarification. In this project, we hypothesized that nilotinib may improve the fibrotic process via RAGE/HMGB1 and oxidative stress pathways.
MATERIALS AND METHODS
1. Experimental design
This experimental study was performed in the Hamadan University of Medical Sciences, Iran, from May 2015 to December 2016. Male Wistar rats (n=30), weighing 180-200 g were housed at 8-10 weeks of age in a controlled environment at 21±2℃, 50±5% relative humidity, and a 12 h light/dark cycle. Rats were kept for one week prior to the experiment for adaptation to the new environment, then they were randomly assigned into experimental groups and allowed to have free access to a commercial rat chow diet and tap water ad libitum throughout the experimental periods. All the procedures for the treatment of animals were approved by the research committee of Hamadan University of Medical Sciences, Iran. Liver fibrosis was induced by injection of 1 ml/kg of 50% (v/v) CCl4 solution (Merck Chemical, Darmstadt, Germany) in olive oil twice a week (i.p) for 12 weeks. Rats with liver fibrosis were divided into two groups and treated with and without Nilotinib. The rats were divided into five groups (n=5 in each): normal rats (C) which received (by gavage) normal saline (0.5 ml per day) for 8 weeks, vehicle rats (O) which were injected olive oil (1 ml/kg; i.p) twice a week for 12 weeks, normal rats (CN) which received (by gavage) Nilotinib (Tasigna®, Novartis, Basel, Switzerland) (10 mg/kg in 0.5 ml normal saline) for 8 weeks, a fibrotic group (F) and a fibrotic group (FN) that were treated with Nilotinib (10 mg/kg in 0.5 ml saline daily by gavage). To examine the therapeutic effects of this agent after the appearance of the necro-inflammatory process, nilotinib treatment was started after 4 weeks of CCl4 injection and continued until the end of 12 weeks CCl4 injection. The inclusion criteria were: health rats and examinations confirming liver fibrosis. The exclusion criteria were: faint animals.
Rats were weighed on the first day of the experiment and upon the sacrificial day. Blood samples were collected 24 hours after the last injection of CCl4. Serum samples were separated by 10 min centrifugation at 2000×g and kept at −20℃ for further analysis. The liver tissues were dissected by transverse abdominal incision, washed rapidly with ice-cold saline, and stored at −75℃.
2. Preparation of liver Tissue homogenate
Liver tissues were homogenized with lysis buffer (500 mM Tris/HCl, pH 7.6, 10 mM CaCl2, 200 mM NaCl and 1% Triton X-100), protease inhibitor cocktail [Sigma-Aldrich Co. Ltd., Dorset, UK], and centrifuged for 15 minutes at 10,000×g. Supernatants were collected for further analysis of oxidative stress parameters.
3. Liver enzymes assay
Markers of liver damage serum alanine aminotransferase (ALT) and aspartate aminotransferase (AST) were measured using commercial kits (Pars Azmun kit, Iran).
4. Total protein content
The protein content was quantified by the Bradford method. Coomassie blue (G250) was diluted in 250 µL distilled water, and then 750 µL of this diluted dye was added to 50 µL of sample. The mixture was incubated at room temperature for 10 minutes and an absorbance measurement was taken at 595 nm by a spectrophotometer. A standard curve was constructed by using bovine serum albumin ranging from 0.25 to 1 mg/mL.13
5. Real time qPCR analysis of RAGE and HMGB1
Total RNA extraction was performed manually from liver tissues using the TRIzol kit (Invitrogen, Thermo Fisher Scientific, USA), according to the manufacturer's protocol. Complimentary DNA (cDNA) was synthesized through reverse transcription of 500 ng of total RNA through the PrimeScript RT reagent kit (TaKaRa Biotechnology, Japan). Quantitative real-time PCR was carried out in triplicate with SYBR premix Ex Taq 2 (TaKaRa Biotechnology, Japan) on a LightCycler® 96 System (Roche Life Science, Deutschland GmbH Sandhofer, Germany). The amplification protocol comprised of 1 cycle at 95℃ for 1min followed by 40 cycles at 95℃ for 30 s, 58℃ for 30s and then 72℃ for 30 s. The forward and reverse primer sequences were listed as follows:RAGE (forward: 5′-GAGTCCGAGTCTACCAGATTCC-3′; reverse: 5′-GGTCTCCTCCTTCACAACTGTC-3), HMGB1 (forward: 5′-GGCGAGCATCCTGGCTTATC-3′; reverse: 5′-AGGCAGCAATATCCTTCTCATAC-3′) and GAPDH (forward: 5′-AAGGTCGGTGTGAACGGATT TGG-3′; reverse: 5′-TCCTGGAAGATGGTGATGGGTT-3′); TNF-α forward: 5′-TGTTCATCCGTTCTCTACCCA-3′, and reverse: 5′-CACTACTTCAGCG TCTCGT-3′; TGF-β1 forward: 5′-ATTCAAGTCAACTGTGGAGCAAC-3′, and reverse: 5′-CGAAAGCCCTGTATTCCGTCT-3′;. Relative copy numbers were obtained from standard curve values and were normalized to values obtained for the internal control GAPDH. The fold change in expression was then calculated by 2-ΔΔCt formula.14
6. Determination of TNF-α levels
TNF-α contents of Liver tissue supernatants were measured by ELISA method (eBioscience, Inc. San Diego, CA, USA), according to the manufacturer's instructions.
7. Measurement of glutathione peroxidase (GPx) activity
Glutathione peroxidase activity in the liver tissue homogenate was determined using a spectrophotometric method (ZellBio GmbH, Ulm-Germany) according to the manufacturer's protocol.
8. Protein carbonyl assay
Liver protein carbonyl levels were measured by the spectrophotometric method. 500 µL of liver tissue homogenate was transferred into 1.5 ml centrifuge tubes and 500 µL of 10 mM 2,4-dinitrophenylhydrazine in 2 M HCl was added and incubated at room temperature for 1 hour. Then, 0.5 ml of 20% Trichloroacetic acid was added followed by centrifugation. The remaining pellets after washing were saved for next step. The pellets were re-dissolved in 0.6 ml guanidine solution. Carbonyl content was calculated using a molar absorption coefficient of 21 mM-1 cm-1 at 390 nm wavelength.15
9. Determination of protein total thiol groups
To evaluate the total thiol molecules of liver tissues, 2, 2-dithiobisnitrobenzoic acid (DTNB) was used as the reagent. DTNB reacted with thiol molecules and created a yellow complex with them which had the maximum absorbance at the wavelength of 412 nm in the spectrophotometer.16
10. Measurment of total nitric oxide (NO)
Nitrate/nitrite contents in the liver tissue homogenate were measured using a colorimetric assay kit (ZellBio GmbH, Ulm-Germany) as indicated in the manufacturer's instructions.
11. Histopathological examination of liver tissues
Liver tissue samples were fixed in 10% neutral buffered formalin, embedded in paraffin, sectioned at 5 µm thickness, and stained with Masson's trichrome and hematoxylin-eosin staining for light microscopic evaluation.
12. Statistical analysis
Mean and standard deviation values were determined for all the parameters and the results were expressed as Mean±SD. All data was analyzed with SPSS Version 16 employing one-way ANOVA followed by the Tukey post hoc test. Differences between the groups were considered significant when p<0.05.
RESULTS
1. Effects of Nilotinib on liver enzymes and body weight
Liver enzyme and body weight levels are summarized in Table 1. The body weight the liver fibrosis group (F) showed a significant decrease in comparison to three control groups (C, O and CN) (p<0.001). Body weight gain in the Nilotinib treated group (FN) was significantly increased compared to the fibrosis group (p<0.05). ALT and AST activity levels were significantly higher in the fibrosis group in comparison to control groups (p<0.001), but the Nilotinib treated group were significantly lower than the fibrosis group (p<0.01).
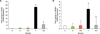
2. Nilotinib effects on RAGE mRNA levels
Expression of RAGE transcripts were quantified in liver tissue samples. As shown in Fig. 1A. RAGE expression was elevated in the liver fibrosis group significantly compared with the control groups (p<0.001). Relative expression levels of RAGE in the Nilotinib treated group significantly decreased in compared to liver fibrosis group (p<0.001).
3. Effects of Nilotinib on mRNA expression levels of HMGB1
The HMGB1 expression was determined in the liver tissue samples. As shown in the Fig. 1B. HMGB1 expression was higher in the liver fibrosis group significantly compared to the control groups (p<0.001). HMGB1 mRNA expression levels in the Nilotinib treated group significantly decreased in compared to liver fibrosis group (p<0.001).
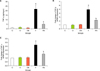
4. Effects of Nilotinib on expression levels of TNF-α and TGF-β
The TNF-α and TGF-β expressions were examined in the liver tissue samples. As shown in the Fig. 2 TNF-α and TGF-β expression was significantly higher in the liver fibrosis group compared to the control groups (p<0.001). Expression levels in the Nilotinib treated groups significantly decreased compared to the liver fibrosis groups (p<0.001).
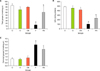
5. Effects of Nilotinib on oxidative stress markers
Thiol group contents of proteins in the liver tissue in the fibrosis group were significantly lower than those of control group (p<0.001, Fig. 3A). Treatment with Nilotinib in fibrosis group showed significantly (p<0.001) increased levels of the thiol group. GPX activity levels in liver tissue were significantly lower in the fibrosis group compared to the control groups (p<0.001, Fig. 3B). GPX activity in the Nilotinip treated fibrosis group were significantly increased (p<0.001) in comparison to the untreated fibrosis group. Liver protein carbonyl levels were measured in the liver tissue. As shown in Fig. 3C, carbonyl groups were significantly increased in the fibrosis group compared to the controls (p<0.001). The nilotinib treated group showed a significant decrease compared to the fibrosis group (p<0.05).
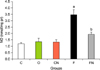
6. Effects of Nilotinib on nitric oxide levels
The NO levels of the liver tissues significantly increased in group F compared with normal groups C, CN and O (Fig. 4, p<0.001). Administration of Nilotinib in the treated fibrosis groups significantly decreased NO levels (p<0.001).
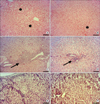
7. Histological observation
Histopathological examination of the livers in the nilotinib and the control groups revealed normal lobular architecture with central veins, radiating hepatic cords while these organs in the groups that received CCl4 and that the CCl4+ nilotinib showed mild, moderate, as well as severe tissue injuries (Fig. 5). According to the observations made on the Masson's trichrome stained sections, extensive fibrosis expansion of the portal area with marked bridging (portal to portal) as well as portal to central was evident in liver tissues from the CCl4 Group. In the group treated with nilotinib, marked reduction in collagen deposition was observed. No fibrosis was found in the control group (Fig. 6).
DISCUSSION
The liver is a large organ that plays a central role in numerous functions such as metabolic pathways, detoxifications and plasma protein synthesis. Chronic inflammation, metabolism, alcohol and chemical induced factors can cause liver damage.17 In the event that liver disease continues, this may result in the accumulation of extracellular matrix and cause liver fibrosis. The end stage of liver fibrosis is liver cirrhosis that is associated with high mortality and morbidity.18 Because of the reversibility of liver fibrosis in the initial steps, effective and exact treatment of liver fibrosis clinically is very important. Thus investigations to reveal exact molecular mechanisms of liver fibrosis and find new insights in this field are required. The present study was performed to demonstrate the anti-fibrotic effects of Nilotinib via RAGE/HMGB1 gene expression and antioxidant mechanisms.
Aminotransferases levels are good markers of liver fibrosis and hepatocyte injury. Our results showed increased activity of ALT and AST in the fibrotic group. Decreased body weight, weakness and fatigue were observed with CCl4 toxicity in the fibrotic group. After treatment with Nilotinib, liver enzymes levels decreased and body weight increased. In line with our findings, Liu et al. showed that ALT and AST levels decreased after Nilotinib administration in acutely and chronically toxic livers induced by CCl4.19
This study demonstrated that mRNA levels of RAGE in liver tissue of the fibrotic group were dramatically increased. Treatment with Nilotinib down regulated RAGE expression in the liver tissues of the fibrosis group and to our knowledge, this is the first report on this correlation. Zeng et al. reported that obstruction of RAGE activation by sRAGE, attenuates hepatocellular injury.20 Another study also showed that using antagonists of RAGE led to higher survival rates in acetaminophen-induced hepatotoxicity models.21 RAGE is expressed in HSCs and its expression was increased during activation of HSCs and differentiation of HSCs into myofibroblasts. In this case, myofibroblasts will produce high amounts of extracellular matrix and this results in progression of hepatic fibrosis.10 Xia et al. confirmed that by using specific silencing of the RAGE gene, liver fibrosis in rats induced by CCl4 was prevented.22 These observations demonstrate the important role of RAGE in the liver fibrosis processes, but the exact role of RAGE remains to be revealed.
Our findings showed that HMGB1 mRNA levels increased in the liver fibrosis tissues but were significantly reduced with Nilotinib administration. HMGB1 is involved in the activation and proliferation of HSCs and it caused up-regulation of alpha-smooth muscle actin (α-SMA) and suppression of matrix metalloproteinase enzymes.23 Another study has reported that HMGB1 gene silencing by siRNA suppressed the synthesis of collagen and α-SMA in the HSCs.24 A recent study showed that HMGB1 expression was induced by Osteopontin, a protein sensitive to oxidative stress, during liver fibrosis and expression of both are associated with fibrosis stages.25 HMGB1 from cellular damage is translocated from the nucleus and is secreted out of cells in the necrotic cells in the fibrosis condition. HMGB1 initiates injurious responses via RAGE signaling pathways.26 Altogether, this data suggests that the HMGB1/RAGE ratio may play a central role in the pathogenesis of liver fibrosis and investigations to find new therapeutic strategies are very important.
Our finding revealed anti-inflammatory effects of Nilotinib with a reduction of the expression levels of TNF-α and TGF-β. Recently, the anti-fibrotic effects of tyrosine kinase inhibitors have been considered by researchers.1127 Shiha et al. showed Nilotinib could control hepatic fibrosis by decreasing inflammatory cytokinesas well as transforming growth factor beta (TGF) and platelet-derived growth factor receptor beta (PDGFR).12 Based on our results Nilotinib significantly reduced the expression levels of both, RAGE and HMGB1. However, there are no studies on the effects of this drug on RAGE/HMGB1 expression. A specific question regarding the link between HMGB1/RAGE and tyrosine kinase inhibitors discussed how Nilotinib down-regulates HMGB1 and RAGE expression. More studies will be required to reveal the exact mechanisms, however the results of the present study suggest a direct or indirect connection between tyrosine kinases and HMGB1/RAGE axis.
Nilotinib might improve liver fibrosis through antioxidant mechanisms. In the present study, we showed that nilotinib treatment significantly increased thiol group levels and GPx activity in the liver of the fibrosis group and also Nilotinib administration decreased carbonyl content in the fibrosis condition. Oxidative stress plays a key role in the pathogenesis of liver diseases and the liver is more susceptible to oxidant factors because of its function in the detoxification processes.28 Antioxidant properties of Nilotinib have been reported by others. They have reported that Nilotinib increased antioxidant enzyme activity such as glutathione peroxidase, glutathione reductase and superoxide dismutase and also that Nilotinib decreased oxidative metabolite levels, such as malondialdehyde in the oxidative stress conditions.29 The exact molecular mechanisms of antioxidant effects of Nilotinib remain to be clarified. These effects might be related to blockade of tyrosine kinases by Nilotinib such as Abelson kinases and this inhibition could result in reduced reactive oxygen species (ROS) levels by down-regulation of RAGE and NADPH oxidase.
Based on the finding of this study, NO was higher in fibrosis group, and Nilotinib administration decreased NO content in the treated fibrosis animals. NO is generated by nitric oxide synthase. This enzyme is induced in the liver by toxins and subsequently high levels of NO led to inflammation and may be involved in the fibrosis process.30 In another mechanism increased ROS in fibrosis condition can stimulate nuclear factor kappa B (NFkB) that it induces nitric oxide synthase.27
According to the observations made on histological sections, liver tissue samples from the CCl4 group showed moderate to severe central vein and sinusoidal congestion, intense mononuclear cell infiltration around the portal area, extensive collagen deposition and pseudolobular formation, moderate to severe fatty changes and centrilobular necrosis. However, similar lesions were observed in the CCl4+ nilotinib group, but their extent and severity were reduced. Moreover, collagen deposition was markedly reduced in the treated rats with nilotinib.
In summary, our results show that Nilotinib as a tyrosine kinase inhibitor could reduce the severity of liver fibrosis through the downregulation of RAGE, its ligand HMGB1, anti-inflammatory effects, and antioxidant mechanisms. However more studies are needed to reveal the mechanisms of Nilotinib effects via the RAGE/HMGB1 pathway in liver fibrosis.

 XML Download