

 PDF
PDF ePub
ePub Citation
 Print
Print


INTRODUCTION
Metabolic syndrome (MetS) is a cluster of various disorders which are characterized by the impairment of glucose tolerance or hyperglycemia, abdominal obesity, high blood pressure and dyslipidemia.1 Obesity and MetS are related to an increased risk of cardiovascular disease, type 2 diabetes mellitus, hypertension, hyperlipidemia, mortality and morbidity in certain cancers.2
These conditions are characterized by an altered oxidative/antioxidant status and by subclinical inflammation; both are responsible for the development of atherosclerosis. Recently there has been a focused interest on the role of oxidative stress in the commencement of the MetS and insulin resistance,345 Increase in the synthesis of reactive oxygen species (ROS) and/or failure of the defenses against the ROS cause MetS which lead to an increase in oxidative stress.6 Under normal physiological conditions, different antioxidant systems can eliminate or inactivate ROS and free radicals. Superoxide dismutase (SOD) enzymatically converts superoxide anions (O2−) to hydrogen peroxide and subsequently hydrogen peroxide is disposed by the enzyme glutathione peroxidase (GSH-Px).67 On the other hand, catalase, a peroxisomes exclusive enzyme, detoxifies hydrogen peroxide. Furthermore, there are various molecules which eliminate or inactivate ROS-producing free radicals; endogenous molecules like uric acid and albumin and exogenous antioxidants derived from diet like ascorbic acid and vitamin E.7 The sum of endogenous and food-derived antioxidants represents the total antioxidant capacity (TAC) of the extracellular fluids.
The members of the superfamily of nuclear hormone receptors, peroxisome proliferator-activated receptors (PPARs), are ligand-dependent transcription factors which are predominantly expressed in adipose tissue and are known to be involved in differentiation of adipocyte and as the regulator of adipogenesis.89 Lower levels of PPAR-γ are expressed in other tissues such asskeletal muscle and liver tissues, which are the major target tissues for insulin.10 The expression of PPAR-γ has been shown in human peripheral blood mononuclear cells (PBMC), such as macrophages and monocytes,1112 where it plays an important role in the regulation of the inflammatory processes like down regulation of proinflammatory mediators in macrophages.1314
The anti-inflammatory effect of PPAR-γ is shown through its inhibitory effect on the production of inflammatory cytokines, such as tumor necrosis factor-α in the monocytes and nuclear factor kappa B (NF-kB) as well.1415 A hypermetabolic state is associated with alterations in oxidative metabolism, increased production of free radicals and oxidative stress, and finally the acute phase response (APR).16 In adipose tissue, recently the APR has been shown to down-regulate PPAR-γ, which can be expected because PPAR-γ is generally anti-inflammatory and improves insulin sensitivity.1718
Since PPAR-γ shows a role in inflammatory processes, it can be associated with the pathogenesis of MetS. The purpose of this study was to determine the expression of PPAR-γ gene in PBMC in patients with metabolic syndrome compared with the healthy control group. Determination of a possible correlation between the expression of the PPAR-γ gene and the anti-oxidant parameters in both normal and MetS groups was another aim in this study.
MATERIALS AND METHODS
1. Patients
Thirty healthy subjects who did not meet the criteria for metabolic syndrome and 37 patients with metabolic syndrome participated in this study. MetS was diagnosed when the candidates had at least three positive criteria out of the following: 1. Systolic blood pressure (SBP) ≥130 mmHg and diastolic blood pressure (DBP) ≥85 mmHg, 2. Fasting blood sugar (FBS) ≥6.05 mmoL/L or 100 mg/dL, 3. Waist circumference ≥90 cm in women, 4. High-density lipoprotein cholesterol (HDL-C) ≤50 mg/dL in women, 5. Triglycerides (TG) ≥ 150 mg/dL. Diabetic patients and subjects having blood hypertension, liver, kidney or thyroid disease were excluded from the study. Subjects who were on antihyper-lipidemic medications as well as pregnant women were also excluded. Overnight fasting blood samples of all the participants were taken and collected in three tubes for serum, plasma, using ethylenediamine tetra-acetic acid (EDTA), and PBMC preparation. Plasma and serum were separated by centrifugation (1,000 g, 5 min). Height, weight, waist circumference, systolic and diastolic blood pressures were also measured in all participants. The body mass index was calculated as well. The protocol of the study was approved by the Ethics Committee of Hamadan University of Medical Sciences, Hamadan, Iran, in accordance with the Helsinki Declaration. Written informed consent was acquired from all participants.
2. Measurement of biochemical factors
Serum samples were used to assess fasting blood glucose, total cholesterol, TG, high density lipoprotein cholesterol (HDL-C), and low density lipoprotein cholesterol (LDL-C) levels. Enzymatic calorimetric kits were used to measure serum levels of total cholesterol; triglyceride and blood glucose (ParsAzmun, Iran). The homogeneous enzymatic calorimetric test was used to measure the serum levels of LDL-C and HDL-C.
3. Isolation of peripheral blood mononuclear cell (PBMC), RNA extraction and c-DNA synthesis
The PBMCs were isolated from anticoagulant-treated blood samples using the Ficoll standard density gradient centrifugation (1,000 g; 5 min).12 Total RNA from PBMC samples was extracted using the column separation method. The isolated RNA was treated with DNase I (Fermentas Inc., Vilnius, Lithuania) to remove any possible DNA contamination; it was quantified at 260 nm using a nanodrop spectrophotometer (Eppendorf, Hamburg, Germany). The integrity of the RNA was verified by examining a optical density absorption ratio OD260 nm/OD280 nm that was between 1.8 and 2.0. The c-DNA was obtained from 1 µg of total sample of RNA.18 The obtained c-DNA was used as a template for real-time quantitative PCR.
4. Real-time quantitative PCR analysis
A quantitative, real-time PCR using a qPCR™ Green Master Kit for SYBR Green IW (Jena Biosciense, Gmbh, Germany) was developed for detecting relative mRNA levels of PPAR-γ in PBMCs, in real-time PCR detection system (Bio-Rad Laboratories, USA). Relative expression levels of PPAR-γ transcription were normalized to RNA loading for each sample using 18srRNA. Specific primers for all genes were designed using AlleleID7.6 software (version 7.6).
Sequences of sense and antisense primers for the PPAR-γ and reference gene (18s rRNA) are shown in Table 1.
The PCR reactions were performed on a final volume of 20 µL containing 1 µL cDNA, 7 µL deionized water, sense and antisense primers (1 µL of each) and 10 µL SYBR Green IW. The reactions were performed (in triplicate) with the following settings: 10 minutes of pre-incubation at 95℃ followed by 40 cycles for 30 seconds at 95℃ and 30 seconds at 72℃. A reaction without c-DNA was performed in parallel as a negative control.
5. Antioxidant analysis
The serum concentration of malondialdehyde (MDA) was analyzed by the thiobarbituric acid method.21 The TAC was determined by the ferric reducing/antioxidant power assay and detected at 520 nm using a spectrophotometer, as described by Benzie and Strain.22 Activity of SOD was assayed by the xanthine oxidase method using Randox kit (Randox Labs, Crumlin, UK),23 which monitors the degree of inhibition of nitrobluetetrazolium reduction through O2−-generated by xanthine and xanthine oxidase. The absorbance was read at 550 nm using a spectrophotometer. The total oxidant status (TOS) was assessed using a new colorimetric assay method developed by Erel.24
6. Statistical analyses
Data analysis was carried out using the SPSS 18.0 software package (SPSS Inc., Chicago, IL, USA). Independent-samplest-test was used to measure the differences in studied parameters between two groups. All experimental data was presented as the mean±standard deviation (SD). The Spearman correlation coefficient was calculated to estimate the correlations between variables. Values were considered to be statistically significant when the p<0.05.
RESULTS
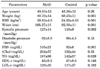
Comparisons of the baseline SBP and DBP, waist circumference, body mass index (BMI), and biochemical parameters between the studied groups are presented in Table 2. There were significant differences in the values for weight (p=0.001), body mass index (BMI) (p=0.001), waist circumstance (p=0.001) and SBP (p=0.002) between the two study groups despite no significant difference in DBP. Comparing biochemical parameters showed higher levels of fasting blood sugar (FBS) (p=0.001) and TG (p=0.029) in the subjects with MetS. There was no significant difference in total cholesterol (tChol), HDL-C and LDL-C between the study groups.
While none of the subjects in the control group had the criteria of MetS, some components of MetS were observed in some cases; waist circumference, HDL-C, TG and FBS in 17%, 13%, 10%, and 10% of controls subjects respectively.
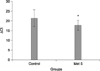
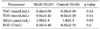
The levels of the various oxidative stress factors are shown in Table 3. No significant differences in the levels of TAC, MDA and SOD were found between the two groups. The only parameter which had a significantly higher level in MetS group was TOS (p=0.03). Fig. 1 illustrates Δct of the PPAR-γ gene which is significantly lower in patients group compared to the healthy control group (p=0.002), which indicates a higher expression in MetS subjects. To further analyze the relative gene expression of PPAR-γ, the fold change of this gene in MetS group was calculated using the 2−ΔΔCt formula. The obtained results showed a 9.5-fold higher expression of the PPAR-γ gene in the MetS group. The correlation of PPAR-γ gene expression with components of MetS was also determined. PPAR-γ gene expression in the MetS group showed a negative correlation with HDL-C (r=−0.35, p=0.03) and a positive correlation with TG (r=0.42, p=0.026). No statistically significant correlation was observed between PPAR-γ gene expression and the other components of MetS in both groups. Furthermore, there was no correlation between expression of the PPAR-γgene and the anti-oxidant parameters in both normal and MetS groups.
DISCUSSION
In this study we evaluated the expression of the PPAR-γ gene in MetS subjects. We also examined any association between MetS, serum lipid variation, and oxidative state. MetS is a multi-factorial disorder and its causes have not been precisely determined. The higher expression of PPAR-γ was observed in MetS subjects compared to healthy control group. The PPAR-γ is a ligand-activated transcription factor belonging to the nuclear receptor superfamily which plays a critical role in the metabolism of lipids and glucose.9 It enhances macrophage lipid uptake as well as lipid export.13 It has been shown that PPAR-γ can be expressed in both adipocyte and human PBMCs and the higher expression of this gene was seen after consumption of a high-fat meal in healthy individuals.8 Anti-inflammatory properties of PPAR-γ have been extensively reviewed in other studies.2526 In obesity, production of inflammatory cytokines TNFα, IL-1β and IL-6 result in a wide range of metabolic changes. It has been shown that TNFα and IL-1 directly decrease the levels of PPAR-γ.18
We found higher levels of PPAR-γ expression in the PBMCs of patients with MetS, which was associated with a significant higher plasma level of TG. Garcia-Fuentes et al. studied PPAR-γ expression in PBMCs in morbidly obese persons.27 They found that the reduction in the expression of PPAR-γ is correlated with the increase in free fatty acids.27
The alteration in oxidative metabolism is accompanied by an increase in the production of free radicals and oxidative stress parameters that may induce a hypermetabolic state and APR.2829 There is evidence that PPAR-γ ligands can increase the expression and activity of Cu/Zn SOD and decrease the expression of the NADPH oxidase subunit in vascular-endothelial cells, in vitro.30 The relation between this gene and antioxidant parameters was examined in our study. No correlation was observed between the levels of PPAR-γ and antioxidant parameters. These results did not support our hypothesis that PPAR-γ affects these parameters. Higher expression of the PPAR-γ gene, which was observed in the MetS group in this study, was similar to the findings in the study by Macias-Gonzalez et al.31 In their study, PPAR-γ expression was higher in patients compared to healthy subjects. However, down-regulation of PPAR-γ was observed in MetS patients after a fat overload compared with baseline level. In contrast, healthy subjects experienced an increase in the expression levels of PPAR-γ after fat overload.31 Decreased inexpression of PPAR-γ gene can explain the base concept of "saturation", derived from a limitation in the expandability of fat and peripheral lipid metabolism, in pathophysiological situations.32 This saturation in lipid balance can lead to lipotoxicity which ends in saturation of the antioxidant machinery and could finally affect the regulation of PPAR-γ expression.31
Interestingly, Garcia-Fuentes et al. showed that in a group of morbidly obese persons, plasma SOD activity and mRNA expression of PPAR-γ were decreased after taking a high-fat meal.27 Also they indicated that PPAR-γ expression after the high-fat meal was correlated with the plasma SOD activity.27
It can be hypothesized that the activation of PPAR-γ in our study might favor adipocyte differentiation, resulting in a decrease in the inflammatory status of adipose tissue during obesity. Diet induced obesity is associated with increased inflammatory gene expression in adipose tissue via adipocyte hypertrophy and macrophage infiltration. It has been shown that PPAR-γ is able to reverse macrophage infiltration, and subsequently reduces the expression of inflammatory genes.33 Moreover, it can be suggested that reactivating PPAR-γ could be a response in order to restore the metabolic balance in MetS.
In our study, the increase in antioxidant parameters showed no significant changes; however, the TOS was significantly higher which could indicate the increase in lipotoxicity.
We did not observe a significant association between expression of the PPAR-γ gene and the oxidative stress status in MetS patients; however, it could be due to the limited number of subjects in this study.
The scientists believe that the contributed mechanisms to the pathogenesis of MetS are still in need of intense investigation.34 There is an alteration in expression of some genes in MetS that can lead to obesity, diabetes mellitus, and hypertension. Recently we have shown that ABCG1 gene expression, one of the ABC transmembrane transporters, significantly decreases in MetS.35 Down-regulation of ABCG1 can affect cholesterol efflux and predispose patients to atherosclerosis.
Also there are some changes in the expression of some cytokines' genes in MetS. An increase in the expression of the leptin receptor gene and a decrease in the expression of IL-10 and IL-8 have been reported in MetS.3637 On the other hand, no significant changes has been observed in the expression of IL-7.37 It is believed that MetS is caused by the chronic activation of the innate immune system, which can contribute to the some components of MetS.28 Changes in the above mentioned cytokines, leptin receptors and PPAR-γ may play a role in this condition. PPAR-γ plays an important role in metabolic balance.
An increase in expression of the PPAR-γ gene in subjects with MetS in our results indicates a possible role in the pathogenesis of this disease. This up-regulation of the PPAR-γgene can be a physiologic response to increased resistance to oxidative stress.

 XML Download