Journal List > Chonnam Med J > v.52(3) > 1074967

Lee, Heo, and Park: Clinical Usefulness of Spectral-Domain Optical Coherence Tomography in Glaucoma and NAION

Abstract

The development of optical coherence tomography (OCT) has changed the clinical management of ophthalmic diseases by furthering the understanding of pathogenesis, as well as improving the monitoring of their progression and assisting in quantifying the response to treatment modalities in ophthalmic diseases. Initially, the two-dimensional configuration of the optic nerve head (ONH) and the thickness of the retinal nerve fiber layer (RNFL) were the main OCT structural parameters used in clinical management of optic nerve diseases. Now, with higher resolution power and faster acquisition times, the details of ONH and the retina including the macular area can be measured using spectral domain OCT (SD-OCT) with high reproducibility and increased diagnostic ability. OCT can provide structural information to improve the understanding and management of optic nerve diseases. In this review, we will briefly summarize the clinical applications of SD-OCT in glaucoma and nonarteritic anterior ischemic optic neuropathy, which are two representative optic nerve diseases.

INTRODUCTION

Optical coherence tomography (OCT) has enabled qualitative and quantitative delineation of optic nerve diseases with a degree of resolution and accuracy not previously afforded by clinical examinations alone. Since OCT was first introduced clinically in 1991 as a noncontact, noninvasive technique for human in vivo imaging,1 it has provided structural changes in the retina and optic nerve in a variety of ophthalmic diseases.
Time domain OCT (TD-OCT) used to be the first-line approach for retinal thickness measurement in clinical practice. Spectral domain OCT (SD-OCT) is the latest generation of OCT that can image with higher resolution than TD-OCT. SD-OCT devices are characterized by higher resolution, faster acquisition times and being less dependent on technicians, compared to TD-OCT.23 Moreover, hardware and software advances including three-dimensional volumetric scanning protocols have been incorporated in commercially available SD-OCTs, which has greatly increased the amount of information available to ophthalmologists.
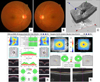
The use of SD-OCT has enabled physicians to obtain high-resolution images of the optic nerve head (ONH), retinal nerve fiber layer (RNFL), and segmental macular regions (Fig. 1). With advanced structural assessment provided by SD-OCT imaging, a more thorough assessment and understanding of these structural changes may help in disease management in optic nerve diseases.456789 This review will focus on the clinical use of SD-OCT in glaucoma and nonarteritic anterior ischemic optic neuropathy (NAION), which are optic nerve diseases frequently managed by ophthalmologists.

SD-OCT IN GLAUCOMA

1. Glaucoma diagnosis

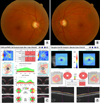
The histologic hallmark of glaucoma is the progressive loss of retinal ganglion cells (RGCs) and RGC axons. Loss of RGCs results in thinning of the RNFL, morphological changes to the ONH and a reduction in visual field sensitivity, which can ultimately result in visual impairment and blindness. The use of SD-OCT for glaucoma diagnosis has become a common clinical practice. Previous studies have shown that RNFL and macular thickness parameters are reproducible with high diagnostic sensitivity and specificity in discriminating between the normal and glaucomatous eyes (Figs. 1, 2).1011
The diagnostic capabilities of SD-OCT for discriminating between normal and glaucomatous eyes using RNFL thickness have been reported to have an area under receiver operating characteristics curve value of around 0.9.1213 However, the discrimination power is dependent on the severity of glaucoma, with better results in discriminating between normal and more advanced glaucoma compared with the discrimination of early glaucoma.14
The diagnostic power of ONH parameters (disc and rim area, average and vertical cup-to-disc ratio, and cup volume) has not yet been established. One previous study showed these parameters to be inferior to RNFL measurement for glaucoma diagnosis,15 while another reported they were equally effective.16 These results may be due to differences in glaucoma severity. However, both studies reported similar diagnostic capability with the rim area and average RNFL thickness in advanced glaucoma.
Segmental macular thickness provided by the macular cube scan has been recently studied in glaucoma diagnosis. Previous studies reported that segmented data of macular cube scans including the ganglion cell layer with inner plexiform layer (GCIPL) and the GCC (ganglion cell complex, composed of the macular nerve fiber layer and GCIPL) had a similar glaucoma discriminating power relative to mean RNFL thickness.171819 Jung et al.20 reported that the diagnostic power of the macular GCIPL (mGCIPL) thickness was comparable to that of the peripapillary RNFL (pRNFL) thickness in patients with normal tension glaucoma (NTG) and primary open angle glaucoma (POAG). Sung et al.2122 reported that the measurement of macular GCC thickness and the mGCIPL thickness deviation map has similar diagnostic power to the measurement of pRNFL thickness and the pRNFL thickness deviation map in patients with glaucoma, respectively. Park et al.23 also demonstrated that asymmetry of temporal-to-nasal mGCIPL thickness could be an important parameter in the diagnosis of early glaucoma with paracentral VF defects.

2. Glaucoma progression

A sensitive method for detecting the glaucoma progression is indispensable because appropriate treatment can decrease RGC loss and result in preservation of vision. Until now, the standard criterion of glaucoma progression has been visual a field examination that can measure the functional changes. However, a recent study reported that the OCT could be a tool for monitoring glaucoma progression, demonstrating that the progressive RNFL thinning determined by OCT is predictive of a detectable, functional decline in glaucoma.24
The detection of glaucoma progression with OCT remains a challenge because, when assessing structural changes over time, it is difficult to discriminate between glaucomatous structural damage and its measurement variability and age-related structural loss. A previous study recruited 100 normal individuals for cross-sectional analysis and then randomly selected 35 participants for 30 months of a longitudinal anaylsis.25 The authors demonstrated progressive age-related loss of the RNFL using longitudinal SD-OCT. Furthermore, they reported that the rate estimates derived from trend analysis for glaucomatous RNFL progression should be interpreted with reference to the normal ranges of age-related reduction when the baseline RNFL measurement is large for the significant factors influencing the rates of change of RNFL measurements which are the baseline RNFL thickness and the greater baseline RNFL thickness.
SD-OCT has been reported to be more sensitive than TD-OCT in detecting the RNFL changes in glaucoma progression.26 SD-OCT provides us the index for glaucoma progression based on either event-based or trend-based analysis.27 Event-based analysis detects progression when a follow-up measurement exceeds a pre-established threshold for change from the baseline. This analysis identifies a gradual change over time that eventually crosses a threshold or an acute event that exceeds a threshold. The limitation of this approach is its susceptibility to the effects of outliers that can be inaccurately labelled as progression. Trend-based analysis detects progression by evaluating the slope of measured parameter over time. Trend-based analysis is less sensitive to measurement variability and identifies a rate of progression that may be extrapolated for time-to-event predictions. The limitation of this approach is the requirement for a large number of tests before the analysis can be considered as reliable. Furthermore, trend-based analysis arrests upon the assumption of a linear rate of structural loss, which might not be applicable for all eyes.
The RNFL thickness map has enabled the assessment of RNFL progression patterns. Leung et al.28 demonstrated three RNFL progression patterns: widening, deepening, and development of new RNFL defects. They also reported that the inferotemporal meridian (324°-336°) 2.0 mm away from the optic disc center was the most frequent location for RNFL progression.
Several studies evaluated the function of segmental macular thickness in the assessment of glaucoma progression.2930 Na et al.29 demonstrated that the GCC, the outer retinal layer (from outer plexiform layer to retinal pigment epithelium), and the total macular thickness were more sensitive than RNFL thickness in detecting progression. Another study reported 98 patients with advanced glaucoma (visual field mean deviation <–10 dB) with a mean follow-up time of 2.2 years and showed that average macular thickness decline was significantly higher in the progressed group than in the stable and undetermined groups.30 The authors also demonstrated that the progression rate of average RNFL thickness was similar among the three groups, suggesting that macular thickness was more sensitive than RNFL thickness for detecting progression in advanced glaucoma.

SD-OCT IN NAION

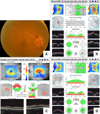
NAION is a vision threatening disease in ophthalmology. It is a disorder characterized by acute, painless, and usually monocular visual field (VF) loss, with optic disc swelling (Fig. 3A). Histological studies on optic nerves associated with NAION have shown a complete loss of fibers in half of the nerve and peripheral fiber loss or normal fiber expression in the other half.3132 Ganglion cell loss in NAION usually presents as increased pallor of the optic disc, which is more difficult to evaluate subjectively. OCT allows a detailed analysis of the optic disc and its adjacent nerve fiber layer, providing additional diagnostic and prognostic data. Previous studies using SD-OCT to investigate the mGCIPL in the eyes of patients with NAION have been reported.333435
Acute stage of NAION is characterized by optic disc swelling, which is confirmed by OCT showing a large optic disc area, increased vertical disc diameter,36 and diffuse thickening of the RNFL4 (Fig. 3B). OCT also helps to evaluate the change of the optic disc's appearance during follow-up. Several studies have shown the reduction of optic disc area, vertical disc diameter, and RNFL with the recovery of optic disc edema.43637 OCT can also be used to assess the quadrant of optic nerve involvement in NAION, which is clinically difficult. This finding can aid in the evaluation of the extent of the ischemic damage and the disease prognosis. After optic disc edema disappears, the superior quadrant shows a higher percentage of RNFL loss. Contreras et al.38 demonstrated that the RNFL percentage decrease in NAION for the superior, nasal, inferior, and temporal quadrants was 51.5%, 28.5%, 41.2%, and 38.2%, respectively, at the 6-month visit and the reduction in the superior quadrant RNFL thickness was statistically higher. The RNFL loss is unapparent in the nasal quadrant with a 28% loss, lower than that in other quadrants. These findings may support previous studies3940 that the ONH watershed zones are located mainly in or adjacent to the temporal half of the optic disc, making them weaker than the nasal quadrant. With regard to visual prognosis in NAION, in patients with favorable visual outcomes after NAION, the RNFL thickness in all quadrants, except in the temporal quadrant, is thinner compared with normal eyes.3841 Temporal quadrant preservation may be a good clinical indicator of central vision loss.38 RNFL measurements may be used to monitor the progression of NAION with high reproducibility. Several OCT studies also reported the usefulness of measurement of GCC or GCIPL thickness in NAION. Akbari et al.42 reported that thinning of the GCIPL is first detectable at 1 month after NAION, persists for 3 months, and occurs before RNFL thinning (Fig. 3C and D). Larrea et al.43 reported that GCC thickness measurement by OCT is capable of detecting early axonal damage in NAION eyes in the acute state prior to RNFL loss. Park et al.35 demonstrated GCIPL thinning in the early phase of NAION, with the area of mGCIPL thinning correlating with that of the VF defect.

SD-OCT LIMITATIONS

For proper use of SD-OCT in clinical practice, it is essential to be aware of the limitations of the technology and of currently available devices. The scans can be affected by movement, artifacts, media opacity, particular posterior subcapsular cataract, algorithm failure or poor signal to noise ratios.44 Such errors may cause false measurements of the thicknesses of the different layers and structures.4445 Ophthalmic diseases like myopia,46 age related macular degeneration,47 and the presence of macular drusen47 may also introduce artifacts and confuse the interpretation of data of certain parameters.

CONCLUSION

OCT has further showed the close relationship between pathology in the neurosensory retina and optic nerve. OCT devices are in the development process currently, so more accurate and precise measurements using OCT will soon be possible. It is to be expected that this will lead to a greater understanding of as yet unrevealed structural changes in glaucoma and NAION in the future.

Figures and Tables

FIG. 1

Conventional testing images in a normal subject. (A, B) Optic disc photographs in both eyes. (C) 3D visualization mode of optic nerve head (ONH) using SD-OCT. (D) Retinal nerve fiber layer (RNFL) and ONH analyses using SD-OCT. (E) Ganglion cell analysis using SD-OCT.

cmj-52-194-g001
FIG. 2

Optic disc photograph and analysis of different scanning regions obtained with SD-OCT in a glaucomatous patient. (A, B) The optic disc photographs show diffuse loss of the neuroretinal rim and enlarged cups in both eyes. (C) Print out of retinal nerve fiber layer (RNFL) and optic nerve head analyses. There is diffuse loss of RNFL in both eyes, as indicated by the parameter average RNFL thickness. There is also neuroretinal rim thinning and enlarged cup, as indicated by the topographic parameters rim area, vertical C/D ratio and average C/D ratio. (D) Ganglion cell analysis provided by the SD-OCT indicating diffuse loss of the thickness of the combined ganglion cell and inner plexiform layers in both eyes.

cmj-52-194-g002
FIG. 3

Optic disc photograph and SD-OCT of NAION in the acute stage. (A) The optic disc photograph shows optic disc swelling and hemorrhage in right eye. (B) SD-OCT shows a large optic disc area, increased vertical disc diameter and diffuse thickening of the peripapillary RNFL. (C, D) The OCT shows thinning of GCIPL thickness prior to thinning of RNFL thickness of right eye at 1 month after NAION.

cmj-52-194-g003

Notes

CONFLICT OF INTEREST STATEMENT None declared.

References

1. Huang D, Swanson EA, Lin CP, Schuman JS, Stinson WG, Chang W, et al. Optical coherence tomography. Science. 1991; 254:1178–1181.
crossref
2. Vizzeri G, Kjaergaard SM, Rao HL, Zangwill LM. Role of imaging in glaucoma diagnosis and follow-up. Indian J Ophthalmol. 2011; 59:Suppl 1. S59–S68.
crossref
3. Gabriele ML, Wollstein G, Ishikawa H, Kagemann L, Xu J, Folio LS, et al. Optical coherence tomography: history, current status, and laboratory work. Invest Ophthalmol Vis Sci. 2011; 52:2425–2436.
crossref
4. Savini G, Bellusci C, Carbonelli M, Zanini M, Carelli V, Sadun AA, et al. Detection and quantification of retinal nerve fiber layer thickness in optic disc edema using stratus OCT. Arch Ophthalmol. 2006; 124:1111–1117.
crossref
5. Johnson LN, Diehl ML, Hamm CW, Sommerville DN, Petroski GF. Differentiating optic disc edema from optic nerve head drusen on optical coherence tomography. Arch Ophthalmol. 2009; 127:45–49.
crossref
6. Kupersmith MJ, Sibony P, Mandel G, Durbin M, Kardon RH. Optical coherence tomography of the swollen optic nerve head: deformation of the peripapillary retinal pigment epithelium layer in papilledema. Invest Ophthalmol Vis Sci. 2011; 52:6558–6564.
crossref
7. Hedges TR 3rd, Vuong LN, Gonzalez-Garcia AO, Mendoza-Santiesteban CE, Amaro-Quierza ML. Subretinal fluid from anterior ischemic optic neuropathy demonstrated by optical coherence tomography. Arch Ophthalmol. 2008; 126:812–815.
crossref
8. Kim HG, Heo H, Park SW. Comparison of scanning laser polarimetry and optical coherence tomography in preperimetric glaucoma. Optom Vis Sci. 2011; 88:124–129.
crossref
9. Lee HS, Park SW, Heo H. Megalopapilla in children: a spectral domain optical coherence tomography analysis. Acta Ophthalmol. 2015; 93:e301–e305.
crossref
10. Mansouri K, Leite MT, Medeiros FA, Leung CK, Weinreb RN. Assessment of rates of structural change in glaucoma using imaging technologies. Eye (Lond). 2011; 25:269–277.
crossref
11. Sung KR, Wollstein G, Kim NR, Na JH, Nevins JE, Kim CY, et al. Macular assessment using optical coherence tomography for glaucoma diagnosis. Br J Ophthalmol. 2012; 96:1452–1455.
crossref
12. Leung CK, Cheung CY, Weinreb RN, Qiu Q, Liu S, Li H, et al. Retinal nerve fiber layer imaging with spectral-domain optical coherence tomography: a variability and diagnostic performance study. Ophthalmology. 2009; 116:1257–1263.
crossref
13. Park SB, Sung KR, Kang SY, Kim KR, Kook MS. Comparison of glaucoma diagnostic Capabilities of Cirrus HD and Stratus optical coherence tomography. Arch Ophthalmol. 2009; 127:1603–1609.
crossref
14. Bengtsson B, Andersson S, Heijl A. Performance of time-domain and spectral-domain Optical Coherence Tomography for glaucoma screening. Acta Ophthalmol. 2012; 90:310–315.
crossref
15. Sung KR, Na JH, Lee Y. Glaucoma diagnostic capabilities of optic nerve head parameters as determined by Cirrus HD optical coherence tomography. J Glaucoma. 2012; 21:498–504.
crossref
16. Mwanza JC, Oakley JD, Budenz DL, Anderson DR. Cirrus Optical Coherence Tomography Normative Database Study Group. Ability of cirrus HD-OCT optic nerve head parameters to discriminate normal from glaucomatous eyes. Ophthalmology. 2011; 118:241–248.e1.
crossref
17. Kotowski J, Folio LS, Wollstein G, Ishikawa H, Ling Y, Bilonick RA, et al. Glaucoma discrimination of segmented cirrus spectral domain optical coherence tomography (SD-OCT) macular scans. Br J Ophthalmol. 2012; 96:1420–1425.
crossref
18. Mwanza JC, Durbin MK, Budenz DL, Sayyad FE, Chang RT, Neelakantan A, et al. Glaucoma diagnostic accuracy of ganglion cell-inner plexiform layer thickness: comparison with nerve fiber layer and optic nerve head. Ophthalmology. 2012; 119:1151–1158.
crossref
19. Mwanza JC, Oakley JD, Budenz DL, Chang RT, Knight OJ, Feuer WJ. Macular ganglion cell-inner plexiform layer: automated detection and thickness reproducibility with spectral domain-optical coherence tomography in glaucoma. Invest Ophthalmol Vis Sci. 2011; 52:8323–8329.
crossref
20. Jung HH, Sung MS, Heo H, Park SW. Macular inner plexiform and retinal nerve fiber layer thickness in glaucoma. Optom Vis Sci. 2014; 91:1320–1327.
crossref
21. Sung MS, Kang BW, Kim HG, Heo H, Park SW. Clinical validity of macular ganglion cell complex by spectral domain-optical coherence tomography in advanced glaucoma. J Glaucoma. 2014; 23:341–346.
crossref
22. Sung MS, Yoon JH, Park SW. Diagnostic validity of macular ganglion cell-inner plexiform layer thickness deviation map algorithm using cirrus HD-OCT in preperimetric and early glaucoma. J Glaucoma. 2014; 23:e144–e151.
crossref
23. Park JW, Jung HH, Heo H, Park SW. Validity of the temporal-to-nasal macular ganglion cell-inner plexiform layer thickness ratio as a diagnostic parameter in early glaucoma. Acta Ophthalmol. 2015; 93:e356–e365.
crossref
24. Yu M, Lin C, Weinreb RN, Lai G, Chiu V, Leung CK. Risk of visual field progression in glaucoma patients with progressive retinal nerve fiber layer thinning: a 5-year prospective study. Ophthalmology. 2016; 123:1201–1210.
crossref
25. Leung CK, Yu M, Weinreb RN, Ye C, Liu S, Lai G, et al. Retinal nerve fiber layer imaging with spectral-domain optical coherence tomography: a prospective analysis of age-related loss. Ophthalmology. 2012; 119:731–737.
crossref
26. Leung CK, Chiu V, Weinreb RN, Liu S, Ye C, Yu M, et al. Evaluation of retinal nerve fiber layer progression in glaucoma: a comparison between spectral-domain and time-domain optical coherence tomography. Ophthalmology. 2011; 118:1558–1562.
crossref
27. Brusini P. Monitoring glaucoma progression. Prog Brain Res. 2008; 173:59–73.
crossref
28. Leung CK, Yu M, Weinreb RN, Lai G, Xu G, Lam DS. Retinal nerve fiber layer imaging with spectral-domain optical coherence tomography: patterns of retinal nerve fiber layer progression. Ophthalmology. 2012; 119:1858–1866.
crossref
29. Na JH, Sung KR, Baek S, Kim YJ, Durbin MK, Lee HJ, et al. Detection of glaucoma progression by assessment of segmented macular thickness data obtained using spectral domain optical coherence tomography. Invest Ophthalmol Vis Sci. 2012; 53:3817–3826.
crossref
30. Sung KR, Sun JH, Na JH, Lee JY, Lee Y. Progression detection capability of macular thickness in advanced glaucomatous eyes. Ophthalmology. 2012; 119:308–313.
crossref
31. Quigley HA, Miller NR, Green WR. The pattern of optic nerve fiber loss in anterior ischemic optic neuropathy. Am J Ophthalmol. 1985; 100:769–776.
crossref
32. Tesser RA, Niendorf ER, Levin LA. The morphology of an infarct in nonarteritic anterior ischemic optic neuropathy. Ophthalmology. 2003; 110:2031–2035.
crossref
33. Gonul S, Koktekir BE, Bakbak B, Gedik S. Comparison of the ganglion cell complex and retinal nerve fibre layer measurements using Fourier domain optical coherence tomography to detect ganglion cell loss in non-arteritic anterior ischaemic optic neuropathy. Br J Ophthalmol. 2013; 97:1045–1050.
crossref
34. Larrea BA, Iztueta MG, Indart LM, Alday NM. Early axonal damage detection by ganglion cell complex analysis with optical coherence tomography in nonarteritic anterior ischaemic optic neuropathy. Graefes Arch Clin Exp Ophthalmol. 2014; 252:1839–1846.
crossref
35. Park SW, Ji YS, Heo H. Early macular ganglion cell-inner plexiform layer analysis in non-arteritic anterior ischemic optic neuropathy. Graefes Arch Clin Exp Ophthalmol. 2016; 254:983–989.
crossref
36. Contreras I, Rebolleda G, Noval S, Muñoz-Negrete FJ. Optic disc evaluation by optical coherence tomography in nonarteritic anterior ischemic optic neuropathy. Invest Ophthalmol Vis Sci. 2007; 48:4087–4092.
crossref
37. Barboni P, Savini G, Valentino ML, Montagna P, Cortelli P, De Negri AM, et al. Retinal nerve fiber layer evaluation by optical coherence tomography in Leber's hereditary optic neuropathy. Ophthalmology. 2005; 112:120–126.
crossref
38. Contreras I, Noval S, Rebolleda G, Muñoz-Negrete FJ. Follow-up of nonarteritic anterior ischemic optic neuropathy with optical coherence tomography. Ophthalmology. 2007; 114:2338–2344.
crossref
39. Hayreh SS. Posterior ciliary artery circulation in health and disease: the Weisenfeld lecture. Invest Ophthalmol Vis Sci. 2004; 45:749–757.
crossref
40. Hayreh SS. The blood supply of the optic nerve head and the evaluation of it - myth and reality. Prog Retin Eye Res. 2001; 20:563–593.
crossref
41. Deleón-Ortega J, Carroll KE, Arthur SN, Girkin CA. Correlations between retinal nerve fiber layer and visual field in eyes with nonarteritic anterior ischemic optic neuropathy. Am J Ophthalmol. 2007; 143:288–294.
crossref
42. Akbari M, Abdi P, Fard MA, Afzali M, Ameri A, Yazdani-Abyaneh A, et al. Retinal ganglion cell loss precedes retinal nerve fiber thinning in nonarteritic anterior ischemic optic neuropathy. J Neuroophthalmol. 2016; 36:141–146.
crossref
43. Larrea BA, Iztueta MG, Indart LM, Alday NM. Early axonal damage detection by ganglion cell complex analysis with optical coherence tomography in nonarteritic anterior ischaemic optic neuropathy. Graefes Arch Clin Exp Ophthalmol. 2014; 252:1839–1846.
crossref
44. Somfai GM, Salinas HM, Puliafito CA, Fernández DC. Evaluation of potential image acquisition pitfalls during optical coherence tomography and their influence on retinal image segmentation. J Biomed Opt. 2007; 12:041209.
crossref
45. Han IC, Jaffe GJ. Evaluation of artifacts associated with macular spectral-domain optical coherence tomography. Ophthalmology. 2010; 117:1177–1189.e4.
crossref
46. Melo GB, Libera RD, Barbosa AS, Pereira LM, Doi LM, Melo LA Jr. Comparison of optic disk and retinal nerve fiber layer thickness in nonglaucomatous and glaucomatous patients with high myopia. Am J Ophthalmol. 2006; 142:858–860.
crossref
47. Arintawati P, Sone T, Akita T, Tanaka J, Kiuchi Y. The applicability of ganglion cell complex parameters determined from SD-OCT images to detect glaucomatous eyes. J Glaucoma. 2013; 22:713–718.
crossref
TOOLS
Similar articles