

 PDF
PDF ePub
ePub Citation
 Print
Print


INTRODUCTION
The recent widespread use of high-resolution ultrasound screening has resulted in the incidental discovery of thyroid nodules in >50% of the adult population.12 Fortunately, >90% of these nodules are benign; thus, they are usually monitored via thyroid ultrasonography or fine-needle aspiration. 34 For significantly sized nodules, percutaneous ethanol injection or radiofrequency ablation is available as a treatment option.567 However, only a few studies are available on the natural progression or regression of benign thyroid nodules, and large-scale studies on the subject are nonexistent.
In the present study, we performed a retrospective analysis of the natural progression or regression of benign thyroid nodules detected via fine-needle aspiration over an 11-year period. Our objectives were to identify factors that affect the size of benign thyroid nodules and to use our developed model to predict nodule size.
MATERIALS AND METHODS
1. Subjects
Our study subjects were selected from among 1,564 patients with benign thyroid nodules (2,469 nodules) that were diagnosed between January 2001 and December 2011 via thyroid ultrasound-guided fine-needle aspiration. We excluded 505 nodules (131 nodules with unknown initial volumes, and 374 nodules subjected to cystic fluid aspiration, percutaneous ethanol injection, or radiofrequency ablation), leaving 1,261 study subjects (1,964 nodules) in the retrospective analysis.
2. Classification and definitions
We analyzed the patients' data, including sex, age, the cystic proportion on ultrasonographic images, the initial nodule volume at diagnosis, and the follow-up duration in order to examine the association of these variables with increasing nodule size. Of the nodules examined, 1,867 (95.1%) were found in females, and 97 (4.9%) were found in males. According to the cystic proportion of the nodules, we grouped the patients into the following six groups: 0%, 0-25%, 25-50%, 50-75%, 75-100%, and 100%. The initial nodule volumes were divided into 10 equal groups according to the distribution of the nodules. The follow-up periods were divided according to the number of years, ranging from <1 year to >8 years. The mean follow-up period was 3.67 years. Regarding change in nodule size, the following three groups were defined: a group in which nodule size increased (nodules with a volume increase >15% of the initial volume at diagnosis); a group in which nodule size did not change significantly (nodules with an increase in volume ranging from 0% to 15%); and a group in which nodule size decreased (nodules with an increase in size of <0%).
3. Nodule size
Nodules were considered to have increased in size if the total volume increased by >15%.2 The volume was calculated by using the following formula: length×width×depth ×π/6, where the length, width, and depth were measures of the thyroid nodules obtained from ultrasonographic images. The following factors were analyzed to determine whether they were associated with increased nodule size: sex, age, cystic proportion, nodule volume at initial diagnosis, and the follow-up duration.
4. Statistical analysis
Data were analyzed from the group in which the size of nodules increased. The multiple regression model is one of the most widely used methods to cope with data analysis in order to eliminate possible associations. The Bonferroni test identified 10 data points as outliers that would negatively affect the regression model. A simple technique is to remove the outliers and then apply classical inferential procedures. However, rejecting outliers reduces the sample size and variances could be underestimated. Moreover, robust procedures behave better than techniques based on the removal of outliers. We estimated the parameters by using iteratively reweighed least squares to solve the robustness problems. The rlm function within the programming language of R (version 3.0.2, R Foundation for Statistical Computing) of the MASS (Modern Applied Statistics with S) package was used to perform the robust regression model. The significance level was set at p<0.05.
RESULTS
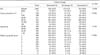
We divided the 1,261 patients (1,964 nodules) who were diagnosed with benign thyroid nodules via repeat fine-needle aspiration during the follow-up period into three groups according to nodule growth size. The findings were as follows: increase group (>15% volume increase), 906 nodules (46.1%); no significant change group (0-15% volume change), 184 nodules (9.4%); and decrease group (<0% volume change), 874 nodules (44.5%). The increase group had a higher proportion of females than did the decrease group (p=0.026) as well as a longer follow-up period and a higher cystic proportion (p<0.001; Table 1).
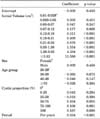
To explain the changes in nodule size, the following model was created by using the following data from the group showing an increase in nodule size: initial nodule volume, sex, age, cystic proportion, and follow-up period. The Bonferroni test identified 10 data points as outliers that would negatively affect the regression model. Since this required a robust regression model, we modified the parameters via iteratively reweighted least squares to explain the association (Table 2). For example, we entered the following data for the coefficient values: initial nodule volume at 1.5 cm3, a male in his 30s, 60% cystic proportion, and 15 years of follow-up:
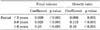
The final volume was positively correlated with a larger initial volume, higher cystic proportion, and longer follow-up period. As for the extent of the volume increase according to the follow-up duration, nodules with a follow-up duration of ≥6 years tended to grow more rapidly than nodules with shorter follow-up periods (Table 4). Although statistically insignificant, the final nodule volume was positively correlated with increasing age.
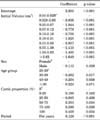
Next, we created a model to explain the growth ratio by incorporating the final and initial volumes. As previously mentioned, the estimated parameters were obtained via a robust regression model (Table 3). For example, in the case of an initial nodule volume of 1.5 cm3, a male in his 30s, 60% cystic proportion, and 15 years of follow-up, the expected growth ratio is as follows:
This is a volume increase of approximately 3.446 times.
The growth ratio was positively correlated with a smaller initial volume and a higher cystic proportion. Coefficients that were estimated according to the follow-up duration are shown in Table 3. Similar to the volume increase, nodules with a follow-up period of ≥6 years exhibited higher growth rates (Table 4). The growth ratio was negatively correlated with a larger initial nodule size.
DISCUSSION
In this study, we divided 1,964 benign thyroid nodules (1,261 patients) detected during an 11-year period (mean length of follow-up, 3.67 years per nodule) into the following three groups: nodules with an increase in size of >15% (906 cases [46.1%]), nodules with no significant change in size (0-15% increase in size, 184 cases [9.4%]), and nodules with a decreased size (<0% increase in size, 874 cases [44.5%]). Our findings indicated that the follow-up duration tended to be longer with higher proportions of females and a higher cystic portion in the group with an increase in size than in the group in which size decreased.
In the group showing an increase in nodule size, we analyzed potential predictive factors of thyroid nodule size. Our findings showed that a larger initial nodule volume, higher cystic proportion, and longer follow-up were associated with an increasing nodule size.
According to a study by Alexander et al.,2 an increasing nodule size was positively correlated with a high proportion of solid matter rather than a high cystic proportion, which can be observed on ultrasonographic images. However, According to a study by Lim et al.,8 an increase in nodule size was not associated with the characteristics observed on ultrasonographic images (e.g., cystic proportion or calcification, echogenicity, or an irregular margin). In our study, an increasing nodule size was associated with a high cystic proportion.
Quadbeck et al.9 reported that the initial nodule size at diagnosis was not associated with a further increase in the nodule size. In contrast, a recent study by Kim et al.10 reported that nodules with initial measurements of >1 cm had a higher likelihood of a size increase compared with smaller nodules. In addition, nodules with a ≥4-year follow-up period reportedly had a significant size increase compared with those followed up for ≤2 years. Such findings are congruent with our study findings, which indicated a significant size increase in the nodules with a follow-up period of ≥6 years. Meanwhile, age and sex had little association with an increased thyroid nodule size. This is also consistent with the findings of previous studies.891011
This study had some limitations. First, the ultrasonographic measurements were made by multiple technicians, which may have affected the consistency of the nodule size and cystic proportion measurements. Second, a selection bias may exist, because nodules with compromised records (e.g., unavailable size measurements and ultrasonographic images) were excluded from our retrospective study. Third, we defined an increase in volume as a >15% increase in the initial volume, which may have resulted in discrepant findings from those of previous studies, which used 15%, 20%, 30%, and 50% increases as references. Finally, the nodules were not grouped according to other characteristics found on the ultrasonographic images (e.g., calcification, echogenicity, or an irregular margin). However, previous studies have reported that ultrasonographic characteristics are not associated with changes in nodule size.8
An increasing trend in nodule size was observed in naturally progressing/regressing benign thyroid nodules.2 Although most of these nodules are only monitored, percutaneous ethanol injection or radiofrequency ablation is performed for continually growing nodules that measure >2 cm for cosmetic reasons and to ensure proper functioning.12 In our study, we confirmed the factors that affect the nodule size by analyzing the thyroid nodules that increased in size during the follow-up period. More specifically, we established a model that can be used to predict changes in nodule size. For instance, if a 60% cystic nodule with an initial measurement of 1.5 cm3 and 15 years of follow-up is discovered in a male in his 30s, then the predicted size can be calculated as 4.938 cm3. This model can be used to determine an optimal schedule for percutaneous ethanol injection or radiofrequency ablation treatment for continually growing nodules during the follow-up period.
 XML Download