

 PDF
PDF ePub
ePub Citation
 Print
Print


INTRODUCTION
Imatinib mesylate (imatinib), a potent BCR-ABL tyrosine kinase inhibitor (TKI), has been widely used for newly developed chronic myeloid leukemia (CML).1 However, the failure rate in achieving optimal response to imatinib reaches up to 20% to 30%.2 For these patients, second-generation TKIs (dasatinib or nilotinib) may be used as alternatives. About half of patients failing to achieve optimal response to imatinib can be rescued with second-generation TKIs. However, resistance to these second-generation TKIs also occurs.3,4,5,6
BCR-ABL1 tyrosine kinase domain mutations are a main mechanism of imatinib resistance and account for 40% to 50% of all cases of imatinib resistance.7,8 Other BCR-ABL-independent mechanisms in imatinib resistance remain unclear. One mechanism of resistance to imatinib is known to be associated with drug transporters. Higher plasma imatinib trough levels is associated with optimal response in CML patients.9 TKIs including imatinib are transported by influx or efflux pumps; hence, these drug transporters have been postulated to influence TKI responses.
Human organic cation transporter 1 transporter (OCT-1, or SLC22A1) induces imatinib influx into cells. In clinical studies, the activity of OCT-1 and the mRNA expression of OCT-1 correlate well with the imatinib response rate in the aspect of molecular response (MR) and overall survival.10,11,12 Dose escalation of imatinib may overcome OCT-1 transporter activity in patients with correspondingly low imatinib plasma levels; however, the transport of newly developed second-generation TKIs, dasatinib or nilotinib, is not mediated by OCT-1.13
In addition, imatinib is a substrate for the adenosine triphosphate binding cassette (ABC) transporters, ATP binding cassette B1 (ABCB1) and ABCG2 (breast cancer resistance protein, or BCRP). Accordingly, ABCB1 and ABCG2 might be influencing pharmacokinetics and intracellular or systemic levels of imatinib. Both ABCB1 and ABCG2 contribute to resistance by extruding imatinib from hematopoietic cells.14,15 Recently, there have been several reports that intracellular levels of nilotinib and dasatinib are influenced by the efflux ABC transporters such as ABCB1 or ABCG2.13,16,17 In these studies, ABCB1 and ABCG2 mRNA expression revealed higher levels in dasatinib-resistant cell lines, indicating an important role of drug efflux transporters on second-generation TKI resistance.17,18 However, most of these studies were performed in vitro, and gene expression levels were usually assessed at a single time point.
In this study, we evaluated the mRNA expression levels of OCT-1, ABCG2, and ABCB1 before and after imatinib exposure in imatinib-resistant CML and analyzed the changes in drug transporter expression levels. We also explored the relationship between the expression of these genes and treatment outcomes of imatinib and second-generation TKIs.
MATERIALS AND METHODS
1. Patients and treatment protocol
Twenty-four adult CML patients (aged 34-72 years) who showed imatinib resistance as a first-line therapy were enrolled and their treatment data were analyzed retrospectively. All patients were diagnosed as having chronic phase CML before imatinib treatment in accordance with the 2008 World Health Organization criteria.19 Two patients who showed TKD mutations during imatinib treatment were excluded from this study. Informed consent was provided for all enrolled patients. The study design was approved by the institutional review boards. All 22 patients were administered imatinib (400 mg/day) for more than 12 months. Median treatment duration with imatinib was 26.9 months (range, 12.4-85.4 months). Shortly after imatinib resistance was detected, 10 and 12 patients started dasatinib (100 mg/day) and nilotinib (600 mg/day) treatment as a second-line therapy, respectively. Bone marrow samples were obtained twice, before imatinib treatment and at the point of detecting resistance to imatinib (before starting second-generation TKIs).
Treatment responses to imatinib and second-generation TKIs were determined on the basis of standard recommendations: the European LeukemiaNet20 and National Comprehensive Cancer Network guidelines.21 Briefly, complete hematologic response was defined as a white blood cell count <10×109/L; basophils <5%; an absence of myelocytes, promyelocytes, or myeloblasts in peripheral blood; platelet counts <450×109/L; and no palpable spleen. Cytogenetic response (CyR) was defined as the ratio of Philadelphia chromosomes (Ph+) in bone marrow cell metaphases after TKI treatment to those before treatment (eg, complete cytogenetic response, or CCyR: no Ph+ metaphases). Molecular response (MR) was defined as the ratio of BCR-ABL1 transcripts by real-time quantitative polymerase chain reaction (qPCR) after TKI treatment to those before treatment (eg, major molecular response, or MMR: BCR-ABL1/ABL1≤0.1% with the international scale).20 The definition of primary imatinib resistance was an absence of a complete hematologic response by 3-6 months, any CyR by 6 months, major CyR by 12 months, or CCyR by 18 months. Disease progression following prior response to imatinib was defined as secondary resistance.21
Optimal response with second-generation TKIs was defined as BCR-ABL1≤10% or Ph+<65% at 3 months, BCR-ABL1≤10% or Ph+<35% at 6 months, BCR-ABL1 <1% or Ph+ 0 at 12 months, and then BCR-ABL1≤0.1% at any time. Failure with second-generation TKIs was defined as an absence of complete hematologic response or Ph+>95% or developing new mutations at 3 months, BCR-ABL1>10% or Ph+>65% or newly developed mutations at 6 months, or BCR-ABL1>10% or Ph+>35% or the occurrence of new mutations at 6 months. Loss of complete hematologic response, CCyR/partial CyR (PCyR) or MMR, developing clonal chromosome abnormalities in Ph+ cells, or new mutations were also considered as failure.20
2. Expression of drug transporters
Genomic DNA was obtained from diagnostic bone marrow cryopreserved mononuclear cells with a QIAamp DNA Blood Mini Kit (Qiagen, Valencia, CA, USA). To analyze mRNA expression of OCT-1, ABCG2, and ABCB1, RNA was obtained from at least 1×10⁶ cells with TRIzol Reagent (Invitrogen, Carlsbad, CA, USA). QuantiTect Reverse Transcription Kit (Qiagen) was used for cDNA synthesis. PCR amplification was performed with the following primers: OCT-1, (forward) 5'-CTG AGC TGT ACC CCA CAT TCG-3', (reverse) 5'-CCA ACA CCG CAA ACA AAA TGA-3'22; ABCG2, (forward) 5'-AGA TGG GTT TCC AAG CGT TCA T-3', (reverse) 5'-CCA GTC CCA GTA CGA CTG TGA CA-(3)'23; ABCB1, (forward) 5'-AGA CAT GAC CAG GTA TGC CTA T-(3)', (reverse) 5'-AGC CTA TCT CCT GTC GCA TTA-3'22 (GeneWorks Pty. Ltd., Adelaide, SA, Australia). qPCR was performed by use of a Rotor Gene 3000 real-time PCR thermal cycler (Corbett Biosciences, San Francisco, CA, USA) with a Rotor-Gene SYBR Green PCR Kit (Qiagen). mRNA expression of BCR [(forward) 5'-CCT TCG ACG TCA ATA ACA ACG AT-3', (reverse) 5'-CCT GCG ATG GCG TTC AC-3')]22 was used for an assessment of the expression ratio of these three drug transporters.
3. Statistical analysis
Fisher's exact test (categorical value) and Mann-Whitney U test (continuous data) were used for between-group comparisons. For comparison of gene expression levels between imatinib-naïve and imatinib-exposed samples, Wilcoxon signed-rank test was used. Survival was assessed through the use of Kaplan-Meier survival curves and estimates. The log-rank test was used for comparison of survival distributions between groups. p<0.05 was regarded to have statistical significance. All statistical analyses were carried out through the use of SPSS software (version 18.0, SPSS Inc., Chicago, IL).
RESULTS
1. Patient's characteristics
A total of 22 imatinib-resistant patients (aged 34-72 years) without TKD mutation were analyzed in this study (Table 1). Sokal's risk evaluation at diagnosis showed that 12 (54.5%) were high risk, 8 (36.4%) were intermediate risk, and 2 (9.1%) were low risk. Median treatment duration of imatinib was 26.9 months (range, 12.4-85.4 months). During imatinib treatment, 6 (27.3%) and 3 (13.6%) patients achieved CCyR and MMR, respectively. A total of 13 (59.1%) and 9 (40.9%) patients switched to second-generation TKIs owing to primary and secondary imatinib resistance, respectively.
With salvage therapy with second-generation TKIs, 54.5% and 40.9% of the imatinib-resistant patients had CCyR and MMR. Of the patients with imatinib resistance, 54.5% of the patients with imatinib resistance could have optimal response with second-generation TKIs (Table 1). No significant differences were found in baseline characteristics or outcome between dasatinib- and nilotinibtreated patients. Median follow-up time with second-generation TKIs was 51.2 months (range, 8.4-107.5 months).
2. Changes in drug transporter expression levels and treatment outcomes with imatinib
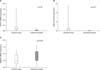
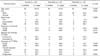
The mRNA expression of the three drug transporters before administering imatinib and at the point of detecting imatinib resistance was analyzed. By use of pair-wise analysis, OCT-1 expression was significantly reduced in samples obtained at the point of imatinib resistance compared with the expression in imatinib-naïve samples (median, 0.3965 vs. 0.0099, p<0.01). In addition, ABCG2 expression was also significantly decreased after imatinib treatment (0.2192 vs. 0.0282, p<0.01). Median mRNA expression of ABCB1 in imatinib-exposed samples was higher than that in imatinib-naïve samples; however, the difference was not statistically significant (0.5042 vs. 0.7785, p=0.062). In addition, ABCB1 expression levels were highly variable compared with OCT-1 and ABCG2 in imatinib-exposed samples (Fig. 1).
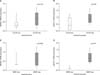
The mRNA expression of the three drug transporters in imatinib-naïve samples did not significantly affect responses to imatinib. On the other hand, ABCB1 expression in imatinib-exposed samples was significantly lower in patients achieving CCyR (0.4131 vs. 0.8440, p<0.05) and MMR (0.1141 vs. 0.8761, p<0.01) than in other patients (Table 2, Fig. 2). Conversely, the mRNA expression of ABCG2 in imatinib-exposed samples was slightly lower in patients achieving CCyR (p=1.000) and MMR (p=0.510) during imatinib treatment; however, the difference was not significant. The expression values of these three drug transporters in both imatinib-naïve and imatinib-exposed samples did not affect overall imatinib-resistant patterns.
3. Expression of drug transporters and treatment outcomes following second-generation TKIs
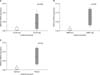
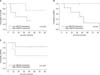
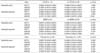
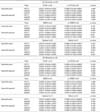
In dasatinib-treated patients (n=10), the mRNA expression levels of the three drug transporters in imatinib-naïve samples were not significantly associated with response rates. Also, OCT-1 and ABCB1 mRNA expression levels in imatinib-exposed samples did not affect the treatment outcome of dasatinib. Conversely, at the point of imatinib resistance, median mRNA expression levels of ABCG2 were significantly lower in patients achieving MMR (0.0050 vs. 0.0722, p<0.05) than in patients with failed response to dasatinib (Table 3A, Fig. 3). In terms of overall response to dasatinib, patients with lower ABCG2 expression levels in imatinib-exposed samples demonstrated a higher rate of optimal response (0.0050 vs. 0.0722, p<0.05). Furthermore, patients with higher ABCG2 expression after imatinib needed a significantly longer time to achieve MMR (median; not applicable vs. 43.9 months, p<0.05) with dasatinib than did those with lower ABCG2 expression after imatinib treatment (Fig. 4). Patients with higher ABCG2 expression after imatinib also showed shorter progression-free survival than did those with lower ABCG2 expression after imatinib; however, there was no statistical significance (p=0.207, Fig. 4). On the other hand, there was no significant correlation between the expression levels of the three drug transporters before or after imatinib and clinical outcome in nilotinib-treated patients (n=12; Table 3B).
DISCUSSION
Chronic imatinib exposure may change the expression patterns of drug transporters, which can affect the treatment outcome of imatinib. In studies in vitro, these drug transporter expression patterns are diverse depending on the cell type, imatinib concentration, and imatinib treatment duration.17,24 One in vitro study demonstrated increased OCT-1 expression levels with increasing doses of imatinib.17 In that study, prolonged exposure to imatinib also induced expression of both ABCG2 and ABCB1 in imatinib- resistant CML cells. However, with time, the overexpression of ABCB1 progressively declined to baseline expression levels, whereas the overexpression of ABCG2 was maintained throughout the study. Another in vitro study using intestinal epithelial Caco2 cells revealed that prolonged exposure to imatinib affected the expression patterns of genes potentially involved in drug transport. In that study, imatinib exposure induced ABCBG2 and ABCB1 expression, and chronic imatinib administration to Caco2 cells reduced the intracellular imatinib concentration, suggesting up-regulation of ABCB1 and ABCG2 drug efflux transporters.25
There have been few in vivo clinical studies of the relationship between these drug transporter expression levels and clinical outcomes. Furthermore, these in vivo studies offered conflicting results. One study showed that the mean pre-imatinib OCT-1 expression level was eight times higher in imatinib responders than in nonresponders.26 In that study, the ABCB1 and ABCG2 expression levels doubled in bone marrow mononuclear cells in nonresponders with imatinib treatment. On the contrary, another study revealed that long-term imatinib exposure did not induce the ABC transporters.27
In our study, OCT-1 and ABCG2 mRNA expression showed a significant change after imatinib treatment. At the time point of imatinib resistance, mRNA expression levels of OCT-1 were significantly decreased compared with those before imatinib exposure. ABCG2 expression also decreased after imatinib treatment. Conversely, ABCB1 expression was slightly elevated after long-term imatinib exposure, but there was no statistical significance to this finding. Interestingly, these ABCB1 expression levels showed significant variation after imatinib-exposed samples in imatinib-resistant patients. A recent study also demonstrated that there was considerable diversity in the drug transporter expression levels including ABCB1 in imatinib- resistant patients, whereas the expression levels remained constant during follow-up samples in imatinib responders.28 Furthermore, the drug transporter expression levels in imatinib-naïve samples in imatinib-resistant patients did not affect the treatment outcome of imatinib in our study. Only higher ABCB1 expression levels in imatinib-exposed samples showed a negative impact on imatinib responses. Most other studies have evaluated the drug transporter expression levels using single time point samples usually collected at diagnosis to compare clinical outcomes with TKIs; however, these drug expression levels in imatinib-resistant patients were not stable. Therefore, sequential monitoring of these drug transporter expressions may be warranted in patients treated with TKIs.
The resistance mechanisms to second-generation TKIs are still unclear. The intracellular levels of nilotinib29 and dasatinib13 are not affected by OCT-1 activity. Some previous studies reported that the intracellular levels of nilotinib and dasatinib were influenced by the activity of the efflux ABC drug transporters such as ABCG2 and ABCB1. An in vitro study demonstrated that OCT-1 activity was not correlated with the intracellular dasatinib concentration; however, the efflux of dasatinib was mediated by both drug efflux transporters, ABCG2 and ABCB1.18 Nilotinib is also known to be a substrate of ABCG2 or ABCB1. However, a recent experiment revealed that nilotinib may be transported by ABCB1, but does not interact strongly with ABCG2.24,30 In the current study, patients achieving the optimal response including MMR with dasatinib had lower ABCG2 expression levels in imatinib-exposed samples compared with failed patients. Furthermore, higher ABCG2 expression in imatinib-exposed samples also showed a trend of shorter progression-free survival in patients treated with dasatinib. However, nilotinib-treated patients were not affected by the expression levels of the three drug transporters before and after imatinib exposure, indicating that there are different interactions with nilotinib and drug efflux transporters. In addition, both drugs demonstrated no significant relationship between drug transporter expression levels in imatinib-naïve samples and clinical outcomes, suggesting that the drug transporter expression levels may be assessed just before starting treatment with second-generation TKIs.
In conclusion, OCT-1 and ABCG2 mRNA expression significantly decreased after imatinib treatment in imatinib-resistant CML patients. The ABCB1 expression level in imatinib-exposed samples was significantly higher in poor imatinib responders. On the other hand, a higher expression level of ABCG2 in imatinib-exposed samples was associated with poor treatment outcome in dasatinibtreated patients.
 XML Download