

 PDF
PDF ePub
ePub Citation
 Print
Print


INTRODUCTION
To date, no successful treatments for severe spinal cord injury are available because damaged nerve fibers are incapable of regeneration.1 Novel therapeutic approaches such as the transplantation of stem cells or neurons have been suggested.2,3 However, monitoring the therapeutic effect with conventional imaging is limited.4 Molecular imaging such as the use of positron emission tomography (PET) has been proposed for monitoring changes in the spinal cord.
No reports are available on whether 18F-fluorodeoxyglucose (FDG) uptake in the spinal cord changes on serial PET/CT measurements performed in the same healthy population. There are several reports about FDG uptake in the spinal cord.5-7 However, those studies were done in patients with a cancer history and were conducted without follow-up PET/CT. Therapy such as radiation therapy, chemotherapy, or surgery might affect FDG uptake in the spinal cord.8-12 Also, many diseases, including spinal metastasis,13,14 spinal sarcoidosis,15,16 and myelopathy,17-19 can increase FDG uptake in the spinal cord. In addition, knowledge about possible variations of FDG uptake in the spinal cord of a normal population is fundamental for monitoring the spinal cord in various clinical settings.
Therefore, we examined whether FDG uptake in the spinal cord significantly changes on follow-up PET/CT imaging performed in the same healthy group.
MATERIALS AND METHODS
1. Patient selection
The study was carried out in accordance with the Declaration of Helsinki. This was a retrospective observation study. We enrolled people who underwent FDG PET/CT twice for cancer screening from January 2007 to December 2010. All PET/CT data were reevaluated by two nuclear medicine physicians. By screening the medical records and PET/CTs of these patients, we excluded all subjects with these characteristics: 1) a cancer history, 2) an abnormal PET/CT finding suggestive of malignant disease in any organ, 3) inflammatory or congenital vertebral disease, 4) compression fracture of the vertebra, 5) degenerative vertebral disease affecting the vertebral canal or normal curvature, 6) a history of a spinal operation, 7) a spinal tumor, or 8) a neurological deficit such as is seen after cerebral infarction or post-herpetic neuralgia. We also excluded those whose fusion images of PET/CT were incorrect owing to patient movement during the imaging. In the end, a total of 60 PET/CT images of 30 healthy people were analyzed. Twenty-four males and six females were enrolled. Age at first PET/CT was 52.80±8.19 years (mean±standard deviation; range: 42-77 years). The mean interval between the two PET/CT scans was 2.80±0.94 years (range: 0.93-3.62 years).
2. FDG PET/CT
After the healthy subjects had fasted for at least 6 hours, approximately 375 MBq of FDG was injected via an antecubital vein. FDG PET/CT scanning was performed by using a dedicated PET scanner (DST PET/CT; Discovery ST PET-CT, General Electric Medical Systems, Milwaukee, WI, USA). Non-contrast-enhanced CT scans (helical, 8 slice, 120 Kvp, 10-130 mAs, and 3.79-mm slice thickness) were performed for attenuation correction. PET scans (3 min/bed, 6-8 beds) were obtained at 60 minutes after FDG injection. PET and CT data were reconstructed by OSEM (ordered subset expectation maximization) after attenuation correction [128×128 matrix, 3.27-mm slice thickness, subsets: 21, iteration: 2, post-Filter: 5.14 FWHM (mm), loop-Filter: 4.69 FWHM, diameter: 60 cm].
3. Drawing region-of-interest for SUVmax
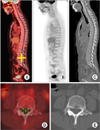
The standardized uptake value (SUVmax) of the spinal cord was obtained at each vertebral level (the midpoint level of each vertebral body) by using Advanced Workstation 4.3 (GE Healthcare Bio-Sciences). Fig. 1 describes the methods. We recorded all SUVmax values of the spinal cord from C1 to L5.
4. Statistical analysis
For internal control, we used the SUVmax of the spinal cord at the L5 vertebra. From this, the cord-to-background ratio (CTB=SUVmax of each level/SUVmax of L5 level) was calculated.6 Statistical analyses were performed with SPSS software (version 19.0).
The Kolmogorov-Smirnov test was used to test the normality of continuous variables. Based on the Kolmogorov-Smirnov test, the nonparametric test was used in this study. We used significance levels of 0.001 and 0.005. The mean CTB of each vertebral level was obtained for the first and second PET/CT scans. The pattern of spinal uptake was determined by drawing a graph based on the mean CTB of each vertebral level by using the clustered multiple variables graph function of Medcalc (version 11.2.1.0.).
The Wilcoxon signed rank test was used for comparison of the CTB at each vertebral level between the first and second PET/CT scans. Mann-Whitney's U test was used for comparison of CTBs between males and females. Spearman's correlation analysis was used to determine the relationship between age and the CTB of each vertebral level. To assess whether the second PET/CT scan in a warmer season showed lower spinal uptake than the first PET/CT scan in a colder season, we used Fisher's exact test.
RESULTS
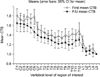
The mean CTB in healthy subjects showed a decreasing pattern along the spinal cord from the cervical to the lumbar vertebrae. There were two peaks at the lower cervical level (C4-6) and at the lower thoracic level (T12), respectively (Fig. 2).
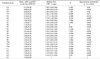
The graph of the second PET/CT was lower than the graph of the first PET/CT (Fig. 2). However, the Wilcoxon signed rank test (with a significance level of p<0.001) failed to show significant differences in FDG uptake in the spinal cord for each vertebral level between the first and second PET/CT (Table 1). With a significance level of p<0.005, only two levels (C6 and T10 vertebrae) showed a significant difference between the first and second PET/CT (Table 1, Fig. 2).
For C6 and T10, we analyzed whether the difference in season resulted in lower spinal uptake on the second PET/CT than on the first PET/CT. However, Fisher's exact test revealed no significant difference (p=1).
Mann-Whitney's U test revealed that there was no significant difference in CTB between males and females (p>0.1). Spearman's correlation analysis revealed that there was no correlation between age and CTB at any vertebral level (p>0.001). Even though this finding did not meet the significance levels of this study, a moderate positive correlation between age and CTB was seen at several vertebral levels: C6 (rho=0.4, p=0.029), C7 (rho=0.385, p=0.035), T6 (rho=0.429, p=0.018), T8 (rho=0.366, p=0.048), and L3 (rho=0.431, p=0.017). All other levels showed insignificant differences (p>0.05).
DISCUSSION
The present study in which two serial FDG PET/CT scans in the same healthy subjects were analyzed showed changes in spinal cord FDG uptake at the level of the C6 and T10 vertebrae (p<0.005). The individual FDG uptake in the spinal cord in each person showed a highly variable pattern. Therefore, we used a strict standard of p<0.001 or p<0.005 to determine statistical significance. Even under this strict standard, we found that FDG uptake in the spinal cord changed significantly only at the vertebral levels of C6 and T10 (p<0.005). As far as we are aware, this is the first report showing differences in spinal uptake in normal subjects with serial PET/CT measurements.
The peaks of FDG uptake in the spinal cord in our study correlate well with the results of previous reports.5-7 Do et al.6 reported two peaks of uptake: at the T11-T12 vertebral body levels and at the C4 vertebral body level. McCarville et al.7 reported two peaks at the mid-cervical and lower-thoracic cord in a study of children with a history of malignancy. Do et al.6 and McCarville et al.7 provided both anatomical and functional reasons to explain the FDG peaks in the spinal cord. Anatomically, the cross-sectional area of the spinal cord decreases along the spinal cord in a cranial to caudal direction with two exceptions that are related to cervical and lumbar enlargement.20 Cervical enlargement of the spinal cord is from the C3 to the T2 vertebral body level (spinal cord segments C6 to C8). Lumbar enlargement of the spinal cord is from the T9 to the T12 vertebral body level (spinal cord segment L4 to S1).20 (Note that vertebral body levels do not correspond to the same-numbered spinal cord segments.) Do et al.6 pointed out that the amount of gray matter in the spinal cord may partly influence the pattern of FDG uptake. The amount of gray matter is known to be most abundant in the spinal cord at the C4 to C8 vertebral levels and at vertebral levels of L4 to S1.21,22 Functionally, the cervical cord modulates neurologic transmission from the upper extremities; the distal cord from segment T11 through L1 modulates neurologic transmission from the lower extremities. Do et al.6 suggested that the FDG peak in the spinal cord represents the neurological demands at these levels. Therefore, these two levels of the spinal cord would be expected to be more metabolically active than other levels.
Our results may support the hypothesis that the FDG peaks in the spinal cord at the levels of cervical and lumbar enlargement are partially due to the functional activity of the corresponding spinal cord segments. The changes at the C6 and T10 vertebral levels were not associated with age in our subjects, because in our study, FDG uptake in the spinal cord at each vertebral level was not correlated with age. The reason for the differences in uptake at the C6 and T10 vertebral levels is not clear, but we speculate that it might be due to differences in neurologic demand such as sensory stimuli during the second PET/CT scan. There are some reports showing that sensory stimuli to the extremities increase metabolic activity in the affected level of the spinal cord on functional magnetic resonance imaging.23,24 It is well known that brain FDG metabolism is affected by sensory stimuli.25,26 However, as far as we know, there has been no FDG PET study reporting on spinal cord activity and sensory stimuli to the extremities.
Amin et al.5 reported an interesting result in spinal cord uptake in cancer patients. They found that spinal cord uptake occurred more often in winter than in summer.5 They explained that a fasting state, a stressful state, and cold weather could be additional physical stress factors. They suggested that activation of the sympathico-adrenal system in such circumstances inhibits glucose uptake by peripheral tissue by inhibiting insulin release, inducing insulin resistance, and increasing hepatic glucose production; thus, increased glucose flux to the CNS occurs.5,27 In our study, we analyzed whether the seasonal difference (colder to warmer season) affected the lower spinal uptake on the second PET/CT compared with the first PET/CT. We failed to show a significant result. However, most of the first PET studies of our study were conducted during February to April (regarding first PET/CT: 1 case in January, 7 cases in February, 9 cases in March, 6 cases in April, 2 cases in May, 2 cases in June, and 1 case in October). This might cause the different result between our study and that of Amin et al.5
There are limitations to this study. There was no correlation between CTB and age in our study. However, FDG uptake on the follow-up PET/CT seemed to be lower than that on the first PET/CT (Fig. 2), even though it was not statistically significant at the level of p<0.001. However, owing to the small number of enrolled subjects, the analysis of the correlation between age and FDG uptake of the spinal cord is limited. Moreover, we were not able to enroll subjects younger than 42 years. Most enrolled subjects were in their forties (n=12) or fifties (n=14). The interval between the two PET/CT scans was only 2.80±0.94 years (mean). Previously, McCarville et al.7 reported that the metabolic activity of the spinal cord increases with age in children. Therefore, further study with a larger population with various age groups is needed for the analysis of effect of aging on spinal cord FDG uptake. In addition, we did not exclude subjects with arthritis or other diseases in the extremities. There is a report showing that arthritis in the rat knee induces changes in the immunoreactivity of the spinal cord.28 Furthermore, tactile or thermal stimuli to the extremities before or during the FDG injection could not be strictly controlled in the PET/CT procedure. In addition, we only measured FDG uptake at the mid-vertebral body level. Volumetric data were not used. Another limitation is that we used OSEM, not fully 3D ordinary-Poisson LOR-OSEM with PSF (LOR-OSEM-3D-PSF; HD*PET) as did Amin et al.5 Despite these limitations, however, the results of this study are meaningful as a baseline reference in the follow-up of metabolic changes to the spinal cord.
 XML Download