

 PDF
PDF ePub
ePub Citation
 Print
Print


INTRODUCTION
Proteinuria is a cardinal sign of diverse renal diseases and can result in foamy urine. Foaming occurs because albumin has a soap-like effect that reduces the surface tension of urine.1 It is generally thought that foamy urine is an early sign of renal disease, and, thus, that patients with this condition should be further evaluated. A recent PubMed search recovered no articles describing the proportion of patients with foamy urine who also show clinically significant proteinuria or microalbuminuria. We propose that the apparent lack of studies on foamy urine is due to the absence of an accepted clinical definition for this condition.
It is essentially impossible to arrive at a definition of foamy urine from subjective observations, although such data could provide a basis for designing objective research studies. We report here on a descriptive study that aimed to determine the proportion of patients with foamy urine who also exhibited overt proteinuria or microalbuminuria. Our secondary objective was to determine the risk factors and comorbidities associated with true proteinuria.
MATERIALS AND METHODS
We reviewed the medical records of new patients who visited our nephrology clinic between 1 November 2011 and 30 April 2012 complaining of foamy urine. We defined a new patient as one who was visiting our hospital or clinic for the first time or one who had been lost to follow-up for more than 2 years. Demographic data and medical history of diabetes mellitus (DM), hypertension, ischemic heart disease, and hyperlipidemia were collected. In addition, a drug history was obtained of nonsteroidal anti-inflammatory drugs (NSAIDs) taken for more than 2 weeks before the visit to our clinic. We also obtained the following laboratory test data: a) spot urinary protein-to-creatinine ratio (PCR) determined by protein assay with the 200 FR Neo, SICDIA M-TP Kit (Toshiba) and creatinine assay with the Modular P/Modular D, Jaffe kinetic colorimetric assay (Roche); b) spot urinary microalbumin to creatinine ratio (ACR) determined by albumin assay on the Nephelometer BN-II by using N antiserum to human albumin (Siemens) and the creatinine assay described as above. In addition, we obtained data for blood urea nitrogen (BUN), serum creatinine (Cr), and serum uric acid, calcium, and phosphate. An estimated glomerular filtration rate (eGFR) was calculated by using the CKD-EPI formula (http://www.hdcn.com/calc.htm).2
Overt proteinuria (spot urine PCR >200 mg/g) and microalbuminuria (spot urine ACR of 17-250 mg/g in males and 25-355 mg/g in females) were diagnosed according to KDOQI Clinical Practice Guidelines.3 Pearson's chisquared test or Fisher's exact test were used for categorical variables. Simple logistic regression analysis was used for continuous variables. Multiple logistic regression analysis was performed by using all variables that showed statistical significance in the single-variable analysis. We modified the model by using the Wald test, log-likelihood comparison test, and Akaike's information criteria (AIC). The statistical packages used were version 2.15.0 from the R Development Core Team (2012; Foundation for Statistical Computing, Vienna, Austria, ISBN 3-900051-07-0; http://www.R-project.org). Except for age, data are expressed as means±SDs or SEs. Statistical significance was defined as p≤0.05 or is expressed by 95% confidence interval (CI). This study was approved by the Institutional Review Board.
RESULTS
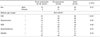
We reviewed the medical records of 1248 patients and identified 72 (6.3%) patients complaining of foamy urine. There were 59 males, and their median age was 65.5 years (range, 36-87 years). Twenty-six patients (36.1%) had DM, 52 (72.2%) had hypertension, 16 (22.2%) had ischemic heart disease, and 21 (29.2%) had hyperlipidemia. Eleven patients (15.3%) had taken an NSAID for more than 2 weeks (Table 1).
Laboratory findings were as follows: mean serum Cr, 1.00±0.32 mg/dl; eGFR, 78.4±22.6 ml/min; serum BUN, 16.4±5.0 mg/dl; serum uric acid, 5.5±1.5 mg/dl; total serum calcium, 9.2±0.4 mg/dl; serum phosphate, 3.2±0.5 mg/dl; and serum glucose, 122.0±52.1 mg/dl. Nine patients (12.5%) had an eGFR of less than 60 mL/min. Sixteen patients (22.2%) had overt proteinuria. In the single-variable analysis, DM (and high serum glucose), poor renal function (high Cr, BUN, low eGFR), increased serum phosphate, and increased serum uric acid were associated with overt proteinuria (Tables 1 and 2).
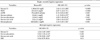
Multiple logistic regression was performed by using all significant variables. DM/serum glucose and eGFR/serum Cr showed multicollinearity. We chose DM and serum Cr because they showed a lower AIC value. Serum phosphate and uric acid could be added to the regression model because they were significant in a Wald test and a log-likelihood comparison. Consequently, we established a regression model that consisted of DM, serum creatinine, uric acid, and phosphate. Increased serum Cr and increased serum phosphate showed a significant association with overt proteinuria. For every 0.1-mg/dl increment of serum Cr, the odds ratio (OR) for overt proteinuria was 1.34 (95% CI: 1.05-1.80, p=0.028), and for every 1-mg/dl increment of serum phosphate, the OR was 5.83 (95% CI: 1.22-41.0, p=0.047) (Table 2).
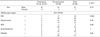
We performed a subanalysis in 38 patients (31 males) for whom ACR results were available. Their median age was 65 years (range, 36-82 years). Thirteen patients (34.2%) had DM, 23 (60.5%) had hypertension, 7 (18.4%) had ischemic heart disease, and 9 (23.7%) had hyperlipidemia. Seven patients (18.4%) had taken NSAIDs for more than 2 weeks. Laboratory findings were as follows: serum Cr, 0.99±0.34 mg/dl; eGFR, 80.0±25.3 ml/min; serum phosphate, 3.2±0.5 mg/dl; and serum glucose, 128.4±63.3 mg/dl. Five patients (13.2%) showed an eGFR of less than 60 ml/min (Table 3).
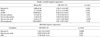
In this subgroup of 38 patients, 12 (31.6%) showed microalbuminuria or overt proteinuria or both. DM, serum uric acid, and poor renal function were associated with proteinuria in the single-variable analysis (Table 3, 4). Only serum Cr showed a statistically significant association with proteinuria in the multiple logistic regression analysis (the OR was 1.42 for every 0.1-mg/dl increment, 95% CI: 1.01-2.34, p=0.0889) (Table 4).
In patients without DM or hypertension, 11.8% (2/17) showed overt proteinuria and 23.1% (3/13) showed microalbuminuria or overt proteinuria or both.
DISCUSSION
A textbook of nephrology describes "foamy urine" as a phenomenon that can be observed in patients with nephrotic syndrome.1 In the public mass media, experts in renal disease recommend that patients with foamy urine undergo a medical examination for renal function.
In our data, a considerable number of patients with foamy urine also had clinically significant proteinuria. Twenty-two percent of patients complaining of foamy urine had overt proteinuria and 31.6% had microalbuminuria or overt proteinuria or both. Although an English-language search of PubMed recovered no articles describing the clinical features of patients with foamy urine, we found one Korean-language article that compared clinical features between patient groups with and without foamy uirne.4 In that study, there was no dipstick-positive proteinuria among 45 patients complaining of foamy urine. However, the authors did not perform any quantitative test for proteinuria, such as that done in the present study, so that it is difficult to conclude that those authors successfully determined the relationship between foamy urine and clinically significant proteinuria. In addition, the 45 subjects examined were healthy individuals who underwent the medical examination for a health promotion. Second, foamy urine was identified through a questionnaire and was not the result of a complaint. Clearly, patients complaining of foamy urine at a visit to their medical professional are more likely to have comorbidities.
In this regard, our patients who complained of foamy urine visited the clinic voluntarily, and a considerable proportion had other medical problems. Furthermore, when we expanded the definition of proteinuria to include microalbuminuria, the proportion of patients with foamy urine who also had clinically significant proteinuria increased. This finding supports the concept that microalbuminuria can also be associated with foamy urine. We therefore suggest that all patients who complain of foamy urine should undergo a quantitative test for urinary protein.
As expected, an increased serum Cr showed a statistically significant association with overt proteinuria. Serum phosphate was also positively correlated with overt proteinuria, but this might be explained by the fact that phosphate levels are commonly increased in patients with poor renal function. In our data, serum phosphate and creatinine showed a very weak correlation (r = 0.0457, p = 0.72). Recently, it was reported that hyperphosphatemia is associated with overt proteinuria in nondiabetic patients with stage 3 to 5 chronic kidney disease.5 The relationship between serum phosphate, foamy urine, and overt proteinuria is uncertain at present, and therefore data from more patients will be required to examine this fully.
The main limitation of our study is that we restricted our patient group to those with subjective foamy urine and we did not incorporate any objective definition of this condition. Presently, foamy urine is detected only by the patient; thus, it is very difficult to interpret data on foamy urine objectively. For example, parameters such as how long the foam persists and how thick the foam appears will require analysis. Although there are difficulties in objectively defining foamy urine, the fact that a significant number of patients with foamy urine also showed clinical proteinuria suggests that such a definition should be established.
The second limitation of our study was the absence of a prospective design. As a result, there are some concerns about the integrity of our data, which were collected by a retrospective medical record review. In addition, for this study, the retrospective data collection reduced the statistical power of our risk analysis. To minimize these limitations, we reviewed the medical records of new patients only. Clearly, the low statistical power of such a study can be overcome by increasing the number of individual medical records included.
In summary, among the patients who complained of foamy urine, a considerable number also showed overt proteinuria. In addition, increases in serum creatinine and serum phosphate showed a statistically significant association with overt proteinuria. We suggest that a quantitative test for proteinuria should be performed on all patients complaining of foamy urine.
 XML Download