

 PDF
PDF ePub
ePub Citation
 Print
Print


INTRODUCTION
Vitamin D (VitD) is a fundamental micronutrient with major implications for human health. About one billion persons worldwide have been reported to have VitD deficiency or insufficiency.1 The prevalence of VitD deficiency in the general population is considerable and varies by ethnic background, sunlight exposure, and the presence of risk factors such as age, obesity, type 2 diabetes mellitus (T2DM), and other comorbidities.2,3 At the community level, 40-100% of the elderly population in Western countries is VitD insufficient or deficient, with more in Asia and Africa.1,2,4,5
In addition to its well-known role in calcium/phosphorus homeostasis and bone physiology,6 VitD is central to the optimal functioning of other organ systems, including the cardiovascular, endocrine, and immune systems.1,7 Some epidemiologic data have revealed that VitD can play a role in decreasing the risk of many chronic illnesses, including common cancers (e.g., breast, colon, prostate), autoimmune diseases, infectious diseases, hypertension, and cardiovascular diseases (CVDs).1,7,8 Many reports have shown associations between VitD status and cardiometabolic diseases, for example, metabolic syndrome, obesity, diabetes, and hypertension.4,9 However, serum calcium and parathyroid hormone also affect CVD risk factors.4 In a combined analysis of data for adult participants in three cycles of the National Health and Nutrition Examination Survey (2001-2002, 2003-2004, 2005-2006), after full adjustments (including for serum parathyroid hormone and calcium), fasting glucose, insulin, and high-density lipoprotein cholesterol (HDL-C) among other various CVD risk factors were shown to be related to serum 25-hydroxyvitamin D [25(OH)D].4 Actually, VitD may improve glucose-stimulated insulin secretion in pancreatic β-cells,10 enhance glucose and lipid metabolism in skeletal muscle,11,12 and ameliorate systemic inflammation.9,13 Most, but not all, patients with T2DM or glucose intolerance have been reported to have lower serum 25(OH)D levels compared with healthy control subjects without diabetes.9 However, VitD supplementation was not shown to affect sugar control in patients with T2DM.9
Although low levels of VitD have been associated with increases in all-cause and cardiovascular mortality as well as the risk of CVD in the general population,12 there still remains ample scope for further study of the relationship between VitD status and various clinical variables in patients with T2DM. Most studies regarding VitD and diabetes have focused on the incidence of diabetes. Few studies have evaluated the relationships between VitD status and various pathophysiologic and metabolic parameters in patients with diabetes.14 A report showed that the increased risk of mortality in patients with T2DM and lower serum 25(OH)D levels persisted even after adjustment for the urine albumin to creatinine ratio (UACR), estimated glomerular filtration rate (eGFR), hemoglobin A1C (HbA1C), diabetes duration, and conventional cardiovascular risk factors.15 This suggests that VitD status has some impact on the pathophysiology and progression of T2DM and its complications. Accordingly, we aimed herein to evaluate the relationship between serum 25(OH)D and various metabolic and clinical parameters in patients with T2DM.
MATERIALS AND METHODS
1. Subjects
In this retrospective study, we analyzed data from 276 patients with T2DM whose serum 25(OH)D level was measured in Jeju National University Hospital. The hospital is a representative secondary medical center in Jeju, the largest southern island in Korea with a population of 0.55 million. Nondiabetic healthy subjects who visited the hospital for health screening examination were selected as the control group (Non-DM, n=160). The exclusion criteria were as follows: patients with systemic infection, inflammatory diseases, trauma, type 1 diabetes, advanced liver disease, or other acute systemic illness; pregnant subjects; patients who received VitD supplementation; patients with parathyroid or calcium-related diseases on biochemical measurements and clinical assessment; patients with chronic kidney disease (CKD) stage 4 or 5; and patients with end-stage renal disease.
2. Methods
Hypertension was defined as anti-hypertensive drug use, systolic BP≥140 mmHg, or diastolic blood pressure≥90 mmHg. We calculated the eGFR by using the MDRD study equation. End-stage renal disease was defined as the use of renal replacement therapy with eGFR<30 ml/min/1.73 m2. T2DM was defined as either 1) diabetes treated by diet alone or by diet combined with oral hypoglycemic agents or 2) for diabetes treated with insulin, onset of diabetes at age 40 years or more and serum C-peptide value≥0.6 ng/ml. Chronic liver disease was defined as chronic viral hepatitis or alcoholic liver disease. We defined alcohol drinking as two or more drinks in a week.
Hypovitaminosis D is typically diagnosed by measuring the concentration in blood of the compound 25(OH)D. We defined VitD deficiency as a serum 25(OH)D level of less than 20 ng/ml and VitD insufficiency as a level of 20-29 ng/ml.1
Blood and urine tests were performed after at least 9 hours of fasting, and serum 25(OH)D was measured in a central laboratory (Eone reference Laboratory, Seoul, Korea) by using a 2-site chemiluminescence assay (DiaSorin LIAISON® 25-OH Vitamin D, DiaSorin, Inc., Stillwater, MN, USA). For urine microalbumin levels, we used calibrated urine albumin adjusted for urinary creatinine (UACR; mg/g creatinine). HbA1C was measured by using ion exchange HPLC (Tosoh Co., Tokyo, Japan). Lipids [total cholesterol (TC), triglyceride (TG), HDL-C, and low-density lipoprotein-cholesterol (LDL-C)] were measured by direct methods on an automated biochemical analyzer (TBA-200FR NEO, Toshiba Medical Systems; Tokyo, Japan) with use of Determiner-L TC-II, TG-II, HDL-C, and LDL-C (Kyowa Medex Co., LTD; Tokyo, Japan). The study protocol was reviewed and approved by the institutional review board (IRB No. #2011-101).
3. Statistical analysis
All data are presented as means±standard errors of the mean. The statistical analysis was performed with SPSS version 18.0 (SPSS Inc., Chicago, IL, USA). Differences in serum 25(OH)D between Non-DM and T2DM subjects were evaluated by using a Student's t-test for continuous measures and chi-square test for categorical measures. Spearman correlation coefficients were determined for bivariate associations of 25(OH)D and other covariates. Additionally, T2DM patients were classified into smaller groups on the basis of glycemic control, CKD stage, UACR, LDL-C, TG, and high-sensitivity C-reactive protein (hsCRP). The respective subgroups were compared by using one-way ANOVA or independent-sample t-tests. Posthoc tests in the one-way ANOVA test used Scheffé's method. Linear regression analysis was done to approach modeling the relationship between the serum 25(OH)D level and correlated variables. Multivariate logistic regression analysis was done to identify independent factors affecting the risk of VitD deficiency in patients with T2DM. We expressed the results of this analysis as odds ratios (ORs) and 95% confidence intervals (CI) for VitD deficiency. p<0.05 was accepted as statistically significant.
RESULTS
1. Clinical characteristics of the study subjects
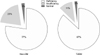
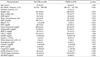
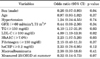
The clinical characteristics of the study subjects are shown in Table 1. The mean age of the control group was 57.6 years and 66% were women. The mean age of the T2DM group was 58.8 years and 53% were women. The HbA1C of the T2DM group was significantly higher than that of the control group (9.3±0.1% vs. 5.5±0.03%, p<0.01). Compared with control subjects (n=160), patients with T2DM had a lower serum 25(OH)D level (15.4±0.5 ng/ml vs. 12.9±0.4 ng/ml, p<0.01). Mean serum 25(OH)D levels of the T2DM group in different seasons were 12.4 ng/ml in the spring, 14.8 ng/ml in the summer, 12.8 ng/ml in the fall, and 12.1 ng/ml in the winter. In the control group, they were 11.6 ng/ml, 18.7 ng/ml, 16.2 ng/ml, and 12.5 ng/ml, respectively. Depending on the seasonal variation, serum mean 25(OH)D levels of both groups were quite low. Thus, we did not perform further analysis of 25(OH)D in nonsummer and summer seasons. Eleven percent of T2DM patients were VitD insufficient (20-29 ng/ml) and 87% of the patients were VitD deficient (<20 ng/ml). Among healthy subjects, 20% of the subjects were VitD insufficient and 77% of the subjects were VitD deficient (Fig. 1). The prevalences of both VitD deficiency and insufficiency were significantly higher in patients with T2DM than in the control subjects (p=0.01 and p=0.03, respectively).
2. Factors associated with serum 25(OH)D levels in patients with T2DM
We evaluated correlations between serum 25(OH)D and other factors in patients with T2DM. Height, serum fibrinogen, ferritin, sodium levels, and blood hemoglobin showed a positive correlation with serum 25(OH)D, whereas HbA1C, TG, and LDL-C showed a negative correlation. The duration of diabetes also tended to have a negative correlation (data not shown).
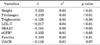
In a multivariate linear regression analysis that included age, sex, height, serum fibrinogen, serum TG and LDL-C, HbA1C, eGFR, and ferritin as input variables and 25(OH)D as a dependent variable, height (β=0.222, p<0.01), fibrinogen (β=0.219, p<0.01), TG (β=-0.138, p<0.05), LDL-C (β=-0.217, p<0.01), HbA1C (β=-0.155, p<0.05), and ferritin (β=0.183, p<0.01) remained significant (Table 2).
3. Serum 25(OH)D level according to various clinical characteristics in patients with T2DM
1) Glycemic control and VitD status
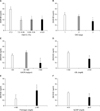
Patients with T2DM were classified into quartiles of HbA1C as follows: less than 7.3%, 7.3% to 9.25%, 9.25% to 10.8%, and greater than 10.9%, respectively. When serum 25(OH)D levels were compared, the lowest quartile of HbA1C had a significantly higher 25(OH)D level than did the upper three quartiles (14.9 ng/ml vs. 11.8, 11.6, and 11.7 ng/ml, respectively, p<0.01). However, there was no statistical difference in serum 25(OH)D level among the upper three quartiles of HbA1C (p=0.90, Fig. 2A).
2) Renal function and VitD status
Among the patients with T2DM with an eGFR≥30 ml/min per 1·73 m2, mean eGFR was 71.9±1.2 ml/min per 1·73 m2: 55 (19.9%) had Kidney Disease Outcomes Quality Initiative CKD stage 1 disease (eGFR≥90 ml/min per 1·73 m2), 142 (51.4%) had stage 2 disease (eGFR 60-89 ml/min per 1·73 m2), and 79 (28.6%) had stage 3 disease (eGFR 30-59 ml/min per 1·73 m2). (Only patients with CKD stages 1-3 were included in the analysis.) The serum mean 25(OH)D levels for patients with CKD stages 1, 2, and 3 were 13.8±1.0, 13.3±0.5, and 11.4±0.7 ng/ml, respectively. There was a significant difference in mean serum 25(OH)D level between patients with CKD stages 1 and 3 (p<0.05) (Fig. 2B). Although the patients with CKD stages 4 and 5 were excluded in the present study, serum mean 25(OH)D levels in those patients with T2DM were 10.2 and 6.7 ng/ml, respectively (data not shown). The diabetic patients with VitD deficiency had a significantly lower median eGFR level than did the groups with VitD insufficiency (71.54 and 77.28 ml/min/1.73 m2 respectively, p<0.05).
The diabetic patients were classified into three groups according to albuminuria (UACR): less than 30 mg/g creatinine (normal, n=109), 30-300 mg/g creatinine (microalbuminuria, n=93), and greater than 300 mg/g creatinine (macroalbuminuria, n=25). The mean serum 25(OH)D levels in these three groups were 12.7±0.6, 13.7±0.6, and 9.9±1.2 ng/ml, respectively. There was a significant difference in mean serum 25(OH)D level between patients with normal UACR or microalbuminuria and patients with macroalbuminuria (p<0.05; Fig. 2C).
3) Lipid profiles and VitD status
The serum 25(OH)D level in patients with LDL-C of 100 mg/dl or more (n=117) was lower than in patients with LDL-C of less than 100 mg/dl (n=125) (11.3±0.5 vs. 13.7±0.6 ng/ml, p<0.01; Fig. 2D). The difference was maintained when patients without statin treatment were analyzed separately (LDL-C ≥100 mg/dl: 11.4±0.5 vs. LDL-C<100 mg/dl: 14.0±0.8 ng/ml, p<0.01, data not shown). However, there was no significant difference in serum 25(OH)D levels between the diabetic group with a serum TG level of 150 mg/dl or more and the group with a TG level of less than 150 mg/dl (12.0±0.6 vs. 13.2±0.5 ng/ml, p=0.11; data not shown). Patient subgroups by various stratifications of serum HDL-C concentration had comparable 25(OH)D levels. Also, statin treatment did not seem to affect the 25(OH)D level (data not shown).
4) Inflammatory markers and the serum 25(OH)D level
In T2DM patients, the mean fibrinogen concentration (±standard deviation, SD) was 253.5±124.6 mg/dl. As shown in Table 2, the serum fibrinogen level had a positive correlation with the serum 25(OH)D level. Patients with a fibrinogen level of 150 mg/dl or more (n=132) had a higher 25(OH)D level than did the group with fibrinogen levels less than 150 mg/dl (n=23) (13.6±0.5 vs. 10.6±1.6 ng/ml, p<0.05; Fig. 1E). By contrast, the serum 25(OH)D level in patients with hsCRP of 0.5 mg/dl or more (n=47) was lower than in patients with hsCRP of less than 0.5 mg/dl (n=213) (11.0±0.6 vs. 12.7±0.4 ng/ml, p<0.05; Fig. 1F).
4. Factors associated with VitD deficiency state in patients with T2DM
To determine the factors associated with serum VitD levels, a linear regression analysis was performed by using data from patients with T2DM. Serum VitD levels showed a statistically significant association with HbA1C, fibrinogen, TG, and LDL-C levels in T2DM patients (Table 2). In addition, we performed logistic regression analysis to find the independent factors associated with the risk of VitD deficiency in T2DM patients. High levels of TG, LDL-C, and HbA1C were independent factors related to the risk of VitD deficiency (Table 3).
DISCUSSION
There have been many reports that VitD status is associated with insulin sensitivity, glucose tolerance, and β-cell function.16,17 Also, a low serum 25(OH)D level is related to increased mortality in patients with T2DM. However, less is known about the clinical implications of VitD status in the management of T2DM. Further studies are needed to clarify how VitD is involved in the pathophysiology, progression, and complications of T2DM. Although some epidemiologic studies have shown an inverse relationship between HbA1C and serum 25(OH)D,18,19 the relation between VitD status and metabolic parameters in various patient backgrounds, including medical treatment, stage of T2DM, and its complications, has not been well studied.
In the present study, we analyzed retrospectively collected data of T2DM patients with a mean duration of diabetes of 12.7 years. Mean 25(OH)D serum levels were quite low in both control and T2DM subjects (15.4±0.5 and 12.9±0.4 ng/ml, respectively). Also, the mean serum 25(OH)D value of the control nondiabetic subjects in the present study was lower than values from the nationwide 1958 British birth cohort of over 6,500 middle-aged participants (21.14 ng/ml),20 from the Third National Health and Nutrition Examination Survey in the United States (mean value of around 27.8 ng/ml in similar age groups),21 from one New Zealand study of 250 overweight and obese adults aged≥18 years (24.91 ng/ml),22 and from the Korea National Health and Nutrition Examination Survey (KNHANES) 2008 (22.9 ng/ml for men and 19.9 ng/ml for women in similar age groups).23 Why our control subjects had a much lower 25(OH)D level than the values from other reports is not clear at present. Our data were collected from hospital records. In the KNHANES 2008 nationwide survey in Korea, VitD insufficiency was found in 47.3% of males and 64.5% of females among the general population.23 Thus, much caution should be used when interpreting hospital data and population data.
Regarding patients with T2DM, most patients in the present study had serum 25(OH)D less than 30 ng/ml; up to 98% of the patients had VitD insufficiency or deficiency. Mean serum 25(OH)D level and VitD status in the present study were in line with another report on Korean patients with T2DM.3 In that report, Lee et al.3 showed that the mean concentration (±SD) of 25(OH)D in patients with T2DM was 11.2 (±6.1) ng/ml with a prevalence of VitD deficiency of 85.9%. In contrast, a Japanese study showed that the mean serum 25(OH)D concentration (±SD) in patients with T2DM was 17.0 (±7.1) ng/ml in the winter and was not statistically different from that in a normal population (17.5±3.6 ng/ml) with a VitD deficiency prevalence of 70.6%.24 Two reports on the serum 25(OH)D levels of patients with T2DM in the United States revealed higher mean values, 22.9 ng/ml and 22.3 ng/ml each.25,26 These results suggest that the 25(OH)D level in patients with T2DM varies widely according to ethnic or other backgrounds.
In the present study, patients with poor glycemic control, high LDL-C, or high TG had a lower serum 25(OH)D level. Although LDL-C had a consistent inverse association with serum 25(OH)D, statin treatment itself did not affect serum 25(OH)D. These results are not in line with the results from Lee et al.3 They did not find any association between the serum 25(OH)D level and HbA1C or lipid levels in Korean T2DM patients. In a Japanese study on patients with a duration of T2DM similar to that of our study subjects, HbA1C, proliferative diabetic retinopathy, treatment type (insulin treatment), and the number of microvascular complications were associated with a decrease in the serum 25(OH)D level.24 In the present study, we excluded the patients with eGFR<30 ml/min/1.73 m2. Patients with CKD stage 3 or macroalbuminuria had a lower serum 25(OH)D level as expected.
One of the interesting findings in the present study was that the serum fibrinogen level had a positive association with serum 25(OH)D in patients with T2DM. T2DM patients with a fibrinogen level of 150 mg/dl or more had a higher 25(OH)D level than did the group with a fibrinogen level less than 150 mg/dl. To our knowledge, there is only one other report about the relation between VitD status and serum fibrinogen.20 In that cross-sectional analysis of the 1958 British Birth Cohort, after full adjustment for adiposity, lifestyle, and social indicators, serum fibrinogen showed a curved association with a suggestion for increased levels at high 25(OH)D concentrations (≥50 ng/ml).20 These data suggest that there may be a threshold effect of VitD on hemostasis or fibrinolytic processes. Or, serum fibrinogen may have a different relationship with VitD from other hemostatic or inflammatory factors. Although two other important factors, tissue plasminogen activator and D-dimer, showed a negative association with serum 25(OH)D, D-dimer was also shown to have a curved association between 25(OH)D, which supports a threshold effect.20 In the present study, however, the mean serum 25(OH)D level in the high fibrinogen group was only 13.6 ng/ml. Thus, the threshold level may not be easily determined. Defects in antithrombotic homeostasis have been reported in VitD receptor knockout mice.27 Considering that most patients in the present study were VitD insufficient or deficient, further studies are needed using larger cohort data that have a wide range of serum 25(OH)D levels. Also, we did not measure serum fibrinogen in the non-DM control subjects.
The current analysis had some limitations. First, our study was restricted to a large island in Korea, and hence the study subjects and patients with T2DM may not represent the whole nation or Asia. Second, the present study was a cross-sectional and retrospective analysis of hospital data. Third, the control group was composed of nondiabetic adults, and subjects with diabetes were excluded from the control group; however, adults with impaired glucose tolerance might have been included in the control group. Fifth, data on sun exposure were not checked carefully and were not analyzed.
In conclusion, our retrospective analysis showed that patients with T2DM have a very low serum 25(OH)D level and almost all of the patients had VitD insufficiency or deficiency. Among the various metabolic parameters, high levels of TG, LDL-C, and HbA1C had a consistent association with VitD deficiency state in T2DM patients. Further studies are required to clarify the relationship of VitD with fibrinogen and other hemostatic or fibrinolytic parameters in patients with T2DM.
 XML Download