

 PDF
PDF ePub
ePub Citation
 Print
Print


INTRODUCTION
Transient and permanent occlusion of the middle cerebral artery (MCA) or thermocoagulation of vessels in the pia mater has been widely used to induce experimental focal ischemic brain lesions. With those models, however, a reliable distinction between the ischemic lesions, the border zone, and remote areas of the cortex not directly affected by ischemia is hard to draw because of the variable sizes and shapes of the lesions made.1 On the other hand, the photothrombosis model by rose bengal and cold light, a relatively noninvasive model for stroke, has an advantage in that the induced infarcts are highly reproducible in size and location.2 Acute small stroke induced by the photothrombotic method in rats is homologous to human ischemic cerebral infarcts in histopathology and MRI findings.3
To assess the evolutionary aspects of cerebral ischemic lesions in an experimental stroke model, magnetic resonance imaging (MRI) is currently recommended as a tool.4 T2- and/or diffusion-weighted MRI is in fact highly useful for quantitatively predicting histological damage.5
Intracerebral neural grafting and cell replacement therapy, which have been used to ameliorate the symptoms of movement disorders such as Parkinson or Huntington disease,6 are now proposed as a therapeutic intervention for stroke.7-9 Neural stem cells (NSCs) present in the adult subventricular zone (SVZ) divide themselves slowly and generate a rapidly amplifying progenitor population.10 It is known that these newly generated neural progenitors migrate from the SVZ to the ischemic striatum after stroke,11 and the process can be confirmed by immunohistochemistry for the phenotypic markers of BrdU.12
In this study, we investigated sequential MRI changes correlated with the histological findings of cerebral cortical lesions and the dynamics of endogenous NSCs in an experimental photothrombotic stroke model.
MATERIALS AND METHODS
1. Lesion induction
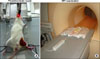
Male Sprague-Dawley rats (180-330 g) were anesthetized with an intramuscular injection of ketamine (50 mg/kg) and xylazine (5 mg/kg). Body temperature, which was measured by a rectal probe, was maintained constantly at 37.0±0.5℃ by using a heating pad.13 Cortical photothrombosis was induced by focusing light to the cortex in rats treated with rose bengal. The skull bone of the rat was fixed on a stereotactic frame, and a cold white light (Olympus, Japan) with a 6 mm aperture was positioned on the skull 1 mm anterior to the bregma and 3 mm lateral to the midline over the right frontal cortex.14 The photochemical dye rose bengal (20 mg/kg, Sigma, Steinheim, Germany) was infused into the saphenous vein via a microinjection pump, and within 2 minutes the light was applied to the skull for 2 minutes (Fig. 1A).
2. MRI
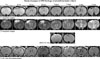
MRI was performed on a 1.5 T Biospec instrument (Intera@, Philips Medical System, Netherlands). Anesthetized rats were fixed in a stereotactic instrument mounted in a coil and positioned inside the magnet. The surface coil (Philips Medical System) with an inner diameter of 47 mm was used. T1- and T2-weighted images were obtained at various intervals from 1 hour to 8 weeks after making the lesion (Fig. 1B). Coronal T1-weighted images were obtained. The imaging parameters were TR/TE 500/15 ms, data matrix 224×224, and Fov 50×50 mm. Coronal T2-weighted images were obtained with TR/TE 4108/176 ms, data matrix 128×128, Fov 70×70 mm, and thickness 1 mm. Enhanced images were obtained by means of Gadolinium-DTPA (Magnevist, Scherring, 0.1 mM/kg) injection. To confirm macrophage infiltration to the lesion between 3 and 7 days after stroke, 200 µM-iron/kg superparamagnetic iron oxide (SPIO) was injected, and T2-weighted images (TR/TE 300/13.8 ms, matrix size 224×224, Fov 50×50 mm) were obtained 24 hours after stroke. For further analysis, image data were transferred from the MR console to computers operating JPG image processing software (NIH, Version 1.62, Bethesda, MD, USA).
3. Immunohistochemistry
For immunohistochemistry, all paraffin-embedded sections were cut in 6 µm thicknesses and deparaffinized with xylene and rehydrated in decreasing concentrations of ethanol to water. To re-establish an original conformation of epitopes modified after fixation, the sections were exposed to microwaves in sodium citrate solution. As primary antibodies, monoclonal rat-Nestin IgG (1:100, Chemicon, Temecula, CA), a marker for neural stem and progenitor cells, and monoclonal mouse-Neurofilament protein IgG (NF-L, 1:100, Chemicon, Temecula, CA), a marker for neurons, were used. The tissues incubated with primary antibody were treated with biotinylated secondary antibodies and avidin-biotin complex (ABC, Vector, Burlingame, CA) and were visualized with 3-3' diaminobenzidine tetrahydrochloride (DAB, Chemicon, Temecula, CA) chromogen. The sections were counter-stained with hematoxylin and examined with a light microscope. As controls, sections processed with omission of the primary antibody were used.
4. Quantification of endogenous NSC dynamics
Nestin-immunopositive cells were determined in the coronal forebrain sections. The number of NSCs in the SVZ was counted under a microscope. All images were taken at high power (magnification 200×). By use of analysis software, the immunopositive cells in the ischemic boundary region in the cortex, SVZ, and corpus callosum (CC) were counted. For the control, nestin+ cells in the SVZ, CC, and similar cerebral cortex of the nonlesional brain were counted. The intracerebral areas indicated the migration tract of the NSCs.
RESULTS
1. MRI
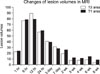
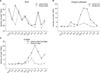
On the T1-weighted images, the signal intensity of the ischemic lesions gradually decreased from 6 to 24 hours. The border zone was blurred in the time intervals. No significant signal changes were noted at 3 to 7 days after stroke. Wedge-shaped decreased signal intensity in the infarct zone was observed at 2 to 4 weeks. On the T2-weighted images, ischemic lesions appeared as high signal intensity areas in the cortex within 24 hours. The high signal intensity was progressively increased up to 12 hours and then slightly reduced. In 3 to 7 days, the signal intensities of the ischemic lesions were gradually decreased nearly to the level of normal cortex. However, the signal intensities of the deeper margin remained high. In gadolinium-enhanced T1-weighted images, no definitely enhanced lesion was shown at 1 hour to 3 days after stroke. However, there were strong enhancements along the margin of the infarct lesions at 7 days to 4 weeks (Fig. 2). MRI was not enough to explain the cellular changes or massive infiltration of macrophages around the coagulative necrotic lesion. The volume of the lesion was maximal at 12 hours and then decreased gradually to 3 weeks (Fig. 3). The area of macrophage infiltration was well demonstrated by the SPIO uptake image, showing linear dark signal intensity at 3 to 7 days.
2. Histopathology
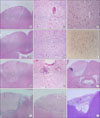
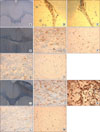
The alterations associated with acute hypoxia-ischemia first became apparent at 30 minutes after ischemia. Half an hour after stroke, a wedge-shaped edematous lesion was seen, showing pallor and vacuolation of neuropils at low magnification. Thrombotic occlusion of superficial capillaries was also frequently noted. The high-magnification view revealed shrinkage of the neuronal cell membrane, cytoplasmic condensation with increased basophilia, and nuclear pyknosis, so-called dark neurons (Fig. 4A-C). After an hour, the boundary of the wedge-shaped lesion developed more pallor. Dark pyknotic neurons were increased in number. Between 6 and 12 hours, eosinophilic neurons appeared, which showed swelling of cytoplasm. Eosinophilic neurons appeared at 6 hours and increased in number between 8 and 12 hours (Fig. 4D, E). The swollen cytoplasm of eosinophilic neurons was positive for NF immunostaining (Fig. 4F). Complete wedge-shaped coagulation necrosis was formed at 24 hours after ischemia. After 1 day, neutrophil infiltration was shown at the edges of the infarct and continued to 2 days (Fig. 4G, H). Between 3 and 7 days, the infarct lesion was gradually reduced and characterized by central necrosis surrounded by macrophages and newly formed capillaries (Fig. 4I, J). At 2 to 4 weeks, cortical necrosis was completely resolved and the lesion was replaced by gliosis and fibrosis. A pseudocavitary lesion was frequently formed (Fig. 4K, L).
3. Correlation of MRI and histopathology
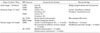
The process of stroke was divided into three stages, and the histopathological findings were compared with the MRI findings in each stage (Table 1). In the acute stage (within 24 hours), histopathology showed a wedge-shaped edematous lesion and red neurons, and corresponding MR images were low signals on T1-weighted images and high signals on T2-weighted images. In the subacute stage (2-7 days), focal coagulation necrosis and the early reparative process consisting of subsidence of necrosis in the center and transitional area appeared with infiltration of neutrophils and macrophages. The extent and contours of macrophage infiltration were well demonstrated with SPIO as a dark signal area (3-7 days). In the chronic stage (2-8 weeks), the size of the lesion was significantly reduced and the histology revealed gliofibrosis. Gadolinium-enhanced T1-weighted images showed marked enhancement in the areas of fibrosis.
4. Migration of stem cells from the SVZ to the site of injury
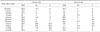
The endogenous stem cells in the SVZ on both sides were detected by immunohistochemical stains for nestin. Some nestin+ cells emigrated from the SVZ to the CC and cortex, which could be judged by the same morphology of emigrating NSCs. Half an hour after stroke, a few nestin+ cells were detected in the SVZ and CC of the lesion side, but no NSCs migrated to the cortex. Stem cells did not migrate to the CC or cerebral cortex of the control side (Fig. 5A). At 12 hours after stroke, nestin+ cells were detected in the lesion-side CC and cortex (Fig. 5D-F). At 12 hours, some nestin+ cells had migrated to the lesion along the CC. Little migration appeared on the control side, however (Fig. 5G, H). The number of nestin+ cells peaked at 2 to 3 days after stroke in both the CC and cortex. A significant number of nestin+ cells migrated to the lesion along the CC and were distributed to the peri-lesion area (Fig. 5I-K), and some nestin+ cells migrated to the contralateral cortex (Fig. 5L, M). Nestin+ cells in the ipsilateral cortex and CC increased at 12 hours to 3 days compared with the contralateral side. In one week, the migration of nestin+ cells to the lesion-side CC and the boundary of the cortex decreased significantly. The emigration of endogenous NSCs from the SVZ to the CC and cortex changed with time (Table 2, Fig. 6). The number of nestin+ cells in the contralateral SVZ was similar to that in the ipsilateral SVZ in each group. Nestin+ cells appeared as chains oriented toward the ischemic boundary lesions, formed clusters, and dispersed in the ipsilateral cortex (Fig. 5K).
DISCUSSION
1. Stroke: acute damage
Stroke is an acute, progressive event. More than one-fourth of neurons become swollen and chromatolytic with vacuoles during the 3 days after a 2-hour occlusion of the MCA.15 Cellular alterations are evident at 4 hours after occlusion, i.e., the cell death is acute, without an initial latent period as in the delayed neuronal death noticed in the hippocampus.16 In this experiment, the infarct lesion even appeared within 30 minutes after induction of ischemia. The ischemic lesion of the photothrombotic model developed rapidly with time during the early stage.
MR imaging has become a powerful tool for accurate and fast assessment of early ischemic damage in animal models and clinical investigations of stroke.17 In this study, the volume of the lesion was maximal at 12 hours in T2-weighted images and then decreased rapidly. A small, cortical hyperintense area was noticeable within 15 to 20 minutes after photochemical induction of stroke and expanded within the next 4 hours on both diffusion- and T2-weighted images. The DWI hyperintensity was maximal at 3 to 10 hours after photothrombosis.18
2. Early ischemic infarction in the rat brain with MRI and histological correlation
T2-weighted images are very helpful to see the evolution of the infarct lesion over 24 hours due to the progressive increase in signal intensities. In histology, within 24 hours, the lesions appeared as wedge-shaped, pale edematous lesions in the gray matter that became paler as time progressed. Complete necrosis presented at 24 hours. Histology corresponded with MRI in an early stroke model, and the increased signals of the T2-weighted images corresponded with cellular changes of edema and infarction within 24 hours in this study. One hour after infarction, the lesion became well defined and hyperintense on the T2-weighted images, and these changes were more exaggerated between 6 and 12 hours and then decreased from 24 hours after stroke. Photomicrographs of histologic sections stained with H&E showed the most striking features-swelling of the neuropil and pronounced swelling of the perineural astroglial processes-in which the center of the lesion had no intact cells at 24 hours. Between 3 and 7 days after ischemia, the lesion was reduced in intensity, with an intensity similar to healthy cortex on T2-weighted images, especially with SPIO injection.
Studies performed in patients with acute stroke have also proved that diffusion-weighted MR imaging is useful for the early identification of ischemic regions.19 The advantage of this stroke model is that it is easily reproduced, is noninvasive, and MR images can be obtained with time in the same rat. Dietrich et al found that the water content within the irradiated zone is significantly elevated 15 minutes after exposure to light on T2-weighted images.20 The lesions could be detectable even within half an hour of induction of the ischemia because of the characteristics of the photothrombotic lesion.
Another report showed that the MRIs of the infarcts revealed a discrete zone of abnormal cortical signal, with a mean depth of 2.31 mm, close to the measured mean depth of the necrotic zones in the cortex in the histological sections of 2.5 mm. MRI also showed a bordering transitional zone of T2 hyperintensity of 2.0 mm, which was close to the 1.7 mm mean thickness of the vaculated zone bordering the infarcts histologically. There was not only a qualitative correlation but also a close quantitative correlation of the MR infarct images to the histologic infarct patterns.5 In the present study, the volume of the lesion was maximal at 12 hours and then decreased gradually to 3 weeks, which corresponded quantitatively to the histological changes. Histological patterns were also identical to that finding. Within the infarct zone, cortical neurons were all hypereosinophilic with pyknotic and shrunken nuclei, which was a similar morphology to the transition zones. Abnormal neurons gradually gave way to normal neurons in the vacuolated zones. MRIs of these infarcts in vivo closely corresponded to the histologic appearance of the lesions.
3. Stem cells migrate from the SVZ to the boundary of the ischemic infarct
A number of stem cells significantly increased in the SVZ and migrated to the ischemic boundary, especially between 2 and 3 days after stroke. In adult brain, doublecortin is primarily expressed in migrating and differentiating neurons in the SVZ and rostral migratory stream.21 Observation of a significant increase in doublecortin-positive cells in the ipsilateral striatum suggests that these cells may migrate from the SVZ. Electronic microscopy revealed that the cluster cells in the ipsilateral striatum had spindle-shaped dark nuclei, many free ribosomes in the cytoplasm, open extracellular spaces, and tight junctions. Ultrastructural data demonstrate that cells in the ipsilateral striatum have morphologic characteristics of cells in the SVZ.22 In stem cell transplantation, the injection tract mainly along the CC and the stem cell were attracted by the lesion site. Preferential migration of stem cells toward the site of a lesion is a highly desirable property of stem cells that allows flexibility in the site of graft implantation in the damaged brain.23 Neural stem cells migrated from the SVZ mainly along the CC and migrated to the boundary, especially at the 2 to 3 day time point. Thus, our findings agree that endogenous NSCs migrated from the SVZ to the ischemic boundary.
In conclusion, in this photothrombotic stroke model, MRIs of the lesional cortex correlated well with histopathologic findings, which could be divided into three stages: acute (edema and necrosis) within 24 hours, subacute (acute and chronic inflammatory cell infiltration) at 2 to 7 days, and chronic (gliofibrosis) at 2 to 8 weeks. The volume of the infarct was significantly reduced by reparative gliofibrosis. Active emigration of internal NSCs from the SVZ toward the infarct lesion may also contribute to repairing the infarct lesion, but the self-repair mechanism by endogenous NSCs is insufficient to treat stroke causing extensive neuronal death. Further studies should be focused on amplification technologies of NSCs emigrating from the SVZ to enhance the collection of endogenous or transplanted NSCs for the treatment of stroke.
 XML Download