

 PDF
PDF ePub
ePub Citation
 Print
Print


INTRODUCTION
Recently, the number of live births in Korea has begun to decrease, giving Korea the lowest total fertility rate (TFR) in the world. However, the numbers of premature and low birth weight infants have been increasing because of the increasing numbers of high-risk pregnancies. With the development of improved perinatal medicine, infant survival rates are increasing, and the birth weight and gestational week survival limits have gradually become lower and shorter, respectively. Since the introduction of a pulmonary surfactant for treating respiratory distress syndrome and the development of mechanical ventilation in the 1990s, the survival rate for extremely low birth weight infants (ELBWIs) weighing less than 1,000 g has increased from 32.7% in the 1990s1 to 60% to 80% in the 2000s.2-4 Despite this improvement in the survival rate, however, preventing the deaths of high-risk infants in the neonatal intensive care unit (NICU) remains difficult.
The objective of this study was to establish a strategy for reducing the neonatal mortality rate by analyzing data gathered in a tertiary hospital for 10 years regarding characteristics and mortality rates of high-risk infants, such as premature and low birth weight infants.
MATERIALS AND METHODS
We retrospectively surveyed the medical records of infants born at Chonnam National University Hospital (CNUH) and of patients admitted to the NICU for the 10 years from October 1999 to December 2008. First, we investigated the annual numbers of live births (inborn), along with their distributions of gestational weeks and birth weights and admission rates to the NICU. We also examined the annual numbers of NICU patients, including outborn babies who were transferred from outside the hospital; the proportion of NICU patients among the total live births in the Gwangju-Chonnam area; and each infant's clinical characteristics, such as delivery site and method, gender, plurality, gestational week, and birth weight. We compared the admission rate of inborns, the proportion of outborns among NICU patients, and the birth rates of premature and low birth weight infants between first 5 years (1999 to 2003) and the latter 5 years (2004 to 2008).
Our definitions of terms were as follows. Premature infant referred to a live birth at less than 37 completed weeks of gestation, term was defined as 37 to 41 6/7 weeks, and post-term was defined as 42 weeks or more. An extremely low birth weight infant (ELBWI) was an infant weighing less than 1,000 g, a very low birth weight infant (VLBWI) was one weighing less than 1,500 g, a low birth weight infant (LBWI) was one weighing less than 2,500 g, a normal birth weight infant was one weighing 2,500 to 3,999 g, and a large baby was one weighing more than 4,000 g at birth. The patients discharged against medical advice and almost certain to die at home were included in the data on deaths. We also compared the mortality rate according to the birthplace, delivery mode, gender, and plurality between the two periods. Finally, we analyzed the annual mortality rates and major causes of death according to gestational week, birth weight, and postnatal days of life.
The SPSS ver. 18.0 (SPSS Inc., Chicago, IL, USA), was used for analysis. Comparison was conducted by chi-square statistics. A p value<0.05 was considered statistically significant.
RESULTS
1. Inborn babies
1) Number of live births and admission rate to NICU
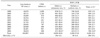
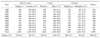
The total number of live births at CNUH from January 1999 to December 2008 was 9,535 (average, 953.5 per year). The number of live births decreased 25% over the 10 years, from 1,206 in 1,999 to 899 in 2008. The number of infants admitted to the NICU was 6,000 for these 10 years (average, 600 per year). Thus, almost two-thirds (62.9%) of inborn infants were at high risk of requiring NICU admission. The admission rate increased significantly over the 10 years, from 51.1% in 1999 to 63.5% in 2008 (p<0.001) (Table 1).
2) Rates of premature and LBWIs
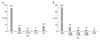
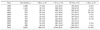
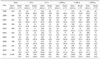
Among inborn infants, 40.3% were premature, 58.9% were term, and 0.8% were post-term. In particular, 6.3% of inborn infants were premature infants of less than 30 weeks of gestation. LBWIs accounted for 39.0% of inborns, VLBWIs made up 10.0%, ELBWIs made up 3.0%, normal birth weight infants were 58.2%, and large babies of over 4,000 g accounted for 2.8%. Thus, premature and low birth weight infants accounted for about 40% of inborns. The rate of premature infants increased significantly from 35.0% in 1999 to 44.0% in 2008 (p<0.001). Rates of ELBWIs and of VLBWIs showed little change, but the rate of LBWIs increased significantly from 33.0% in 1999 to 40.0% in 2008 (p<0.001) (Tables 2, 3). When we compared the rate of premature and LBWI infants between the two periods (1999 to 2003 vs. 2004 to 2008), both were increased significantly (36.9% vs. 44.4%, p<0.001, for premature infants, and 37.3% vs. 41.1%, p<0.001, for LBWIs) (Fig. 1A).
2. NICU patients
1) Proportion of NICU patients among total live births in the Gwangju-Chonnam area
Total live births in the Gwangju-Chonnam area over the 10 years were 353,907 (average, 35,391 per year), with a decrease of 32.9%, from 45,075 in 1999 to 30,253 in 2008. Total NICU patients for 10 years were 8286 (average, 828.6 per year), with a decrease of 2.5%, from 810 in 1999 to 790 in 2008, which was negligible compared with the decreasing rate of live births. The proportion of NICU patients among live births in the Gwangju-Chonnam area increased significantly from 1.8% in 1999 to 2.6% in 2008 (p<0.001) (Table 1).
2) Transfer rate, delivery methods, gender, and plurality
The patients born outside our hospital among NICU patients accounted for more than a quarter (27.6%), and the proportion of outborns among NICU patients increased some, but not significantly so (24.0% vs. 27.7%, p=0.085) (Table 1). The rate of C-section delivery exceeded half (54.0%), although the rate differed somewhat annually. On average, males outnumbered females (56% vs. 44%), and singletons outnumbered multiples (86.2% vs. 13.8%). The rate of multiples increased some, but not significantly so (11.0% vs. 13.3%, p=0.158) (Table 4).
3) Gestational week and birth weight distribution
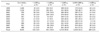
Among NICU infants, 52.4% were premature, 47.3% were term, and 0.3% were post-term; in particular, 8.5% were premature infants of less than 30 weeks of gestation. Although the proportion of premature infants varied annually, it tended to increase, going from 52.5% in 1999 to 55.6% in 2008. The proportion of LBWIs was 48.5%, that of normal weight infants was 48.2%, that of large babies was 3.4%, and that of ELBWIs was 12.9%. Although the annual number of ELBWIs showed no change or an increase, the proportion of LBWIs and VLBWIs decreased slightly during the study period (Table 5).
3. Mortality of NICU patients
1) Mortality rates
The NICU patients' overall mortality rate for the 10 years was 3.5%. Although it varied depending on the year, the rate decreased from 4.7% in 1999 to 2.9% in 2008 (p=0.063). The mortality rate for premature infants decreased from 6.6% to 3.9% (p=0.063) and the rate for LBWIs also decreased from 7.1% to 4.3% (p=0.063) during the study period (Table 5). When we compared the mortality rate between the two periods (1999 to 2003 vs. 2004 to 2008), the rate for premature infants decreased significantly in the latter 5 years compared with the first 5 years (4.0% vs. 5.4%, p=0.035); however, the rate for LBWIs showed no significant difference (4.6% vs. 5.6%, p=0.129) (Fig. 1B).
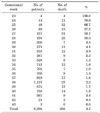
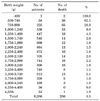
Regarding gestational age, the mortality of premature infants was 4.7%, that of term infants was 2.0%, and that of post-term infants was 8.3%. Specifically, the mortality rate at 23 weeks of gestation was 100%, that at 24 weeks was 78.6%, that at 25 weeks was 66.7%, and that at 26 weeks was 37.5%, but it dropped sharply at 27 weeks and increased again after 42 weeks. Regarding birth weight, the mortality rate of ELBWIs was 36.1%, that of VLBWIs was 14.5%, that of LBWIs was 5.2%, that of normal weight infants was 1.8%, and that of large babies was 1.4%. Specifically, the mortality rate for infants weighing 500-749 g was the highest (62.1%), whereas it was 28.9% for infants weighing 750-999 g, 9.8% for infants weighing 1,000-1,249 g, 4.3% for infants weighing 1,250-1,499 g, and less than 2% for infants weighing more than 1,500 g (Tables 6, 7). The mortality rates according to gestational age and birth weight group are shown in Fig. 2.
The gestational age distribution of the 286 dead patients was 71.3% (n=204) premature infants, 28.0% (n=80) term infants, and 0.7% (n=2) post-term infants. Premature infants of less than 30 weeks of gestation accounted for almost half (48.3%, n=138) of the total deaths. The birth weight distribution of the dead patients was 73.4% (n=210) LBWIs, 25.2% (n=72) normal weight infants, and 1.4% (n=4) large babies. The VLBWIs accounted for more than half of the deaths (54.2%, n=155) (Table 5).
The mortality rate was higher in outborns than in inborns (4.3% vs. 3.1%, p=0.01) and in multiples than in singletons (5.6% vs. 3.1%, p<0.01). No statistically significant differences were found according to delivery mode or gender, however.
2) Cause of death according to patient characteristics
The most common cause of death among the 286 dead infants was sepsis with disseminated intravascular coagulation (DIC; 22.4%). The other causes were perinatal asphyxia (18.9%), respiratory distress syndrome (RDS; 9.1%), severe intraventricular hemorrhage (IVH; 8.0%), congenital heart disease (8.0%), acute renal failure with hyperkalemia (7.7%), massive pulmonary hemorrhage (7.3%), tension pneumothorax (7.0%), respiratory failure related to congenital myotonic dystrophy (3.5%), and severe bronchopulmonary dysplasia (BPD; 2.1%). Among the premature infants' deaths, sepsis with DIC was the most common (24.0%), followed by RDS (11.3%), and massive pulmonary hemorrhage (10.8%). Cause of death in term infants was most often perinatal asphyxia (31.3%), and then congenital heart disease (20.0%) and sepsis with DIC (16.3%). Among the post-term infants, only two died, one of congenital heart disease and one of sepsis.
In LBWIs, sepsis with DIC (22.3%) was the most common cause of death, and then RDS (14.6%). In normal weight infants, perinatal asphyxia (31.9%) was the most common, followed by sepsis with DIC (19.4%) and congenital heart disease (15.3%). Four large babies died: two of perinatal asphyxia, one of congenial heart disease, and one of anencephaly. Among 188 inborn patients who died, 22.9% died from sepsis with DIC, 12.2% died of perinatal asphyxia, and 11.2% died of RDS, whereas among 98 outborns, 31.6% died from perinatal asphyxia, 21.4% died of sepsis with DIC, and 13.7% died of congenital heart disease.
3) Cause of death according to postnatal days of life
The average postnatal age at death was 13.1 days (range, 1 to 199 days). There were 34 infants (11.9%) who died within 1 day, 131 (45.8%) who died within 2 to 7 days, 89 (31.1%) who died within 1 to 4 weeks, and 32 (11.2%) who died within 4 weeks. Regarding causes of death according to days of life, perinatal asphyxia was the most common (38.2%), and then RDS (29.4%), septic shock (5.9%), and severe IVH (2.9%), in the first day of life. During the first week of life, perinatal asphyxia was the most common (24.2%), then sepsis with DIC (14.5%), RDS (12.7%), and severe IVH (9.7%). Of infants dying later than 4 weeks of life, 34.4% died of sepsis with DIC, 18.8% died of severe BDP, and 9.4% died of congenital heart disease.
DISCUSSION
Along with the significant economic growth from the 1960s to 1980s, the other criterion signifying successful modernization was family planning. As a result, the TFR dropped from 4.5 in the 1970s to 2.8 in the 1980s and to 1.6 in the 1990s. Despite the pronatal policies of the Korean government, the TFR in 2009 was 1.15, which was the lowest in the world, and this became a serious social issue. Despite the fact that the annual number of live births is decreasing, the numbers of high-risk infants, such as premature and LBWIs, are increasing as the result of later marital ages leading to pregnancies at older ages and the higher rates of multiple pregnancies associated with infertility procedures. Increased survival rates of premature infants and LBWIs, owing to developments in neonatal medicine, play an important role in increasing the population in an era of lower fertility rates.
Similar to the decline in live births in the Gwangju-Chonnam area, from 45,075 in 1999 to 30,253 in 2008,5 the number of inborn live births at Chonnam National University Hospital decreased from 1206 to 899. However, the number of NICU patients decreased slightly, from 616 to 571, in the same period. Moreover, the birth rate for high-risk infants apparently increased due to the increased admission rate for inborn infants, from 51.1% in 1999 to 63.5% in 2008; the increased proportion of outborn infants in the NICU, from 24.0% to 27.7%; and the increased proportion of NICU patients among the live births in the Gwangju-Chonnam area, from 1.8% to 2.6%.
Park et al6 compared the nationwide neonatal statistics of 62 general hospitals in 2002 with those of 64 hospitals reviewed by Bae et al7 in 1996. They showed that the rate of premature infants increased from 11.1% to 17.5%, whereas the rate of LBWIs increased from 9.8% to 15.3%. In our study, the rate of premature infants among inborns was 40.3% and the rate of LBWIs was 39.0%, which were thus much higher than the rates reported in those two studies.6,7 Furthermore, the rate of VLBWIs (10.0%) was also higher than previous data in our hospital between 1996 and 2001 (6.0%).8 This suggests that the high-risk pregnancy rate is increasing faster than before and is higher than in other tertiary hospitals. The proportions of premature (52.4%) and LBWIs (48.5%) among NICU patients were around half, which was close to the proportions reported by Bae et al9 in 2009.
In our hospital, the overall C-section rate was 54.0%, with no large differences for any years compared with the increasing rates for the premature infants, LBWIs, and multiples. The male to female ratio was 1.27:1, and it was greatest in 2004 (1.5:1). The rate of multiples increased from 11.0% to 13.3% in the same period (average 13.8%), with a peak in 2003 (16.1%), when the number of NICU patients was greatest. When comparing our data of 2008, which was the last year of this study, to the national statistics of 2008,10,11 we found that we had more high-risk pregnancies and higher rates of C-section (50.3% vs. 36.3%) and multiples (13.3% vs. 5.4%).
Among NICU patients, the increased proportion of premature infants less than 37 weeks of gestation, from 52.5% in 1999 to 55.6% in 2008, seemed to be an increased proportion of infants born at 30 to 37 weeks, because the proportion of premature infants born at less than 30 weeks decreased, from 10.2% to 6.7%, in the same period. The proportions of LBWIs and VLBWIs decreased, from 52.3% to 47.1%, and from 15.1% to 10.1%, respectively. However, the proportion of ELBWIs increased, which we consider to be because of an increase in small for gestational age infants, due in turn to increases in high-risk pregnancies, such as pregnancies with preeclampsia or eclampsia, multiple pregnancies, and so on. In NICU patients, 58% to 59% of term or normal birth weight infants were inborn, whereas more than 80% of premature or LBWIs were outborn.
Bae et al6 reported that the mortality rate for premature infants dropped from 7.8% in 1999 to 5.5% in 2008, and the rate for LBWIs likewise dropped from 8.4% to 6.1%. However, we have to make a constant effort to improve, because this rate is similar to that in the United States but still higher than that of Japan. In our study, the mortality rates for premature infants (4.7%) and LBWIs (5.2%) were lower than those reported by Bae et al.6 The mortality rate for VLBWIs (15.0%) was also much lower than a previous report of our hospital (28.2%) by Kim et al in 2003.8
There is recent and rising interest in ELBWI survival. In our study, the ELBWI mortality rate (36.1%) was higher than that reported by Park et al (25%).12 Likewise, the mortality rate of infants less than 500 g (100%) was higher than that reported by Chang et al (56%).13 This could be due to whether a report did or did not include in the death count the cases discharged against medical advice and whom physicians regarded as likely to die. Additionally, this rate depends on the number of congenital anomalies, clinical conditions at the time of maternal or infant transport, and the level of the medical facility and medical personnel. In our study, we included in the deaths the cases who were discharged against medical advice and whom physicians regarded as likely to die. The outborns were more than one quarter of NICU patients, and, even in the case of the inborns, they were close to outborns because they were born soon after the maternal transport.
The mortality of NICU patients decreased from 4.7% in 1999 to 2.9% in 2008, and it decreased similarly, from 6.6% to 3.9%, for premature infants. It decreased from 7.1% to 4.3% for LBWIs in the same period, but no decrease occurred for the infants at less than 1,000 g or at 30 weeks' gestation. Therefore, the decrease in the mortality rate seemed to be due to the decrease for infants between 30 and 37 weeks or between 1,000 and 2,500 g. To reduce the mortality rate further, we must focus our attention on saving the infants weighing less than 1,000 g or at less than 30 weeks' gestation. According to the mortality rates by gestational week or birth weight, premature infants accounted for 4.7% of the average overall rate, 2.0% of the term infants, 8.3% of the post-term infants, 36.1% of the ELBWIs, 14.5% of the VLBWIs, 5.2% of the LBWIs, 1.8% of the normal weight infants, and 1.4% of the large babies.
Of the 286 dead infants, more than half were premature infants of less than 30 weeks of gestation or were VLBWIs, and more than 70% were either premature infants or LBWIs. The mortality at less than 23 weeks' gestation was 100%; that at less than 24 weeks, 78.6%; that at birth weights less than 500 g, 100%; and that at weights from 500 to 749 g, 62.1%. This suggests that gestational week and birth weight are critical to survival, and the lower limits for survival are 24 weeks and 500 g. The mortality rate of outborn patients was higher (4.3%) than that of inborns (3.1%; p=0.01), which emphasizes the importance of maternal transport. Also, the mortality rate for multiples was higher (5.6%) than that for singletons (3.1%; p<0.01). This suggests that being outborns and multiples were also risk factors for death.
The patients dying within 1 day accounted for 12% of deaths, whereas 58% died within 1 week. Regarding the causes of death, identifying the main cause of death is often difficult, because in most cases several events occur suddenly and simultaneously, or at least during a short time, and the medical record is sometimes inadequate, especially for transferred patients. In this study, the major causes of death related to prematurity, such as sepsis with DIC (22.4%), perinatal asphyxia (18.9%), RDS (9.1%), and severe IVH (8.0%). By clinical characteristics, the most common causes of death were sepsis with DIC for premature or LBWIs, perinatal asphyxia for term or normal weight infants, sepsis with DIC for inborns, and perinatal asphyxia for outborn infants. According to the postnatal age, the most common causes of death were perinatal asphyxia for those dying within 1 week and sepsis with DIC for those dying after 4 weeks of life.
In conclusion, educating medical personnel about immediate postnatal care (including neonatal resuscitation in the delivery room) and about the prevention and control of hospital infections is very important. Additionally, a systematic team approach to regionalization and medical training for safe and effective transport of high-risk mothers and infants seems to be necessary.

 XML Download