

 PDF
PDF ePub
ePub Citation
 Print
Print


INTRODUCTION
Glomerular epithelial cells (GECs) are highly specialized cells characterized by actin-rich foot processes that reside on the glomerular basement membrane. These cells have an important role in the maintenance of the structure and function of the glomerular filter.1 Injury to the glomerulus is characterized by the disappearance or effacement of the foot processes, leading to leakage of protein into the urine. Several inflammatory diseases, such as glomerulonephritis, and diabetic nephropathy result in GEC loss and glomerulosclerosis.2 Recent data suggest that the diabetic milieu involves damage to GECs.3
Oxidative stress arises from the strong cellular oxidizing potential of excess reactive oxygen species (ROS) or free radicals. Despite their toxic effects, ROS play important roles in signal transduction pathways, such as apoptosis, cell proliferation, and differentiation, and as defenders against bacterial invasion.4 Moreover, ROS induced by ischemia-reperfusion or inflammation cause serious damage to tissues, including the kidneys.5 ROS contribute to stimulated cell death by damaging DNA and by stimulating the lipoperoxidation of cellular membranes.6 Organisms respond to ROS through adaptation reactions, such as the stimulation of antioxidant proteins and antioxidant enzymes, including reduced glutathione (GSH), superoxide dismutase (SOD), and catalase.7 However, the ROS-regulated signaling pathways leading to renal cellular responses in the diabetic kidney are not entirely clear.
Transforming growth factor (TGF)-β is a multifunctional signaling cytokine that may alter cell behavior by controlling the growth, differentiation, death, and function of cells.8 Protein kinase C (PKC) is a family of serine/threonine kinases that are involved in a variety of pathways that regulate cell growth, death, and stress responsiveness. Current evidence demonstrates that PKC is a sensitive target for redox modification.9 Nuclear factor-κB (NF-κB) is a heterodimer that is activated in response to primary or secondary pathogenic stimuli.10
Epigallocatechin-3-gallate (EGCG) is the most abundant antioxidant polyphenol in green tea. It is a useful agent for protecting against protein oxidation-associated diseases.11 It has been shown to improve age-related cognitive decline, cerebral ischemia/reperfusion injuries,12 and diabetic nephropathy induced by streptozotocin (STZ) injection.13 Although the activity of EGCG in biological events has been investigated, its effect on signal transduction is not yet fully defined.
In the present study, we studied the close relation between the antioxidant property of EGCG and the protection of GECs exposed to high levels of glucose and tried to determine the possible intracellular signaling pathways implicated.
MATERIALS AND METHODS
1. Reagents
EGCG, D-glucose, mannitol, and dihydrodichlorofluorescein diacetate (DCF-DA) were purchased from Sigma (St. Louis, MO). Anti-phospho-PKC α/βII (Thr638/641) antibody was purchased from Cell Signaling Technologies Inc. (Beverly, MA), and anti-TGF-β1 antibody, anti-PKC-α antibody, and anti-GAPDH antibody were from Santa Cruz Biotechnology Inc. (Santa Cruz, CA).
2. Cell culture
Rat glomerular visceral epithelial cells were isolated and characterized as previously described.14 Cells were used between the 10th and 20th passages and were cultured in Dulbecco's modified Eagle's medium (Life Technologies, Grand Island, NY) containing 10% fetal bovine serum (Cambrex Co., Walkersville, MD), 0.5 mg/ml Fungizone, and 100 U/ml penicillin, as described previously.15,16 When the cells reached 70% confluence in 100-mm culture dishes, they were incubated in serum-free media for 2 days to arrest and synchronize cell growth.
3. Measurement of intracellular oxidative activity
Cells were seeded in serum-free and phenol-red-free culture medium in 96-well plates for 24 hours, and then glucose was added to 30 mM. The cells were then washed in phenol-red-free culture medium containing 11 µM DCF-DA for 1 hour at 37℃. Well fluorescences were then measured (480 nm excitation and 530 nm emission).
4. Measurement of GSH
GSH levels in cells were estimated by using 5-5'-dithiobis-(2-nitrobenzoic acid) (DTNB) reagent.17 Cells (6×10⁵) were incubated in DMEM-serum for 24 hours. GECs were treated with EGCG (100 µM) 2 hours before adding glucose (30 mM). Cells were washed with PBS and 1 ml of 3% perchloric acid was added and the cells were collected into microtubes. The tubes were placed on ice for 15 min and then centrifuged at 14,000×g (4℃, 10 min) and the supernatant was collected. To neutralize the supernatant (pH 7.5), the supernatant was transferred to fresh tubes containing 0.5 M KOH/9 mM Borax. To 250 µl of sample, 200 µl of DTNB reagent, 200 µl of NADPH, and 100 µl of GSSG reductase were added and the samples were incubated for 2-3 minutes in a 1-ml semimicro cuvette. The changes in absorbance at 412 nm were monitored for 3 min. The amount of GSH in the sample was calculated in nmole of GSH per mg protein from a standard curve obtained by using known quantities of GSH.
5. Measurement of lipid peroxidation
The lipid peroxide level in cells was measured by using a thiobarbituric acid (TBA) assay, which monitors MDA production, according to the method of Buege and Aust.18 Cells (6×10⁵) were incubated in DMEM-serum for 24 hours. GECs were treated with EGCG (100 µM) 2 hours before adding glucose (30 mM). After 24 hours, the cells were washed and centrifuged at 14,000×g (4℃, 10 min), and 0.5 ml of the samples was added to 3 ml of 1% phosphoric acid and 1.0 ml of 0.6% TBA. These mixtures were heated in boiling water for 20 min. After cooling, the MDA was extracted by centrifugation at 15,000×g for 10 min and absorbance was measured at 532 nm. The results were expressed as nmole of MDA per mg protein.
6. Real-time reverse transcription (RT)-PCR
Total cellular RNA was isolated by using the single-step method and TRIzol reagent (Sigma, St. Louis, MO) and were reverse transcribed into cDNA. cDNA was then amplified by using a PCR Thermal Cycler (Takara Bio Inc., Otsu, Shiga, Japan). The sequences of PCR primers used were as follows: rat TGF-β1 (sense, 5'-gac cgc aac aac gca atc tat gac-3'; antisense, 5'-gct gaa cca agg aga cgg aat aca-3') and GAPDH (sense, 5'-gtc ttc acc acc atg gag aag g-3'; antisense, 5'-ctg gcc aag gtc atc cat ga-3'). PCR was conducted by using 30 amplification cycles of 95℃ for 50 s, 60℃ for 50 s, and 72℃ for 50 s. After amplification, RT-PCR products were separated in 2% (w/v) agarose gels and stained with ethidium bromide. The sizes of the PCR products for TGF-β1 and GAPDH genes were 303 bp and 198 bp, respectively. A PCR mixture containing SYBR-green (SYBR premix ExTaq, Takara Shuzo, Kyoto) was used. PCR reactions in a final volume of 20 µl of reaction mixture contained 10 µl PCR mixture, 2 µl of specific primers (10 pM), 7 µl of nuclease-free water, and 1 µl of cDNA. Amplification was performed by using a Rotor-Gene 3000 (Corbett Research, Australia) programmed at 95℃ for 15 min followed by 50 cycles of 95℃ for 10 s, 60℃ for 20 s, and 72℃ for 30 s. Data from the reaction were collected and analyzed with Corbett Research Software (version 6.0). The comparative critical threshold (Ct) values from quadruplicate measurements were used to calculate the gene expression, with normalization to GAPDH as an internal control. Melting curve analysis was performed to enhance the specificity of the amplification reaction.
7. Preparation of cell lysates and western blot analysis
GECs treated with 30 mM glucose in the absence or presence of EGCG were washed twice with ice-cold phosphate-buffered saline solution and harvested by using a plastic scraper. Cells were lysed in lysis buffer on ice. The cell lysates obtained were then centrifuged at 13,200 rpm at 4℃, and the supernatants were transferred to fresh tubes and stored at -80℃ until required. Protein concentrations of lysates were determined by using BCA protein assay reagent. Proteins (10 µg) were resolved in 10% sodium dodecyl sulfate-polyacrylamide gels at 120 V for 1 hour in a Mini-Protein II gel apparatus (Bio-Rad, Richmond, CA) and were then blotted onto a pre-wetted nitrocellulose membrane by using a Mini-Protein II gel apparatus. Membranes were incubated with washing buffer containing 5% nonfat milk for at least 1 hour to block nonspecific protein binding. Primary mAb was diluted up to 1:1,000 in washing buffer and applied to membranes for 16 to 18 hours at 4℃. After washing, blots were incubated with the appropriate HRP-conjugated biotinylated secondary mAbs for 50 min at room temperature. Immunoreactive bands were visualized by Western blotting by using Luminol Reagent (Santa Cruz Biotechnology).
8. Preparation of nuclear extracts and gel shift assay
GECs were treated with EGCG followed by treatment with 30 mM glucose. Nuclear extracts were prepared from the cells as previously described, and extracts were frozen at -80℃. Protein concentrations in nuclear extracts were determined by use of BCA protein assay kits (Pierce Biotech., Rockford, IL). For gel shift assays, the nuclear extracts were incubated with biotin-labeled probes in binding buffer for 30 min at room temperature, according to the manufacturer's protocol (Panomics, Redwood City, CA). The probe sequences were as follows: NF-κB, AGTTGAGGGGACTTTCCCAGGC. For the competition control, we added excess unlabeled cold probes to the sample containing nuclear extract and biotin-labeled probe. The samples were separated on a 6% polyacrylamide gel in 0.5% Tris-borate-EDTA buffer at 120 V for 60 min, transferred onto a nylon membrane, and fixed on the membrane by baking and UV crosslinking according to the manufacturer's protocol (Panomics, Redwood City, CA). The biotin-labeled probe was detected with streptavidin-horseradish peroxidase.
9. Statistics
Data are presented as the mean±S.E. Statistical significance was determined by using the ANOVA test (StatView; Abacus Concepts Inc., Berkeley, CA). All experiments were performed at least three times on separate days and the data presented herein are representative of the results obtained from all repetitions. p values of less than 0.05 were considered to be significant.
RESULTS
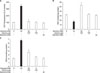
1. Effects of EGCG on high-glucose-induced ros production and content of GSH and LPO in GECs
To determine whether pretreatment with EGCG inhibited high-glucose-induced ROS generation, we examined cellular ROS levels in GECs. ROS production was significantly increased at a glucose concentration of 30 mM, whereas pretreatment with EGCG (100 µM) for 2 hours significantly decreased ROS production (Fig. 1A). Furthermore, to determine whether EGCG pretreatment modulated the high-glucose-stimulated production of GSH and MDA, we measured GSH and LPO levels in GECs. As shown in Fig. 1B, treatment with 30 mM glucose reduced GSH contents in the GECs, which were increased by pretreatment with EGCG (100 µM) for 2 hours. On the other hand, LPO analysis revealed that production of MDA was reduced by pretreatment with EGCG (100 µM), but was increased by treating with 30 mM glucose alone (Fig. 1C). The production of MDA was not affected by treatment with 30 mM mannitol (an osmotic control) or 100 µM EGCG in 5 mM glucose.
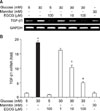
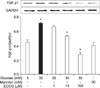
2. Effects of EGCG on high-glucose-induced TGF-β1 expression
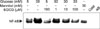
TGF-β1 has been thought to mediate high-glucose-induced kidney damage. We investigated TGF-β1 mRNA and protein levels in GECs. We examined whether 30 mM glucose induced the mRNA expression of TGF-β1 in GECs by mRNA expression analysis performed by using real-time RT-PCR. TGF-β1 mRNA expression was increased by treatment with 30 mM glucose alone, whereas pretreatment with EGCG (10 and 100 µM) for 2 hours significantly reduced the expression of the TGF-β1 genes (Fig. 2). To further verify the effects of EGCG on the protein expression of TGF-β1, a Western blot analysis was performed. The protein levels of TGF-β1 in the GECs were similar to the mRNA expression (Fig. 3).
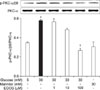
3. Effects of EGCG on high-glucose-induced phosphorylation of PKC α/βII
PKC α/βII has been suggested as being a downstream regulator of ROS under high-glucose conditions. Therefore, we investigated the relationship between PKC α/βII activation, glucose-induced ROS generation, and TGF-β1 expression in GECs to determine whether EGCG plays a role in PKC α/βII phosphorylation. As shown in Fig. 4, marked increases in the phosphorylation of PKC α/βII were observed after treating GECs with 30 mM glucose for 24 hours. Pretreatment with EGCG at 100 µM completely inhibited the 30 mM glucose-induced phosphorylation of PKC α/βII, which suggests that EGCG inhibits 30 mM glucose-induced alterations in the phosphorylation of PKC α/βII.
4. Effects of EGCG on high-glucose-induced alterations in the activation of NF-κB
Finally, we examined the effect of EGCG on the activation of NF-κB. As shown in Fig. 5, treatment with 30 mM glucose resulted in activation of NF-κB in the GECs, which was prevented by pretreatment with EGCG (1, 10, 100 µM) in a dose-dependent manner. Complete blocking of NF-κB mobilization by the addition of the cold competitor indicated the specificity of NF-κB binding.
DISCUSSION
TGF-β1 signaling plays important roles in the progression of kidney diseases and the accumulation of extracellular matrix in diabetic nephropathy.19-21 In many renal cell types, high glucose stimulates the expression of TGF-β22 and increases the secretion of TGF-β1 that then acts on the cell in an autocrine manner to stimulate the expression of extracellular matrix proteins.23 However, the mechanisms by which TGF-β1 operates in diabetic nephropathy are hard to define; signal transduction events seem to be similar to the process induced by known pathways of stimulation of TGF-β1 synthesis (i.e., through smad, MAP kinases).24,25 We report here that the expression of mRNA and protein for TGF-β1 was significantly increased in GECs under the high-glucose condition when measured by real-time RT-PCR and Western blot analysis.
Recent studies suggest that phosphorylation of PKC contributes to up-regulation of the development of endothelial hyper-adhesiveness during acute hyperglycemia.26 Endothelial nitric oxide synthase is suppressed by activation of PKC-β in high-glucose conditions, resulting in a rapid reduction in the production of nitric oxide in renal glomerular capillary endothelial cells.27 High glucose increases the expression of PKC-β and PKC-δ in endothelial cells of bovine retina.28 To determine whether the effects of high glucose result from phosphoryration of PKC α/βII, we exposed cells to high-glucose conditions and performed Western blot analysis.
ROS may either act as second messengers for NF-κB activation or directly induce their activation in a cell-specific manner.29 Recent studies have focused on the pro- or anti-apoptotic role of NF-κB that mediates the survival of cells. The transcription factor NF-κB plays a key role in regulating apoptosis in numerous cell types by regulating the expression of a number of genes involved in proliferation and apoptosis. NF-κB activation is thought to play an important role in the pathogenesis of renal failure. The present findings indicate that EGCG inhibited the NF-κB activation induced by 30 mM glucose, which suggests that EGCG protects GECs from glucose-induced injury via down-regulation of NF-κB activation.
In summary, we demonstrated that increased production of ROS and MDA contents by high glucose in GECs was suppressed by the antioxidant EGCG. Moreover, GSH content, which was decreased by high glucose, was increased by EGCG. EGCG prevented TGF-β1 expression, phosphorylation of PKC α/βII, and NF-κB activation in GECs under high glucose concentrations. Our results provide evidence that EGCG could be a useful factor in modulating the injury to GECs by high glucose and that supplementation with antioxidants is a promising complementary treatment that may exert beneficial effects in the diabetic kidney.
 XML Download