

 PDF
PDF ePub
ePub Citation
 Print
Print


Introduction
The navicular bone is one of the tarsal bones present on the medial side of the foot. The word navicular in Latin means a little ship [1]. It articulates with talus proximally and with the three cuneiforms distally. It also gives attachment to the tendon of tibialis posterior muscle [2]. The navicular bone derives its dorsal blood supply from a branch of dorsalis pedis artery and plantar blood supply from medial plantar branch of posterior tibial artery [3]. These branches enter the bone through the numerous vascular foramina present on the surface of the bone.
Navicular is the most frequently injured lesser tarsal bone and an important constituent in the transverse tarsal locking mechanism [1]. Acute navicular fractures are broadly classified into three types: avulsion fractures, tuberosity fractures, and body fractures [4]. Tuberosity and displaced body fractures are treated surgically while others are treated conservatively [5]. Navicular stress fracture is common among athletes and may have devastating consequences including avascular necrosis [67].
Thus, the knowledge about the vascular foramina of the navicular bone becomes important for orthopaedic and vascular surgeons. An enhanced knowledge about the vasculature and their foramina helps in understanding the various factors which play a prominent role in development of osteonecrosis of the navicular bone. The present study has been under-taken keeping the fact that there exists lacuna in literatures about the vascular foramina of the navicular bone in Indian population. The aim of the present study was to study the vascular foramina of the dried navicular bones with respect to its morphology and morphometry in Indian population.
Materials and Methods
The study was conducted on 100 (50 right-sided and 50 left-sided) dried human navicular bones obtained from the Department of Anatomy at Mahatma Gandhi Medical College & Research Institute, Puducherry and from other medical institutes in and around Puducherry. The present study has been approved by the ethics committee of our institution with respect to the human rights. Age and gender of the bones were not known. Bones having distorted gross morphological features and pathological changes were excluded from the study. The side determination of the bones was done using various anatomical features [2].
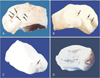
The vascular foramina were identified by the presence of a well-marked groove leading to foramen indicating the site of vessel entry (Fig. 1A). The navicular bones were macroscopically
examined for the foramina on both articulating and non-articulating surfaces. The parameters studied for the vasculature of navicular bone were the location, number, shape, and size of the vascular foramina. A magnifying hand lens was used to observe the location and the number of foramina on various surfaces of the bone. The shape of the foramina was determined by observing the marginal outline of the foramina on the surface of the bone. Based on this the shape of the foramina were classified as circular or oval in appearance. The size of vascular foramen was measured using a Krischner-wire (K-wire) with diameter of 1 mm. Those foramina which did not allow the K-wire to pass through were classified as <1 mm in size and those which allowed the K-wire to pass through were classified as ≥1 mm in size.
The foramina on the dorsal surface were numbered as first, second and so on till ten based on its proximity to the midpoint of the navicular tuberosity. The midpoint of the navicular tuberosity was taken as the reference point (RP). The distance of each foramen on the dorsal surface measured from the RP was taken as D1, D2, D3, D4, D5, D6, D7, D8, D9, and D10. The distance from the RP to the most prominent point on the lateral surface of navicular bone was taken as the length of navicular bone (Fig. 1B).
All measurements were made using the digital vernier caliper with accuracy of 0.02 mm (Aerospace). The counting and measurements were done by the same person twice to avoid the inter-observer error. Statistical analysis was done using the SPSS version 13.0 (SPSS Inc., Chicago, IL, USA). Mann Whitney U test and student unpaired t test was applied to find statistical difference between the parameters of right and left navicular bones. Kruskal-Wallis test was used to compare the number of nutrient foramina on various surfaces of the bone followed by series of Mann-Whitney U test for the post hoc analysis. Spearman's rank correlation coefficient was done to correlate the shape and the size of the foramen. A P-value less than 0.05 was taken statistically significant.
Results
All the navicular bones (100%) exhibited the vascular foramina over the nonarticular surfaces. The foramina were observed over the dorsal, plantar, lateral, and medial surfaces of the navicle (Fig. 2). The proximal and distal surfaces did not show any vascular foramina. The dorsal surface presented maximum number of foramina followed by the plantar and lateral surfaces. The medial surface presented the least number of foramina. Twenty-nine percent specimens showed complete absence of vascular foramina on the medial surface.
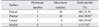
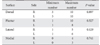
Kruskal-Wallis test showed that there was a statistically significant difference in total number of nutrient foramina between the different surfaces of navicle, χ2(3)=263.4, P=0.001, with a mean rank foramina number of 316.2 for dorsal surface, 251.3 for plantar surface, 68.5 for medial surface, and 165.9 for lateral surface. Mann-Whitney U test done for post hoc analysis showed the total number of nutrient foramina observed on dorsal surface were significantly greater than the number observed on the plantar (U=2,755, P=0.001), medial (U=43, P=0.001), and lateral (U=626.5, P=0.001) surfaces of the navicle (Table 1). The number of foramina ranged from 1 to 10 in each navicular bone. On the medial surface the foramina ranged between 0 to 4, lateral surface ranged between 1 to 6 and plantar surface between 1 to 10. The number of the foramina at the dorsal surface varied between 3 to 10 with a mean of 6 foramina (Table 1). On the dorsal surface 56% of the bones exhibited ≥6 foramina and 44% of the bones exhibited <6 foramina. In total of 604 foramina observed on the dorsal surface, 376 foramina (62.3%) were located within 50% length of the navicular bone. Table 2 summarizes the distribution of foramina on various surfaces between the right and left navicular bones.
The shape of the vascular foramen was oval or circular in appearance (Fig. 2). Majority of the foramina 1,407 (97.6%) were circular in appearance and 35 foramina (2.5%) were oval in appearance. The oval foramina were present only in 25% specimens and their distribution was confined mostly to the dorsal or plantar surface of the navicular bone. A total of 1,442 vascular foramina size was measured in 100 navicular bones. Majority of the foramina 1,395 (96.7%) were <1 mm in size and 47 foramina (3.3%) were ≥1 mm in size. The foramina ≥1 mm in size were present only in 28% specimen and their distribution was confined mostly to the dorsal or plantar surfaces of the navicular bone. Spearman's rank correlation coefficient showed a strong, positive correlation between vascular foramina of <1 mm size and circular shape, which was statistically significant (rs=0.981, P=0.001).
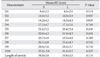
Table 3 summarizes the distances of each foramen on the dorsal surface from midpoint of the navicular tuberosity and length of navicular bone between the right and left bones. The length of navicular bone observed was between 22.9 and 42.7 mm with mean length of 34.9±3.8 mm. There was no significant difference observed in the distances measured between the right and left sided bones.
Discussion
The position of the navicular bone in the foot is compared with position of scaphoid bone of the hand and hence the term navicular bone or hand navicular bone was formerly used for the scaphoid bone [8]. The tarsal navicular bone forming a part of medial longitudinal arch plays an integral role in the hind foot motion and gait [9]. The navicular bone gives attachment to the plantar calcaneonavicular (spring) ligament lateral to the navicular tuberosity adjacent to the proximal surface. The calcaneonavicular part of the bifurcate ligament is attached to the rough part of the lateral surface of the bone. The anterior part of the deltoid ligament is attached to the navicular tuberosity [10]. The talo-navicular ligament is attached to the dorsal surface of the navicle. The plantar and dorsal cuneo-navicular ligaments connect the cuneiforms with the navicle. The plantar and dorsal cuboideo-navicular ligaments connect navicle with cuboid. This robust ligamentous network can only be disrupted in the setting of high-energy trauma causing displaced navicular fractures [11]. Foot pain is a very common symptom in patients with orthopaedic problems [12]. Navicular stress fractures accounts for 14% to 35% of all stress fractures and presents with increasing pain in the dorsal mid-foot [131415].
The vascularity of the bone along with the biomechanical factors plays an important role in development of navicular stress fracture. A microangiopathic study by Torg et al. [6] on cadaveric feet stated that the navicular bone is supplied by both the anterior and posterior tibial arteries. Another study showed that arterial branches enter at the small “waist” of cortical bone and gets distributed to supply the medial and lateral thirds leaving the central one third as area of relative avascularity [16]. Golano et al. [3] also showed osteonecrosis or stress fractures can affect the navicular bone because of its poor vascularization, especially in its central portion. But, a study done by McKeon et al. [17] on vascularity of navicular bone using modified Spälteholz technique showed that the navicle had a dense intraosseous vascular supply throughout and only 11% bones had an avascular central zone.
The branches of the arteries enter the bone through the vascular foramina on its surface. A study by Manners-Smith [18] showed that in human navicular bones, the plantar surface presented many foramina for nutrient vessels. However, the present study findings differ from the earlier report. Our findings showed the presence of vascular foramina on the dorsal, plantar, lateral, and medial surfaces. The occurrence of vascular foramina was a constant feature on the dorsal, plantar, and lateral surfaces. The vascular foramina on medial surface was found to be absent in 29% of the bones. The reason for variation in location of foramina on medial surface could possibly be that the navicular tuberosity receives its blood supply from the anastomosis between the branches of dorsalis pedis and posterior tibial artery as cited by previous studies [3]. The present study showed more number of vascular foramina on the dorsal surface in comparison to the other surfaces of the navicular bone.
In the present study, 97.6% foramina appeared circular and 96.7% foramina were <1 mm in size. Our study also showed that the vascular foramina which appeared oval and ≥1 mm in size were present mostly on the dorsal and plantar surfaces of the bone. The mean length of navicular bone was 34.9±3.8 mm. Internal fixation has been used to treat acute navicular fractures that cannot be managed conservatively [11]. Knowing the mean length in a population helps in designing of the screw, plates and screw constructs used for internal fixation.
Thus, in present study the navicular bone showed absence of vascular foramina on proximal and distal surfaces. Twenty-nine percent of bones showed absence of vascular foramina on medial surface. The maximum number of vascular foramina was observed on the dorsal surface with 62.3% foramina present within 50% of the length of navicular bone. About 96% vascular foramina were <1 mm in size and appeared circular. Modern operation procedures need a clear understanding of the surrounding anatomy [19]. The data obtained may help the orthopedic and vascular surgeons. Understanding the morphological aspects about the structures will set a trend to open more contents into clinical considerations [20]. The limitation of the present study includes the gender related variation was not taken into consideration. We believe the present study has provided additional data on vascular foramina of navicular bone in Indian population. The present study may be an anatomical guide to surgical interventions involving the navicular bone.

 XML Download