

 PDF
PDF ePub
ePub Citation
 Print
Print


Introduction
All humans have similar features in the face. But, their proportions and relationships vary from one face to another within a group or race [1]. The knowledge of facial proportions are essential for a surgeon who will require facial analysis in facial reconstructive procedures.
Men constitute a fast growing market for the aesthetic industry. There are substantial facial anatomical differences between genders with men having a larger but unique cranial shape, increased skeletal muscle mass, unique subcutaneous fat distribution, greater blood vessel density and severe facial skin wrinkles. Despite gender differences in facial anatomy, few studies have examined the role of gender in cosmetic procedures. The approach to male aesthetics differs from that of females [2].
The golden ratio, also known as the divine proportion, is considered by many to be the key to the secret of aesthetics, attraction, and human beauty [3]. The golden ratio (1:1.618) is a special number found by dividing a line into two parts in which, the longer part divided by the smaller part is also equal to the whole length divided by the longer part. It is a geometrical proportion in which, a line AB is divided at a point C in such a way that AB/AC=AC/CB. It is often symbolized using phi, after the 21st letter of the Greek alphabet. In 1509, Luca Pacioli wrote a book that refers to the number as the "Divine Proportion," which was illustrated by Leonardo da Vinci. Da Vinci later called this sectio aurea or the golden section. The golden ratio was used to achieve balance and beauty in many Renaissance paintings and sculptures. The golden ratio also appears in da Vinci's Vitruvian Man and the Mona Lisa [45].
The golden ratio has been scientifically applied in various fields like prosthodontics, facial surgery, orthodontics, facial attractiveness study, and in the development of facial mask and dental grid system [6]. Jefferson [7] stated that, any deviation of human face from golden proportion can result in the development of facial abnormalities and disorders. A study by Rossetti et al. [5] showed that, the ratios between three-dimensional facial distances were not related to attractiveness and most facial ratios were different from the golden ratio.
According to the annual plastic surgery procedural statistics, there were 15.9 million surgical and minimally-invasive cosmetic procedures performed in the United States in 2015, a 2% increase over 2014 [8]. According to the American Society of Plastic Surgeons (ASPS) 2014 procedural statistics, the number of men having plastic surgery continues to rise. Male plastic surgery rates have significantly increased since 2000 and cosmetic procedures are no longer considered to be only for women. Cosmetic surgery has moved beyond just applying the same techniques used for females onto males. Men are seeking to regain a more youthful look, improve their self-image and feel better about their appearance [9].
There are very few anthropometric studies that have dealt with different migrant ethnic groups in the United States. Indian Americans are the second-fastest growing ethnic group in the United States. Most of the studies on facial proportion and golden ratio in the United States were done in Caucasians and therefore, may not be applicable for Indian Americans.
Aesthetic surgery on Indian American patients relying on Caucasian norms may result in dissonant facial proportions. It will be useful if facial proportions data for the Indian Americans are maintained and used in case they need to undergo facial surgeries.
A few studies have been conducted on facial proportions in Indian populations in India [101112]. A study performed by Sadacharan [13] with 100 Indian American female face dealt with facial proportions. Sadacharan [1415] performed an anthropometric studies of horizontal thirds of the face and proportions of lowerface height and orbitofacial assessment in Indian Americans. However, there are no reports available on the facial proportions in Indian American men.
The aim of the present study was to find out the average values of various anthropometric ratios in Indian American male face and to compare them with the Caucasian norms. This study also attempted to find out if any of the ratios can be called as golden or divine and silver proportions.
Materials and Methods
The study group consisted of 100 Indian American male students (with origin to northern India) of American University of Antigua (AUA), Antigua. The age of the subjects ranged from 18–30 years. This study was approved by AUA Ethics Committee. The subjects with, previous history of developmental and neurological defects of facial region, cosmetic treatment of facial region, cranio-facial trauma, surgery, and bi-racial ethnic origins were excluded.
This study was funded by School of Medicine, AUA, Antigua. The study was explained and the standard informed consent forms were collected from the participants prior to the study. The anthropometric landmarks were identified on the subjects with careful inspection and were marked on the face with black liquid eye liner.
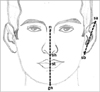
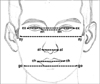
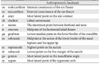
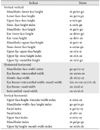
The following anthropometric landmarks were made on both sides of the face and measured (Table 1, Figs. 1, 2): ex, exocanthion; en, endocanthionl; ch, cheilion; al, alare; sa, superaurale; sb, subaurale; go, gonion; and zy, zygion.
The following landmarks were made along the midline of the face and measured (Figs. 1, 2): n, nasion; sn, subnasale; st, stomion; and gn, gnathion.
Subjects were asked to sit in an upright relaxed position with natural and normal erect posture of the head and shoulders, and both arms hanging free beside the trunk for the linear measurements of the face [16].
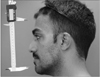
The following measurements were done up to 0.5° and 0.5 mm accuracy on the subjects with maximum care and comfort by using Neiko 01407A stainless steel digital caliper (Grace Marketing-HI, Columbia, MO, USA) with extra-large liquid crystal display (LCD) screen and instant Society of Automotive Engineers (SAE)-metric con version (New York, NY, USA). Every measurement was obtained twice by the same observer. A third reading was taken in case, if the initial two measurements showed a large discrepancy, and finally the two closer readings out of the three were used (Fig. 3) [1415].
The following standard linear distances were measured and compared to find out the average values of ratios in Indian American men and to compare them with Caucasian norms. Facial ratios (vertical-vertical, horizontal-horizontal, and vertical-horizontal) were undertaken in this study, summarized in Table 2.
Statistical analysis
Data were collected and analyzed in accordance with the current law about personal data and privacy. The statistical analysis was performed using "Graph pad instat" (version 3.06, GraphPad Software Inc., San Diego, CA, USA). The paired t test was used to compare the difference between right and left side linear measurements. Column statistics were used to calculate the mean ratio, standard deviation (SD), coefficient of variation (CV), minimum, maximum, and standard error of mean (SEM). Unpaired t test was done to compare the present study data with other studies using mean, SD and number of samples.
Results
The facial anthropometric proportions for 25 indices were calculated in 100 Indian American men. In the present study, the difference between right and left side linear measurements were not significant by using paired t test; hence, the mean values of right and left were taken together. These indices were classified as, vertical to vertical, horizontal to horizontal and vertical to horizontal ratios (Table 2).
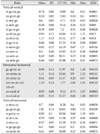
The mean, maximum, minimum, CV, SD, and SEM were calculated and analyzed (Table 3). The closeness of these ratios to the golden and silver proportion was also analyzed.
Vertical to vertical ratios
The upper face-face height, lower face-face height, mandibulo-facial height, mandibulo-lower facial height, and nose-facial height indices have low CV thus, making them far more reliable as compared to other parameters. The CV has been arranged in ascending order. Other parameters that were quite reliable include mandibulo upper face height index and nose lower face height index (Table 3, Fig. 1).
In vertical to vertical ratios, we had a very high CV of upper lip nose height index, ear-lower face height index, upper lip mandible height index, upper lip upper face height index, and ear-nose height index thus making them far more unreliable as compared to other parameters (Table 3).
Horizontal to horizontal ratios
The eye fissure nasal width and eye fissure intercanthal mouth width were the most reliable parameter with low CV. Other parameters such as intercanthal-nasal width, eye fissure intercanthal width, mouth face width, and mandibular face width index were quite reliable with their CV (Table 3, Fig. 2).
Horizontal to vertical ratios
The following parameters were quite reliable with low CV—upper face height biocular width index, facial index, mandibulo width index, nasal index and upper face index, and face height index (Figs. 1, 2).
We found high CV of upper lip height mouth width index and mandibular index thus making them far more unreliable as compared to other parameters (Table 3).
Golden and silver ratios
While looking for the golden proportion, it was seen that only upper face to face height index and mandibulo upper face height index had mean values close to the golden proportion. While looking for silver proportion, it was seen that mandibulo lower face height index, upper face height biocular width index and nasal index means were close to the silver proportion (Table 3).
Discussion
Men have a squarer face, a more angled and larger jaw, and equally balanced upper and lower facial proportions. While many of the same cosmetic procedures are performed in males and females, the approach, assessment, and treatment parameters are often different. Improper technique in a male patient can result in feminizing facial features and patient dissatisfaction. With an increasing number of men seeking aesthetic procedures, it behooves dermatologists to familiarize themselves with male facial anatomy and the practice of cosmetic dermatology in this population [17].
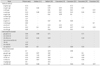
Comparison of the present study with other studies on Indian and Caucasian men revealed variations and similarities in the facial proportions (Table 4). The present study also discussed the closeness of indices to the golden (divine) proportion (0.62) and the silver proportion (0.71) [171819].
In the present study, mandibulo-lower face height, lower face-face height, upper face-face height, nose-face height index, mandibulo-face height, mandibulo-upper face height and upper lip-upper face height indices were similar to previous studies done on Indian [20] and Caucasian men [2122].
The upper lip-nose height index in Indian men [11], lower face-face height, nose-face height index, and upper lip-nose height index in Caucasian men [23], upper lip-nose height index and upper lip-mandible height in Indians [20], nose-face height index and upper lip-mandible height in Caucasian men [24] studies were also in agreement with present study whereas, lower face-face height and nose-face height index in Indian men [11], mandibulo-upper face height and upper lip-nose height index in Caucasian men [21], upper lip-nose height index and upper lip-mandible height in Caucasian men [22], upper face-face height and nose-lower face height in Caucasian men [24] studies showed statistically significant differences (P<0.001). In the available literature search, I could not find the data on ear-lower face height and ear-nose height index for the comparison.
The means of upper face to face height index (0.60) and mandibulo upper face height index (0.66) were close to the golden proportions which are similar to the previous studies on Indian men (0.61, 0.67) [20], Caucasian men by Edler et al. [22] (0.61, 0.66), and Caucasian men by Budai et al. [21] (0.63, 0.60), respectively.
In horizontal to horizontal facial ratios on Indian American men, mouth face width index was consistent with previous studies done in Indian men [1120] and Caucasian men [23]. The mandibular face width in Indian men [11] and intercanthal-nasal width in Caucasian men [22] indices were also similar to the present study whereas, mandibular-face width index in Caucasian men [23] and Indian men [20], intercanthal-nasal width in Indian men [1120] and Caucasian men [23] studies showed statistically significant difference (P<0.001). In the available literature search, I could not find the data on eye fissure intercanthal width, eye fissure nasal width, and eye fissure intercanthal mouth width indices for the comparison.
In the present study, eye fissure nasal width and eye fissure intercanthal mouth width showed low CV (9.12%, 10.77%) and are more reliable for judging the facial esthetics when compared to other horizontal to horizontal ratios.
In the present study, the means of horizontal to horizontal ratios were not close to the golden or silver proportion. The mean of eye fissure nasal width in Caucasian men (0.71) [23] and Indian men (0.71) [20] were close to the silver proportion.
Among vertical to horizontal facial ratios in Indian American men, upper lip height-mouth width index was consistent with previous studies done on Indian [20] and Caucasian [202123]. The upper face index in Indian men [20], Caucasian men [23] and mandibular width-face height index in Indian men [11] studies were also similar with the present study whereas, facial, nasal, and upper face indices in Indian men [11], mandibular width-face height, facial, and nasal indices in Caucasian men [23], nasal index in Caucasian men [22] and upper face height-biocular width, mandibular width-face height, facial, nasal, and mandibular indices in Indian men [20] studies showed statistically significant differences (P<0.001).
In the present study, the mean of upper face height biocular width index (0.70) and nasal index (0.76) were close to the silver proportion. The mean of nasal index in Indian men (0.65, 0.64) [1120], Caucasian men (0.66) [23] and upper face index in Indian men (0.67) [11] showed close to the golden proportions. The mean of upper face height-biocular width index in Indian men (0.79) [20] showed close to the silver proportion.
Variations in the facial morphology arise through number of factors which include gender, race, dietary, climate, and environment where we live [25]. The climate, dietary, and environment are different in United States when compared to India. Kunjur et al. [26] suggested that the aesthetic standards of a particular group may not suit other patients belonging to diverse racial and ethnic background.
The studies done on 15 Caucasian men by Edler et al. [22] and 30 Caucasian men by Raschke et al. [24] were based on photographic data. The present study was carried out with hundred Indian American men using direct anthropometry which is a gold standard and accurate anthropometric method used in clinical practice. Results of certain facial ratios in the present study differ from previous reports in Indian men which may be due to differences in the method of measurement used and diverse ethnic background of the our study subjects from within India.
All the 25 variables were found to be similar. Two variables namely upper face to face height index and mandibulo upper face height index were close to golden proportions whereas mandibulo lower face height index, upper face height biocular width index and nasal index were close to silver proportion.
Men are a growing segment of the cosmetic industry. The anatomical variations between genders result in differences in aging. The aging male face is unique and should be assessed and treated differently. As the number of male patients seeking treatment increase, physicians need to account for gender when evaluating and treating a cosmetic patient.
The present study's facial ratios data can be used as a reference value for Indian American men which can be made use of if they need to undergo facial surgery. The aesthetic surgeons must know the average and ideal facial proportions when they apply to the Indian American men patients so that surgical procedures can be performed with the goal in mind of achieving an attractive and harmonious appearance.
 XML Download