

 PDF
PDF ePub
ePub Citation
 Print
Print


Introduction
Fat tissue engineering starts to be of growing interest for plastic and reconstructive surgery [1]. First attempts by using stem cell potential of fat tissue is observed in reconstruction of soft and hard tissue defects [234]. However, the sustainable usage of human adipose derived stroma cells (hADSCs) for its own tissue rehabilitation is still in the beginning. Soft tissue engineering is already used in first clinical investigations like the "cell-assisted lipotransfer" for facial rehabilitation [5]. This leads to a further demand of in vitro experiments in adipogenic cell differentiation to build a bridge for sustainable soft tissue engineering approaches. Especially soft tissue defects caused by trauma, disease or premature aging have been challenging for reconstruction and rehabilitation and can benefit from new treatment attempts [6]. However, a protocol with certain growth hormones for an in vitro adipogenic differentiation has not yet been well established.
Previous studies included the adipogenic stimulation in a general stem cell evaluation [7] to develop main cell lineages like adipogenic, osteogenic and chondrogenic cells based on Dominici et al. [8]. Therefore, a standard composition of ingredients for an adipogenic stimulation medium has been established [9]. This standard composition contains besides standard cell culture ingredients: dexamethasone, isobutyl-methyl-xanthine, indomethacin and insulin. It has been used by a great variety of other study groups [7101112].
After the first success on adipogenic cell differentiation, other study groups improved the ingredients for an enhanced adipogenesis [1314]. Among those, Lequeux et al. [15] composed an improved adipogenic differentiation medium. They replaced indomethacin by adding rosiglitazone, hydrocortisone and triiodothyronine to the basic adipogenic ingredients isobutyl-methylxanthine and dexamethasone. Also they investigated different concentrations of the described supplements to find the best potential, but only to examine an improvement from preadipocytes to adipocytes.
These specific hormones play a pivotal role in the adipogenic differentiation process. Rosiglitazone is a PPARγ2 agonist and is used as an insulin sensitizer [16]. Hydrocortisone in combination with insulin gives a much better outcome on cell proliferation. It is a benefit for promoting differentiation and prolonging the life of the cell culture [17]. Insulin stimulates the uptake of amino acids and glucose in the cell and initiates a cascade of effectors like phosphatidylinositol-3 kinase, AKT1/2 and mammalian target of rapamycin, which have been involved in the process of adipogenesis [1819]. Triiodothyronine (T3) plays a decisive role for improved adipogenic differentiation. T3 interacts with the two primary thyroid receptor isoforms, thyroid receptor a1 (TRa1) and its antagonist thyroid receptor a2 (TRa2) found in fat tissue. The binding of T3 on TRa1 induces the adipogenesis and TRa2 inhibits the T3 activity [20].
The multi-step process of adipogenesis involves transcription factors and cell-cycle proteins, which control gene expression and direct adipocyte development [21]. These master regulators of adipogenesis: PPARγ2, C/EBPα, LPL and GLUT4 portray the lipogenic gene expression influenced by the used growth hormones.
The objective of the current study was to evaluate the in vitro influence of two adipogenic cell culture media: an ordinary commonly used one and a specific one based on the research of Lequeux et al. [15] The aim was to clearly define the most potent adipogenic growth media to establish a reliable protocol for future in vitro fat tissue engineering approaches. Furthermore the examination compared their adipogenic differentiation potential on human bone marrow mesenchymal stroma cells (hMSCs) and on hADSCs for a limited stimulation time of 21 days.
Materials and Methods
Cell harvesting and cell culture
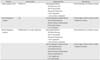
This study followed the Declaration of Helsinki on medical protocol and ethics and the regional Ethical Review Board of the University of Kiel approved the usage of human tissue for research purposes (approval code No. AZ.: D 411/12). The harvested hMSCs and hADSCs were taken from one female donor (age, 54). The cells were harvested during reconstructive oral surgery. Through the access of the iliac crest, bone marrow cells and subcutaneous fat cells were extracted. We decided to use only one donor, because after harvesting cells from a total of 5 patients only the cells of one patient proved to have the most potential in cell expansion. Each tissue was seeded into five 75 cm2 culture flasks containing 10 ml of culture medium (CM). CM had been assembled of Dulbecco's modified Eagle's medium (DMEM) with low glucose (1,000 mg/l) supplemented with fetal calf serum 10%, 100 IU/ml penicillin, 100 µg/ml streptomycin, 25 µg/ml amphotericin, 2 mM L-glutamine and 1 mM ascorbate-2-phosphate (all obtained from Biochrom AG, Berlin, Germany) (Table 1).
The hMSC isolation
The hMSCs were isolated by their ability of adherence to the culture flask [22]. The first medium change removed the non-adherent cells after three days. A cell CM change was performed every 3 days. Cells were incubated and maintained until confluence at day 12 at 37℃ with 5% carbon dioxide. Cells were subcultured under the same conditions until the second passage. The cell collection was completed by washing it with sterile phosphate-buffered saline for 2 minutes (Gibco, Paisly, UK) and incubating it afterwards with 1.5 ml accutase (PAA Laboratories GmbH, Paching, Austria) at 37℃ with 5% carbon dioxidide for 15 minutes. The collected cells were centrifuged at 1,200 rpm for 5 minutes, suspended with CM and counted in a hemocytometer with trypan blue staining. Viable cells of 13.45×10⁵ out of 15.1×10⁵ were determined (89.1% viably).
The hADSC isolation
The preparation of hADSCs was conducted by a modified protocol [9]. The adipose donor tissue had been washed three times with phosphate-buffered saline (Gibco). The tissue was transferred afterwards to a sterile 50-ml centrifuge tube filled with 0.075% collagenase Type II (Sigma-Aldrich Chemie GmbH, Steinheim, Germany). The digestion took place in a Nunc Cell shaker (Nunc A/S, Roskilde, Denmark) for 30 minutes at 37℃ and 5% carbon dioxide with a shaking speed of 80 rpm. For neutralizing the enzymes an equal volume of CM was used. After 5 minutes of centrifugation at 1,200 rpm the supernatant was aspirated and this process step was repeated. Furthermore, a 100-µm nylon filter (VWR International GmbH, Darmstadt, Germany) was used to remove cellular debris and the cell suspension was repeatedly centrifuged at 1,200 rpm for 5 minutes. Ten milliliters of CM suspended the cell pellet. The extracted cells were cultured in the same way like hMSCs (described above in "The hMSCs isolation"). After preparation the cells were counted in a hemocytometer with trypan blue staining. Viable cells of 7.2×10⁵ out of 8×10⁵ were determined (90% viably).
Adipogenic stimulation
Adipogenic stimulation was performed using a normal adipogenic medium (NAM) in comparison to a specific adipogenic medium (SAM). Cells only cultured in CM served as control group. Two thousand five hundred cells/cm2 of each group selected from the second passage (hMSC and hADSC) were seeded into six-well-plates and stimulated with each medium for 21 days. Medium change was carried out every three days. In order to assure effective stimulation, all growth hormones were given constantly over the examined time period.
Normal adipogenic medium
The used basal medium was the previously described (cell harvesting and cell culture) CM supplemented with 500 nM, dexamethasone, 500 µM isobutyl-methylxanthine, 50 µM indomethacin and 0.1 UI/ml insulin (all obtained from Sigma-Aldrich Chemie GmbH) (Table 1).
Adipogenic specific medium (SAM)
DMEM/Ham's F-12 with L-glutamine was the basis for the SAM supplemented with 10% fetal calf serum, 100 IU/ml penicillin, 100 µg/ml streptomycin, 2 mM L-glutamine, 1 mM ascorbate-2-phosphate (all obtained from Biochrom AG). Additionally 2 nM triiodothyrionine, 10 nM hydrocortisone, 500 µM isobutyl-methylxanthine, 500 µM dexamethasone, 1 µM rosiglitazone and 0.15 UI/ml insulin were added for a specific stimulation (all obtained from Sigma-Aldrich Chemie GmbH) (Table 1).
Real-time reverse transcriptase polymerase chain reaction
Real-time reverse transcriptase polymerase chain reaction (RT-PCR) was used to quantify the adipogenic differentiation process shown by specific marker genes: C/EBPα, LPL, GLUT4, PPARγ2, and FABP4. All primers were obtained from Qiagen (Hilden, Germany). Primer sequences kept confidential by Qiagen (Table 2).
The marker gene expression was examined at two exemplary primer points: day 10 and day 21. Glyceraldehyde 3-phosphate dehydrogenase referred as housekeeping gene for each sample. Three independent repetitions had been carried out for each tissue (n=2) per primer (n=3). The ΔΔct-model calculated the measured relative expression level from the real-time RT-PCR.
For RNA extraction the RNeasy Mini Kit (Qiagen) was utilized as described in the manufactures protocol. The followed cDNA synthesis for RT-PCR was also performed by manufactures protocol using the QuantiTect Reverse Transcription Kit (Qiagen) for 1 hour at 42℃ in a reaction mix containing 5 µg total RNA, 1 µl reverse transcriptase Omniscript (4 U/ml; Qiagen), 2 µl RT buffer, 0.2 µl oligo-dT-primer (10 µM), 2 µl dNTPs (5mM), and 1 µl RNase-inhibitor (10 U/ml) adjusted with RNase-free water to a total volume of 20 µl.
For the final real-time PCR process the QuantiTect SYBR Green RT-PCR Kit (Qiagen) was adapted as well by the manufacture protocol using a mixture of 50 ng cDNA, 0.15 µl primer, 2.5 µl SYBR Green, 2.5 µl fluorescein 1.25 µl MgCl2, and 0.1 µl taq-polymerase. Forty-five cycles for each primer were performed and an annealing temperature of 60℃ was used. The relative expression data was directly collected in the Roche Light Cycler 2.0 in combination with the Light Cycler Data Analyse 3.0 Software (both obtained from Roche Diagnostics Deutschland GmbH, Roche Applied Science, Mannheim, Germany).
Oil-Red staining
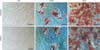
The Oil-Red staining method realized the histological proof at day 21. Oil-Red was prepared with fresh isopropanol in a 3:1 ratio and centrifuged at 1,200 rpm for 5 minutes. The obtained supernatant was diluted with aqua dest. in a 3:2 ratio and subsequently filtered (all obtained from Sigma-Aldrich Chemie GmbH). The solution was again centrifuged at 1,200 rpm for 5 minutes. The cells to be dyed were washed with sterile phosphate-buffered saline for 2 minutes in their wells (Gibco). Then they were fixated with 60% isopropanol solution for 5 minutes and finally incubated with the freshly prepared Oil-Red solution with 2 ml/well for 5 minutes. Photos were taken directly with the Axio MRc5 camera (Carl Zeiss Imaging Solutions GmbH, Jena, Germany) (Fig. 1). Additionally an Oil-Red quantitation was performed. Two fields of view (0.72×1.08 mm in size) were randomly picked in four different wells out of six (n=8). The total number of cells and the number of oil red positive cells were assessed by a hemocytometer. Numbers of oil red positive cells were calculated as a percentage of total cells (Table 3).
Statistics
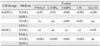
The t test for independent samples evaluated significant differences between NAM and SAM (each group n=3) for every used primer per tissue (n=2) (Table 4). The 95% confidence interval determined the P-value of ≤0.05 as significant. P-value of ≤0.01 and ≤0.001 had been regarded as highly significant. The statistics were calculated using SPSS version 21.0 (SPSS Inc. Chicago, IL, USA). Data were presented as mean±standard deviation (SD).
Results
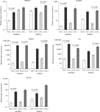
Significant differences were generally measurable between the two growth media in favour of SAM over NAM. All cells (hADSC and hMSC) stimulated by the SAM showed a hundred-fold to hundred thousand-fold increase of the relative expression level (Fig. 2). In contrary to this it has been found that NAM had a weaker influence on the differentiation. It resulted only up to a six hundred-fold increase of the relative expression.
Adipogenic differentiation of hADSCs: SAM vs. NAM
In comparison of the two used growth media for hADSCs only significant differences were detected for SAM over NAM for both primer points.
At the first primer point at day 10 (t1) PPARγ2 showed a significant difference (P≤0.001) for the stimulated hADSCs by SAM compared to hADSCs by NAM. The same results were detectable for C/EBPα (P≤0.01), FABP4 (P≤0.05), LPL (P≤0.001), and GLUT4 (P≤0.001) of stimulated hADSCs by SAM compared to NAM.
At the second primer point at day 21 (t2), there were only measurable significant differences for LPL (P≤0.01) and FABP4 (P≤0.05). LPL's relative expression decreased and FABP4 stayed on a constant level. The marker genes PPARγ2 and GLUT4 showed an increased relative expression compared to primer point one (t1). In contrast C/EBPα showed a constant relative expression. For the PPARγ2, C/EBPα, and GLUT4 marker gene, there were no significant differences detectable between SAM and NAM (P>0.05) (Table 4, Figs. 2, 3).
Adipogenic differentiation of hMSCs: SAM vs. NAM
In comparison of the two used growth media for hMSCs only significant differences were detected for SAM over NAM for both primer points.
At the first primer point after 10 days (t1), only a significant difference was detected for the GLUT4 marker gene (P≤0.05). PPARγ2, C/EBPα, LPL, and FABP4 showed no significant activity between SAM and NAM (P>0.05).
At the second primer point after 21 days (t2), multiple significant differences were observed for PPARγ2 (P≤0.05), C/EBPα (P<0.001), FABP4 (P≤0.01), LPL (P≤0.001), and for GLUT4 (P≤0.05). All marker genes for hMSCs stimulated by SAM showed an increase in their relative expression level compared to the first primer point (t1) (Table 4, Figs. 2, 3).
Comparison between hMSCs and hADSCs
In order to show that hMSCs had the potential for adipogenic stimulation, we also compared the two tissues with each other for each growth media. The NAM was more capable of an enhanced stimulation of hMSCs than of hADSCs. Significant differences showed that PPARγ2 (t1, P≤0.05), LPL (t2, P≤0.01), FABP4 (t2, P≤0.05), and C/EBPα (t1, P≤0.01) were more up regulated in the presence of hMSCs rather than hADSCs. hADSCs were only significant to hMSCs in the NAM at the second primer point PPARγ2 (t2, P≤0.05).
The analysis of the SAM showed that hMSCs were able to keep up with hADSCs, expressed by the markers gene PPARγ2 (t1, P≤0.05), LPL (t2, P≤0.01), FABP4 (t2, P≤0.05), and GLUT4 (t2, P≤0.05). In the contrary, hADSCs displayed their dominant stimulation potential only for the first primer point (t1). hADSCs showed significant differences over hMSCs for the markers gene LPL (t1, P≤0.001), GLUT4 (t1, P≤0.05), FABP4 (t1, P≤0.01), and C/EBPα (t1, P≤0.05).
Oil-Red staining
Histological staining was performed with Oil-Red and photographed (×20 magnification with Axio MRc5 camera) after 21 days. No lipid granules detected in the normal CM. Visible lipid granules found in the NAM. Stronger staining of lipid granules within the cells stimulated by the SAM. Cells assumed a more likely shape of preadipocytes in SAM for hADSCs and hMSCs. hADSCs seemed to be more responsive in development and quantity, but differentiated hMSCs into preadipocytes were detectable in the staining process (Fig. 1). Staining after 10 days showed only occasionally a few cells with lipid granules. It can be assumed that the cells were still developing and had not yet the quantity of detected lipid granules like at day 21 (data not shown for staining after 10 days). The quantitation of Oil-Red showed significant differences (P<0.05) between the influence of NAM and SAM. SAM showed for both cell populations a two to four times significant increase towards NAM for the percentage of available oil red granules (Table 3).
Discussion
In this study, it had been demonstrated that the SAM is superior to the NAM. Also SAM is capable to stimulate other cell lineages like hMSCs to develop into preadipocytes in contrast to former solitary hADSC stimulation [15]. These findings show a similarity with the results of Sekiya et al. [11]. They demonstrated that hMSCs are a valuable and equal cell source to differentiate into preadipocytes stimulated by NAM.
As already stated in the results, the cells stimulated by SAM achieved a much higher relative expression level than stimulated by NAM. The relative expression level was highly up regulated by SAM, unlike to former experiments with similar growth hormones [14], which proofed adipogenic differentiation but not to that extinct observed in this study.
Based on our comparison of possible cell differentiation, NAM had a greater influence on hMSC than on hADSC, but SAM had an overall influence on both cell lineages. Caprio et al. [23] described the only usage of corticoids like dexamethasone in longer-term differentiation could inhibit adipocytes terminal maturation, which was observed with NAM influence on hADSCs compared to hMSCs. On the other hand, this effect was not found in the cell stimulation with SAM. It seems like corticoids induce adipogenic differentiation and in combination with other stimulants like thyroid hormone (T3) and rosiglitazone. They lead to a further development of the cell in the long run. Preadipocytes found in hADSCs or in vitro developed preadipocytes from other cell lineages imply to integrated T3 and rosiglitazone directly into their pathway system and enhance thereby their differentiation potential for a sufficient adipogenesis [1620].
As mentioned above, especially marker gene PPARγ2 and C/EBPα were highly up regulated by the stimulation with SAM. They showed significant differences towards NAM at day 10 for hADSCs and at day 21 for hMSCs. It could be considered that the two examined cell lineages showed each an advanced stage of adipogenesis at the exemplary primer points, where C/EBPα and PPARγ2 were expressed simultaneously. It is reported that these genes are the key transcriptional regulators of adipocyte differentiation [24]. PPARγ2 and C/EBPα promote their own expression through interaction and trigger other downstream target genes, which determine the cell as an adipocyte [25]. Only for SAM PPARγ2 was constantly up regulated followed by C/EBPα. However, for NAM PPARγ2 showed irregular regulation of its gene expression followed in the same way by C/EBPα. Only when PPARγ2 is expressed, adipogenesis takes place. C/EBPα alone can not start any adipogenic differentiation [26].
Marker gene FABP4 was expressed at a high level for SAM for the overall examination period and at a normal level for NAM. This observation demonstrates the available amount of cytosolic FABP in the cell [27]. FABP4 is considered to be a critical link between lipid metabolism, hormone action and cellular functions in adipocytes [28].
The same circumstance was observed for the marker gene lipoprotein lipase (LPL), which illustrates the adipocyte metabolism during differentiation [29].
The last examined marker gene GLUT4 showed a constant activity of relative expression for both cell lineages stimulated by SAM. Only hMSC stimulated by NAM showed a minimal activity of relative expression for GLUT4. GLUT4 is activated and built into the plasma membrane randomly by insulin for an increased glucose uptake [30]. This effect is enhanced by rosiglitazone [31]. The GLUT4 relative expression increases only slowly to a higher level towards the second primer point, but not in the way observed for the other marker genes. It can be considered that due to the random insertion of GLUT4 a saturation of the transporter is reached at a stable stage [30], but resulting from a constant development of the cells into preadipocytes, a simultaneous increase of GLUT4 is observed for both stimulated cell lineages by SAM.
Apparently, in our study, hADSCs start to develop earlier into preadipocytes due to an already available amount of preadipocytes [32], which seem to respond faster to stimulation. On the contrary hMSCs needed more time for development, but showed at the end of the examination an equal ability to develop into preadipocytes [1133].
In conclusion, this study demonstrates the ability of hADSCs and hMSCs to transform into preadipocytes on a molecular biological and histological level. The SAM offers a more profound and superior adipogenic cell stimulation in comparison to the NAM.
We recommend to establish SAM as a new standard medium for in vitro adipogenic differentiation and to test it on other different cell lineages. Additionally further exploration work is required to characterize the specific stage of development of the cultured preadipocytes and to examine the lifetime beyond 21 days and their in vivo viability.


 XML Download