

 PDF
PDF ePub
ePub Citation
 Print
Print


INTRODUCTION
Sex determination is an important step in biological identification from skeletal remains, especially in forensic circumstances as it can narrow down the possibility of identification of 50% of sexes [12]. Several studies on sex determination were based on biological differences between males and females. Males are generally much larger in term of size and body proportion than females because males have normally more muscle mass [234]. Generally, there are two osteological methods in determining the sex of an individual: morphological and metric methods. For morphological method, pelvis is the best part of skeleton to determine the sex (95%), followed by skull (92%) [56]. Another, this method is subjective and requires high experience. Therefore, another technique, metric method is more objective and precise which can scientifically displays results of analysis when presented in a courtroom [7]. Various metric studies on sex determination in many parts of skeleton have been investigated [8910]. There are substantial literatures describing sex determination by craniometric method in various regions [11121314151617181920212223]. Several studies reported significant difference in size of skull between populations and therefore all discriminant function equation for sex determination, derived from discriminant analysis were population-specific [1113141516]. However, studies of sex determination in a Thai skull were few. Sangvichien et al. [19] studied 101 dried skulls (66 males and 35 females) which belonged to individuals from the central region of Thailand. They conducted 30 cranial measurements and 14 indices and then sex determination equation was developed by multivariate statistical method. Percentage accuracies derived from this equation were 92.1% for male and 82.9% for female. They explained low accuracy in females smaller sample size. Similar study was carried out in North-Eastern region using computed tomography technique [21]. All measurements in their study were significantly larger for male skulls as compared with female skulls. They also suggested that there were some differences in skull's size in different region by comparing with the study of Sangvichien et al. [19]. Craniometric study for sex determination in North region is seldom reported. Thus, the present study aimed to investigate craniometric study on sexual dimorphism between males and females' skull in Northern region of Thailand and develop discriminant function equations for sex determination in a Thai population.
MATERIALS AND METHODS
The present study was conducted on 200 Thai dried skulls of known sex, and age at death for 100 males and 100 females from the Forensic Osteology Research Center (FORC) in the Faculty of Medicine at Chiang Mai University. For males age ranges from 36 to 96 years, and the mean age was 65.65 years. For females age ranges from 15 to 93 years, and the mean age was 66.81 years. The fractured, pathological, or deformed skulls were excluded from the study.
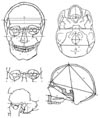
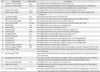
The description of all 25 measurements of the skull using either sliding calipers, or spreading calipers was given in Table 1. Each measurement was taken three times non-consecutively, and recorded as the average of these three times of each measurement for each individual.
Measurements 1-21 were taken according to the standards described by Buikstra and Ubelaker [24] (Fig. 1). Three measurements (22, 24, and 25) were described by Jorgensen [25] which derived from Martin's work [26]. Measurement 23 followed the procedures described by Dayal et al. [20] and the bony landmarks are originally from Martin [26].
Data analysis
The data were analyzed using the SPSS version 20 (SPSS Inc., Chicago, IL, USA). Descriptive statistics with means and standard deviations computed for each measurement in both sexes. Then, Student's t test was used to compare the means between male and female for each measurement. Sexual dimorphism index (SDI) was calculated as the mean value of male divided by the mean value of female for each measurement [23]. Discriminant function analysis was performed by using the direct and stepwise methods, which performed to calculate the function formula for all considered variables (direct method) and selected variable by calculation (stepwise method). The percentage accuracies of the functions were evaluated by leave-one-out-cross-validation method.
RESULTS
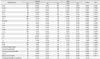
The descriptive statistics with means and standard deviations for the 25 measurements of both males and females were tabulated (Table 2). The results showed that all the measurements were statistically significantly different (P< 0.05) between males and females except a minimum breadth of the nasal bone.
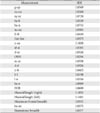
SDI for each measurement was calculated. The median of SDI for 24 measurements (except a minimum breadth of nasal bone) was 1.0534. If the value was less than 1.0534, it indicated a relatively low level of sexual difference; greater than the median, it indicated a high level of sexual difference. Table 3 showed the 12 measurements with high level of sexual difference. These were maximum cranial length, bizygomatic breadth, cranial base length, biauricular breadth, upper facial breadth, nasal height, biorbital breadth, foramen magnum length, foramen magnum breadth, mastoid length (right), mastoid length (left), and basion-nasospinale length. These measurements were then used in discriminant analysis.
The result of direct discriminant analysis using 12 variables was tabulated (Table 4). The discriminant score is calculated by multiplying the unstandardized coefficient with each particular measurement, summing them and then adding the constant, as follows.
Discriminant score=(0.498×g-op)+(2.382×zy-zy)+(0.244×ba-n)+(-1.103×au-au)+(-0.071×fmt-fmt)+(1.238×n-ns)+(-1.050×ec-ec)+(0.787×ba-o)+(0.132×FOB)+(0.625×right mastoid length)+(0.691×left mastoid length)+(0.329×ba-ns)+(-33.422)
After calculating discriminant score, it was compared to sectioning point, 0.026 which is halfway between the female and male centroids. A score greater than 0.026, signified males, whereas a score less than 0.026, signified females.
Table 5 showed the percentage accuracy for sex determination of the discriminant function derived from 12 variables in the direct method. There was 91.4% of original grouped cases correctly classified and 87.7% of cross-validated grouped cases correctly classified.
A stepwise discriminant analysis was performed by classifying between two or more groups. The result of stepwise discriminant analysis of using the 6 variables was given in Table 6. The discriminant score was calculated as:
Discriminant score=(0.625×g-op)+(2.568×zy-zy)+(-1.188×au-au)+(1.497×n-ns)+(-0.928×ec-ec)+(1.150×right mastoid length)+(-31.159).
Table 7 showed the sex prediction accuracy of the equation using the 6 variables in the stepwise method. There was 91.7% of original grouped cases correctly classified and 90.6% of cross-validated grouped cases correctly classified.
DISCUSSION
Various measurements can be undertaken from cranium. However, these enormous parameters are not valid for sex determination in practice. Forensic anthropologists or osteologists cannot examine all of approximately 5,000 cranial measurements in their circumstance [27]. Twenty-five measurement variables were selected for this study according to standard measurements and previous literatures [20242526]. In addition, during a process of statistical analysis, 25 cranial measurements data from 200 samples was selected again by two statistical approaches, univariate and multivariate statistical analysis. The former was independent t test and SDI while the latter one was discriminant analysis.
The measurements, examined in this study, were selected according to standard measurements as described in materials and methods section. These were also in most previous studies including a study in Thai [1921]. On the other hand, basion-prosthion length, maxilla-alveolar length, and upper facial height were excluded from original 28 measurements according to an inability to obtain precise landmark of prosthion because of damage and socket resorption at alveolar process of maxilla which usually presented in old skeletal samples that were the majority of this osteological collection. While these three measurements were difficult to practically examine, they were one of the valuable parameters for discriminating sexes in previous studies [1827].
According to criterions of discriminant analysis, a sample size with all cases provide complete measurements should be 5-10 times than a number of independent variables, the data was computed by univariate analysis to select some measurements from all 25 parameters. Firstly, independent sample t-test was analyzed to determine a difference between male and female of each variable. Only the significant sex different variables were then calculated for SDI. Considering SDI, the parameters which had this value higher than median of SDI were chosen to further analyze by discriminant analysis. Both independent t test and sexual dimorphism help in reducing variable by selecting only the variables which highly expressed sexual dimorphism. These variables were mastoid length (right), mastoid length (left), nasal height, foramen magnum length, cranial base length, bizygomatic breadth, foramen magnum breadth, biauricular breadth, upper facial breadth, basion-nasospinale length, maximum cranial length and biorbital breadth. A sample size which was able to obtain these particular 12 measurements was 166 cases that were compatible with criteria for using discriminant analysis.
From the result of independent t test (Table 2), it revealed strong sexual dimorphism in most cranial measurement variables, considered in the present study. All 25 variables were statistically significantly different between male and female except for minimum breadth of nasal bones. These were consistent with most studies in various populations [17181920]. The study of Franklin et al. [18] also statistically significantly presented sex difference in all variables. Consequently, the current result was also similar to Sanvichien's study, which most cranial measurements (30 measurements and 14 indices) were statistically significantly sexual different, except for six measurements [19]. These suggested that these t test's outcome was evidence that cranium express great sexual dimorphism in the population [18].
The presence of strong sexual dimorphism of variables considered in this study was supported by the result of SDI. The ratios of male/female were greater than one for all variables. It indicated that size of male's cranium were larger than that of female in all dimensions [18].
According to discriminant analysis, the results were comparable to various studies in term of variable for creating equation and sex prediction accuracy.
Considering the variables selected to develop the equation, derived from stepwise method, only six variables; maximum cranial length, bizygomatic breadth, biauricular breadth, nasal height, maximum biorbital breadth, and mastoid length (right), were selected. These less number of variables were practical and helpful when forensic examiners or osteologists have to deal with fragmentary skull because it might be difficult to include a large number of variables to determine the equation in this situation [16]. The equations provided by less number of variables, approximately four to eight variables, were also derived from the studies in South African [1820]. Furthermore, consider only one variable, bizygomatic breadth was also provided an equation with high accuracy (84.3%) from this study. So, if bizygomatic breadth is the only one measurement that can be examined, an obtained accuracy is still in an acceptable range. In addition, it was found that two of the six measurements from this study: maximum cranial length and bizygomatic breadth were consistent with previous studies [171819202223] as the cranial measurements which had strong sex discriminating power. These measurements were also two of the most sexually dimorphic variables for creating the equation in the earlier study in Thais [19] which supported and re-emphasized that they were the most powerful cranial variables for metric sex determination in this population.
According to discriminant analysis, percentage accuracies obtained from both direct and stepwise methods were distinctly high (88.0%-92.2%) when compared with previous studies from various regions. From the study of Giles and Elliot [11] on the sample of American white and Negro crania, their discriminant equations provided 82%-89% accuracy. Even though using different sources of data from traditional anthropometry, Forensic Databank, the accuracies obtained were 78% and 82.7% from the studies of Spradley and Jantz [22] and Konigsberg et al. [28], respectively. Apart from American samples, equation derived from Northern Indian gave 85.5% accuracy from direct discriminant analysis [23]. In addition, utilizing modern technique, geometric morphometric method, with South East Asian samples expressed similar accuracy (86.8%) to the earlier work from Indian [29]. Furthermore, Hanihara [13] determined Japanese skulls and applied discriminant analysis which provided 89.7% accuracy. For South Africa region, there were several studies on cranium which gave the accuracies ranged between 80%-86% [171820]. Beside from this region, Kajanoja's work [14] provided 79.5% accuracy equation derived from Finnish sample.
From the result of discriminant analysis (Tables 57), the accuracies derived from this study were greater than 90.0% in both direct and stepwise methods. The highest accuracy was obtained from stepwise discriminant analysis which was 90.6% for overall accuracy with 90.0% for male and 91.1% for female. They were quite high and reliable because of a little difference between male and female prediction accuracy. In contrast with the study by Sangvichien et al. [19], the accuracies obtained from multivariate analysis had much larger difference between sexes (92.1% for male and 82.9% for female) than the present study. It was probably caused by their female samples which may compose of some extreme size of females' skull closed to male's size. These might cause the low accuracy for predicting female skull. On the other hand, there was greatly high percentage accuracy in predicting male from both studies. It might indicate that Thai male skull express obvious sexual dimorphism by using osteometric technique. It might suggest that sex determination from skull by osteometry was suitable for predicting Thai male with high accuracy. These also strongly express evidence that craniometric technique reveal more enormous precise, reliability, and confidence in sex determination than cranio-morphological method. In addition, the study of Thai skull in 2007 [19] had similar variable, bizygomatic breadth, which was selected to create the equation of this study. These variables also displayed great sexual dimorphism and were one of the most sexually dimorphic variables for developing equations in various studies as mentioned earlier. However, there were some different variables selecting for producing the equation in both studies. It indicated that variation in size of skull might present in different region. This was also supported by data of cranial measurements that most dimensions were longer or broader in Sangvichien et al.' study [19] than the present one except for measurements in orbit and nose, frontal bone, and foramen magnum. This was consistent with the study in North East region where all measurements were smaller than that of Sangvichien's study [21]. This was strong evidence that the differences in cranium size did exist in different regions. Furthermore, biorbital breadth, orbital measurement, also strongly contributed to produce the equation for the present study, in contrast with Sangvichien's which these measurements were not. These suggested that different sexually dimorphic variables in different region might effect in sex discriminate equation [30].
As mentioned above, this study provided the efficient equation for sex determination from Thai skull, especially when the forensic osteologists have to deal with fragmentary cranium found in forensic situation. The equation requires only six cranial measurements which can be seen from the function below:
Discriminant score=(0.625×g-op)+(2.568×zy-zy)+(-1.188×au-au)+(1.497×n-ns)+(-0.928×ec-ec)+ (1.150×right mastoid length)+(-31.159).
When these six cranial measurements were examined, then multiply each obtained value with its coefficient and sum the outcomes from each variable together. Finally add the last value which is the function coefficient (-31.159). The obtained result of the calculation is called a discriminant score. Compare this score with the sectioning point (0.026). If a score is more than this sectioning point, the skull belonged to a male, whereas a score is less than this sectioning point, the skull belonged to a female. The percentage accuracies obtained from this estimation were 91.1 for male and 90.0 for female.
Craniometric study for sex determination from the present study can be much valuable in biological identification in a Thai population when only skull was found in forensic circumstance. The study revealed that all cranial measurements (25 variables), considered in this study, which represented cranial size were statistically significantly larger in male than female (P<0.05) except for minimum breadth of nasal bone. This strongly re-emphasized the previous works that there were some differences between male's and female's cranium in that of male was greater in size than the other. Beside this, sexual dimorphism indices also showed relatively high value of male/female ratio. These evidences indicated that there was significant sexual dimorphism between male's and female's cranium in this Thai population. The most 12 powerful sexually dimorphic variables were used in discriminant analysis for sex determination. The accuracies obtained from sex determination equations were higher than 90% for both direct and stepwise methods. For stepwise method, the equation, required only six variables was developed. It gave relatively high percentage accuracy with less required cranial measurements. This provided equation can be valuably applied in biological identification among Thai population, especially when fragmented skull was found in forensic cases. In addition, there were some differences in cranial size between different regions of Thailand. It might be a limitation of this study that the collected samples were skulls belonged to 200 individuals which might not represent Thai population. Further research needs to be studied in terms of collecting more samples which will be useful in getting more precise and accurate sex prediction for Thai population.


 XML Download