

 PDF
PDF ePub
ePub Citation
 Print
Print


Introduction
The demonstration of adult mammalian neural stem cells (NSCs) in the 1990s [1, 2, 3] confirmed the suspicions of previous investigators, that sustained cell genesis in the adult central nervous system (CNS) was due to the existence of a CNS stem cell [4, 5, 6, 7, 8, 9, 10, 11, 12]. The original isolation and expansion of NSCs used a tissue culture method that deviated from other protocols. First, the growth medium was defined (i.e., serum-free) and second no substrate (i.e., poly-L-ornithine or laminin) was provided. Instead, cells were cultured on tissue culture plastic. The addition of epidermal growth factor (EGF) stimulated the proliferation of precursor cells (NSCs and progenitor cells) resulting in the formation of clonal spheres, referred to as neurospheres. The neurospheres could be serially passage resulting in an arithmetic increase in the total number of cells generated over time. This culture methodology is referred to as the neurosphere assay and is a well accepted in vitro approach to isolating and expanding NSCs.
While useful for the maintenance and study of somatic stem cells, the neurosphere assay has subsequently been used to isolate and expand tumor cells [13, 14, 15, 16, 17]. Based on the pioneering work of the Dick lab and their characterization of a stem-like cell driving proliferation of acute myeloid leukemia [18], the origin, maintenance, and resistance of solid tissue malignancies, including malignant gliomas, are attributed to transformed precursors that have the cardinal properties of stem cells [19, 20]. A body of evidence now exists suggesting that brain tumors contain this sub-population of tumor-initiating cells (TICs) that exhibit stem cell characteristics [13, 14, 20, 21]. Moreover, this literature suggests that this population may be responsible for treatment resistance [22, 23, 24], and targeting this population may be an important therapeutic strategy in treating patients with brain tumors [20, 25]. Therefore, studying malignant glioma in culture requires the culture conditions to maintain the TICs that are hypothesized to drive tumor growth, as well as preserve the genetic and phenotypic properties of these cells. Only with these criteria can cell culture results be relevant for patients with glioblastoma multiforme (GBM).
Given the potential similarity between somatic NSCs and cancer-like stem cells or TICs, Ignatova et al. [21] were the first to use the neurosphere assay (NSA) to isolate and expand cells from adult human brain tumors. This was quickly followed by detailed reports further characterizing the stem cell properties of a sub-population of cells within human brain tumors and their ability to initiate tumor formation in vivo [13, 14] and has rapidly become the standard for identifying and maintaining brain TICs in culture [26]. One of the reasons for the broad acceptance of this methodology is the retention of the primary tumor's phenotype following culture and xenografting into a murine model [13, 27]. In addition, brain TICs have been found to be more representative of the original tumor genetically when grown in the NSA compared to serum conditions even after serial passage in vitro [27, 28].
However, this assay has notable limitations such as variable composition of cells and overestimation of the proportion of NSCs. First, the NSA can produce variable composition of cell types depending on the media [29], frequency of passaging and whether dissociation is performed before cell differentiation [30]. Moreover, the assay can overestimate the number of stem cells [31]. A 1:1 relationship between stem cell and neurosphere does not exist and the NSA overestimates the proportion of NSCs (usually <5% of the overall NSA population) by an order of magnitude [31]. Additionally, neurospheres are not always clonal since they are mobile and can merge with one another [32].
To overcome these limitations, modifications to the NSA have been proposed. The colony-forming assay is a semisolid culture with collagen that has been described to prevent the migration and fusion of mouse NSC spheres [33]. Only cells from the large colonies (>2 mm) demonstrated stem cell characteristics and the capability for long-term self-renewal (>7 passages) [33]. Similarly with human brain TICs, the NSA has been supplemented with methylcellulose in an attempt to decrease sphere motility [21]. Recently, serum free culture conditions supplemented with laminin have been described to grow NSC as a monolayer [34, 35, 36, 37]. These techniques were extended to brain TICs with an extracellular matrix [38] and subsequently laminin [39]. Some of these data suggest that establishing cell lines from human gliomas is more efficient when the cells are grown as a monolayer and that the NSA is inferior to adherent culture methods in terms of higher percentages of apoptosis and differentiation potential of cells [39]. To further investigate this hypothesis we quantitatively compared GBM cells grown in NSA to cells grown in adherent/laminin conditions with respect to their respective phenotypic, genetic and functional characteristics.
Materials and Methods
Tissue culture
With Institutional Review Board (IRB) at the University of Florida approval and written patient consent, fresh brain tumor samples were obtained at the time of surgical excision from adult patients after obtaining informed consent. GBM tumor samples were dissociated into single cells using trypsin and cultured in the NSA at a cell density of 100,000 to 200,000 cells/ml. These samples were established as cell lines by undergoing long-term propagation (>10 passages) in NSA growth media and were subsequently used for NSA versus adherent culture comparisons.
The NSA growth media included human NSC basal medium containing human NeuroCult proliferation supplement (Stem Cell Technologies, Vancouver, BC, Canada) with 20 ng/ml EGF (R&D Systems, Minneapolis, MN, USA), 10 ng/ml basic fibroblast growth factor (R&D Systems) and 2 µg/ml heparin (Sigma, St. Louis, MO, USA). Cultures were grown in T25 flasks. The adherent culture required coating of flasks with laminin (diluted 1:10 in NSC medium, Invitrogen, Carlsbad, CA, USA) for at least 3 hours at 37℃ with 5% CO2. The same medium was used for the adherent and NSA culture conditions. The NSA cells were grown until formation of 100-µm spheres to avoid problems with cell differentiation, death and cellular attachment associated with larger spheres. The adherent cells were grown until cells were confluent per previously described protocol [39]. For passage of cells, the cells were dissociated with 0.05% trypsin-EDTA (Gibco, Grand Island, NY, USA) for 2 minutes at 37℃, counted and re-plated at a density of 50,000 cells/ml. Cells were stained with 0.04% trypan blue at the time of counting to identify dead cells (trypan blue +). These cells were counted and the percentage of dead cells was calculated for each growth condition at the time of each passage. These values were compared using the Student's t test and a P-value of ≤0.05 was considered significant.
Additionally, the fold expansion at each passage was compared between NSA and the laminin growth conditions. The difference was compared to zero using the Student's t test and P-values were calculated. A P-value of ≤0.05 was considered significant.
Flow cytometry
For apoptosis assays, live cells were evaluated for caspase 3 (1:300, Calbiochem, San Diego, CA, USA), annexin V (1:100, Invitrogen), 1,1',3,3,3',3'-hexamethylindodicarbo-cyanine iodide (DiIC; 1:1,000, Invitrogen), propidium iodide (PI; 1:1,000, Sigma), and 4',6-diamidino-2-phenylindole (DAPI; 1:2,000, Invitrogen). For fixed cells, analysis with caspase 3 (1:1,000, BD, San Diego, CA, USA) was performed with cells fixed with 90% methanol at 20℃ for 15 minutes. For comparison of neurosphere and adherent culture systems, three primary GBM cultures (GB:A1, GB:A2, GB:A3) were evaluated in triplicate for expression of EphA3 (in-house mAb 5 µg/ml, IIIA4), epidermal growth factor receptor (EGFR; in-house mAb 5 µg/ml, 528), EGFRvIII (in-house mAb 5 µg/ml, 806), platelet-derived growth factor receptor α (1:50, R&D Systems), c-Met (LMH-85, in-house mAb 5 µg/ml), HER2 (1:100, Herceptin), CD15 (1:100, BD), CD44 (5 µg/ml, Hermes 3), CD133 (1:10, Miltenyi Biotech, Auburn, CA, USA), CD49f (1:50, Millipore, Billerica, MA, USA), Mcl-1 (1:100, Santa Cruz Biotechnology, Santa Cruz, CA, USA) and IL13Ra2 (in-house mAb 5 µg/ml, Ab12). IgG1 (1:400, BD) was used an isotype control.
The GBM cell lines were maintained in NSA and adherent culture conditions. The cells were fixed and stained with antibodies against differentiation and proliferative markers. Flow cytometry was performed and percent cell staining and geometric mean were measured. Nestin (1:1,000, Chemicon, Temecula, CA, USA), glial fibrillary acidic protein (GFAP; 1:2,000, BD), beta tubulin III (1:2,000, Promega, Madison, WI, USA), MCM2 (1:500, Santa Cruz Biotechnology), and Ki67 (1:750, Invitrogen) were used for analysis of differentiation. Flow cytometry was performed using the LSR II (BD). Flow cytometry analysis was performed with Flow Jo (Treestar Inc., San Carlos, CA, USA). The percent cells positive and geometric mean values are reported as mean±standard error. The values were compared using the Student's t test and computing P-values.
Limiting dilution analysis
Cells were grown in 96-well plates coated with laminin with dilutions of 1-10 cells/well. The wells that became confluent or close to confluent were considered to have clonogenic cells. For the NSA, cells were plated and wells were evaluated for number of neurospheres at least 100 µm in size (sphere forming frequency). The confluency and size requirements were to ensure determination of true stem-like cells as opposed to progenitor cells with limited proliferative capability [33].
The percent of empty wells (with less than 75% growth for laminin and number of wells with spheres less than the total number of cells plated) were enumerated and the negative log (-log) of the proportion of negative wells was calculated for each cell density. This result was plotted to determine the clonal frequency of the adherent culture conditions using the extreme limiting dilution analysis software [40]. The clonal frequency of the NSA was compared to the adherent cultures using a Mann-Whitney test. These data are reported as a mean with standard error.
RNA isolation and whole genome expression analysis
GBM cells were grown in the NSA (n=6) or adherent (n=6, representing two cell lines and technical replicates of the experiments) culture conditions, dissociated into single cell suspension and then snap frozen using liquid nitrogen. Total RNA was isolated using RNeasy kit (Qiagen, Valencia, CA, USA) according to manufacturer's protocol with an oncolumn DNase digestion. RNA quality and quantity were assessed using 2100 Bioanalyzer (Agilent Technologies, Santa Clara, CA, USA) and NanoDrop (Thermo Scientific, Waltham, MA, USA), respectively. For microarray sample processing, 150 ng of total RNA was used to generate singlestranded DNA for hybridization to Human Gene 1.0 ST arrays (Affymetrix, Santa Clara, CA, USA) following manufacturer's protocol. Affymetrix analysis was performed using 28,830 probes. The probe level intensity was analyzed for quality and normalized. Linear model-based limma software was used to evaluate differences between genetic expression in the NSA and adherent GBM cells [41].
Xenotransplantation
All animal work was approved by the Institutional Animal Care and Use Committee (IACUC) at the University of Florida. Non-obese diabetic/severe combined immunodeficient (NOD/SCID) female mice 8-10 weeks of age were anesthetized and received a flank subcutaneous injection of 1×10⁶ cultured L0 GBM cells in 200 µl of medium and 100 µl of Matrigel (BD). The cells had been passaged in either NSA or adherent conditions for at least 5 passages prior to xenotransplantation. The animals were divided into two equal groups based on receipt of cells from NSA (n=5) or those from adherent culture (n=5). The animals were monitored for tumor growth and were euthanized once tumors reached 1.5 cm in size. A Kaplan-Meier survival analysis was performed, ratio generated for the NSA and laminin group, and the 95% confidence interval (CI) reported to determine the relationship between type of tumor cell culture and period of survival.
Results
In vitro functional analysis
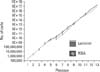
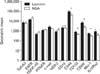
After establishing GBM cell lines using the NSA, cells were cultured using either the NSA or adherent conditions. Changes in cell growth measured by the neurosphere assay have been shown to reflect changes in the TIC compartment [42]. GBM tumor neurosphere formation in culture has been found to correlate with poorer patient outcomes [43]. Moreover, the rate of GBM tumor cell growth in culture (cellular fold expansion) has been associated with disease progression [44]. For example, forcing GBM TICs to differentiate has been shown to significantly reduce cell growth in vitro and in vivo [44]. Therefore, the first comparison between the NSA and laminin culture conditions was cellular fold expansion over time.
The cells were passaged every 4-10 days depending on the cell line. The NSA and laminin cells were passaged simultaneously for each line for fair comparison (n=4 in each group representing biological replicates of different cell lines). Cells were counted at every passage by enumerating plated dissociated cells in solution, and expansion curves for the NSA and adherent culture conditions were not different (Student's t test, P=0.24) (Fig 1). These results demonstrate that the expansion of cell lines is equivalent between the two culture techniques over time.
Since specific and exclusive reliable molecular or cellular markers of neural or TICs do not exist, these cells were defined with functional criteria. Included in these criteria is clonogenic capacity, or the ability of one founder cell to create a colony consisting of TICs and more differentiated cells. The clonal frequency of GBM cells was tested in vitro with the limiting dilution assay [40]. For the adherent culture, cells were grown in 96 well plates coated with laminin with dilutions of 1-10 cells/well. The wells that at least 75% confluent were considered to have clonogenic cells. For the NSA, cells were also grown in 96-well plates. Wells with clonogenic cells were considered to be those where the number of neurospheres was equal to or greater than the number of cells plated. Using a standard calculation for clonogenic frequency [40] (by taking the negative log of the proportion of empty wells) the clonal frequency was generated for each condition. For adherent cultures the clonal frequency was 5.2% or 1 cell out of 16.4 to 22.2 cells, compared to 4.5% or 1 cell out of 16.6 to 27.4 cells for the NSA (P=0.9, n=7 each group representing two different cell lines and technical replicates of the experiments) (Electronic Supplementary Fig. 1). These results are similar to the reported clonal frequency of GBM cell lines grown in the NSA [13, 45]. Therefore, GBM cells do not demonstrate a difference in clonogenic capacity, a functional stem cell quality, when grown in the NSA compared to laminin culture conditions.
Phenotypic analysis
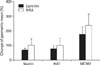
To further support proliferative profile similarities between NSA and laminin assays we compared the expression of markers such as Nestin, Ki67, and MCM2. The cells were fixed and stained with antibodies against Nestin, Ki67, and MCM2. The NSA and adherent cells had no significant differences in Nestin (P=0.52), Ki67 (P=0.22), or MCM2 (P=0.51) (Electronic Supplementary Figs. 2, 3). The figures depict percent change of the geometric mean of stained cells compared to unstained cells (Fig. 2).
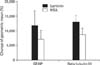
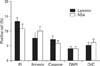
GBM TICs are also characterized by being relatively undifferentiated, similar to somatic stem cells. Hence, to evaluate the ability to maintain multipotency in each growth condition, expression of differentiation markers was tested. Cells were tested for GFAP (astrocytic differentiaton) and beta tubulin III (neuronal differentiation) (Electronic Supplementary Figs. 2, 3) [21]. The geometric mean of the laminin grown cells is shown as a percentage of the geometric mean of the NSA grown cells. No statistically significant difference was found in differentiation markers GFAP (P=0.44) or beta tubulin III (P=0.18) between NSA and laminin cells (Fig. 3).
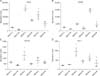
Next, the cells from three different lines were tested for expression of markers known to be expressed in TIC. Four proteins were found to be significantly up regulated in the laminin culture conditions: (1) CD44, (2) CD133, (3) CD49f, and (4) Mcl-1 (Fig. 4). These proteins were investigated due to correlation with GBM prognosis (CD44) [46], marker of GBM stem-like cells (CD133) [14], marker of stem-like cells in other types of cancer (CD49) [47] and marker of apoptotic dysregulation in GBM cells (Mcl-1) [48, 49]. However, the up regulation was not seen in all lines tested. In GB:A1, no changes in any of the proteins were seen; while GB:A3 saw an up regulation of CD44 and CD49f. Up regulation of the 4 proteins was seen in the GB:A2 line. Overall, no consistent changes in protein expression were seen among the three lines tested; however, a few individual differences were identified (Fig. 5).
Altogether, GBM cells grown in the NSA and laminin growth conditions did not demonstrate differences in proportion of stem-like TICs based on proliferative and differentiation marker expression.
Apoptosis
Previous studies demonstrated increased apoptosis in cells grown with the NSA compared to cells grown in adherent conditions [38, 39]. However, cell death is a heterogeneous process involving multiple and sometimes overlapping pathways [50]. Therefore, we used multiple apoptosis assays to quantify the difference in cell dying and death between cells in the NSA and laminin growth conditions.
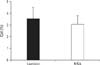
Cell death was measured at the time of passage by counting the number of cells positive for trypan blue during the cell counts. Cell death between the two groups was the same (Student's t test, P=0.7, n=9 representing two cell lines and technical replicates of the experiments) (Fig. 6). Cells were also analyzed for markers of death, late and early phases of apoptosis. Initially dead cells were identified using either PI or DAPI to stain cells with compromised cell membranes [51, 52]. Similar to the trypan blue data, no statistical difference was found between NSA or laminin cells in PI (P=0.27) (Electronic Supplementary Fig. 4) or DAPI staining (P=0.93) (Electronic Supplementary Fig. 5).
Subsequently, late, mid and early markers of apoptosis were tested. Annexin V, a marker of late apoptosis, binds phosphatidylserine which is normally confined to the inner plasma membrane, but becomes exposed with apoptosis [53]. Percentage of cells expressing annexin V in laminin cells was 7.6±1.8% compared to 10.1±1.5% in NSA cells (P=0.32) (Electronic Supplementary Fig. 6).
The annexin V cell experiments were followed by testing for activated caspase 3 (activated death protease that catalyzes the cleavage of key cellular proteins [54, 55, 56] expression in live and fixed cells. Using a caspase 3 inhibitor conjugated to a fluorochrome (PE), activated caspase 3 was quantified in live cells. The staining was equivalent between NSA (5.9±1.0%) and laminin cells (7.2±1.2%, P=0.41) (Electronic Supplementary Fig. 7A-D). Conversely, measuring the amount of antibody staining activated caspase 3 in fixed cells, the laminin cultured cells demonstrated a trend for increased immunoreactivity (4.4±0.6%) when compared to NSA culture (2.2±0.6%, P=0.026) (Electronic Supplementary Fig. 7E-H).
Live cells were tested for DiIC, identifying apoptotic cells as those without DiIC staining. Cyanine dyes, such as DiIC, penetrate eukaryotic cell membranes and accumulate in the mitochondria with active membrane potentials. When this potential is disrupted (early sign of apoptosis), there is less DiIC staining. No statistically significant difference between the NSA and laminin cells was found (P=0.55) (Electronic Supplementary Fig. 8).
Based on multiple markers, no difference exists in terms of apoptosis between GBM cells grown in NSA or laminin culture conditions (Fig. 7, Electronic Supplementary Fig. 9).
Affymetrix analysis
GBM cells were grown in the NSA (n=6) or adherent (n=6, representing two cell lines and technical replicates of the experiments) culture conditions and were collected for RNA isolation and affymetrix analysis. First, genetic expression as a ratio of laminin and NSA cells that varied by a log fold change. Comparing all of the laminin and NSA grown GBM cells revealed laminin cells had 23 upregulated genes including CD44 and 7 downregulated genes. However, these values included changes that were not statistically significant. When the data were evaluated for genetic expression changes that were significant using false discovery rate measures to avoid type I errors, no difference was found between the laminin and NSA GBM cells (Table 1). In conclusion, using affymetrix analysis, no significant genetic differences were found between GBM cells grown in laminin and the NSA, supporting the phenotypic data.
Tumorigenicity: in vivo model
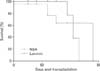
After demonstrating GBM cells maintained stem cell characteristics when grown in the two different culture conditions, tumorigenicity was compared in a xenotransplant model. Tumorigenicity is a critical capability of TICs, and ability to maintain tumorigenic cells is important for a culture condition to be useful. NOD/SCID mice received a flank subcutaneous injection of 1×10⁶ cultured L0 GBM cells. The cells had been passaged in either NSA or adherent conditions for at least 5 passages prior to xenotransplantation. The animals were divided into two equal groups based on receipt of cells from NSA (n=5) or those from adherent culture (n=5). The growth of the tumors (Electronic Supplementary Fig. 10) and survival analysis was the same for hGBM cells grown in the NSA (median survival 78 days) and those grown with laminin (median survival 71 days; ratio, 1.099; 95% CI, 0.8-1.4) (Fig. 8). GBM cells grown in the NSA and laminin culture conditions demonstrated similar ability to initiate and propagate tumor in a xenotransplant model.
Discussion
The NSA is the current standard for identifying and maintaining brain TICs in culture [26]. However, this assay has notable limitations including variable composition of cells [29, 30] and overestimation of proportion of NSCs [31]. To overcome these limitations, modifications to the NSA have been proposed, including the addition of laminin to grow cells flat. Some advantages of adherent culture conditions suggested by these reports include a more pure stem cell population, decreased differentiation, increased tumorigenicity, and decreased cellular apoptosis [39].
Recent reports claim that cells from NSA spheroids have increased differentiation in expansion conditions, although this finding was not statistically analyzed [39]. As TICs differentiate, they lose their stem cell characteristics such as self-renewal, generation of a large number of progeny and multipotency [57]. Consequently, TIC culture conditions should maintain relatively undifferentiated cells that are multipotent (retain the ability to differentiate when exposed to a differentiation agent). In our study, the NSA and laminin cells were not different with regard to staining for nestin (relatively undifferentiated cells), GFAP (astrocyte differentiation) or beta tubulin III (neuronal differentiation) in cell expansion conditions. The differences between our results and other reports may be due to overgrowth of the neurospheres in other studies, resulting in increased cellular differentiation [58]. The two culture conditions did demonstrate variability in protein markers. This may be due to the variable growth of different lines in the two distinct culture conditions, and will require further study.
In addition to the purity of the TIC population, increased tumorigenicity was described as an advantage of laminin-cultured cells. Laminin has also been implicated in GBM invasion and migration based on in vitro migration analyses [59, 60]. In our subcutaneous xenograft model, GBM cells grown in laminin did not show increased tumorigenicity or invasion. The animals implanted with NSA and laminin-cultured cells had similar tumor growth and survival times. Moreover, using an in vitro limiting dilution assay, the two culture conditions demonstrated similar clonogenic potential of the GBM cell lines. However, conclusions from these experiments are limited due to use of a limited number of cell lines, and the need to repeat the limiting dilution assay and survival experiments with an intracranial xenograft model.
The GBM cells grown in NSA and adherent culture conditions did not show differences in cell death or dying as quantified by apoptotic markers. The previous culture studies demonstrated increased apoptosis in cells grown with NSA compared to cells grown in adherent conditions [38, 39]. This literature demonstrated increased apoptosis in NSA cells using annexin V and the terminal deoxynucleotidyl transferase dUTP nick end labeling (detecting fragmented DNA) assays [34, 39]. The decreased apoptosis with laminin was hypothesized to be due to laminin preventing cellular apoptosis that is secondary to detachment from the extracellular membrane [34]. Cell death is a heterogeneous process involving multiple and sometimes overlapping pathways [50]. Therefore, we used multiple apoptosis assays to quantify the difference in the cell dying process and cell death between cells in the NSA and laminin growth conditions. No significant difference in apoptosis or cell death was found between NSA and laminin cultured cells. The previously reported differences in apoptosis are limited by testing of only one or two apoptosis measures.
In conclusion, based on functional criteria such as our long-term proliferation data, cells grown in the NSA and laminin culture conditions have no differences in the proportion of TICs and progenitors. Laminin grown cells also do not show increased clonal frequency in vitro or increased tumorigenicity in a xenograft model compared to the NSA. Furthermore, cells grown in the NSA and laminin have no differences in cell death or any significant differences in genetic expression. Overall, these data show no advantage of the laminin culture method to the NSA.
Developing novel and effective therapy for GBM is challenging due to tumor heterogeneity, robustness and imperfect tumor models. The development of alternative culture techniques for establishing cell lines is a useful addition to the existing tools for the study of GBM. Although potentially more convenient for certain applications, GBM cells grown in adherent conditions are not significantly different from cells grown with the traditional NSA.
 XML Download