

 PDF
PDF ePub
ePub Citation
 Print
Print


Introduction
Diets of the past and the related environmental factors can be studied by stable carbon and nitrogen isotope analysis, one of the well-established techniques of archaeological science [1, 2, 3, 4, 5, 6, 7]. Such analyses are based on the principle that the carbon and nitrogen isotope values of specific foods are reflected in the isotope compositions of human or animal bodies [6, 8]. The stable isotope results derived from those analyses are proven to represent the average diet over at least the last several years prior to the individual's death [9]. Generally, different historical populations utilize the food resources that are available in their respective environments [10, 11, 12, 13]. Carbon and nitrogen stable isotope analyses on skeletal series representing various spatial and temporal ranges therefore reveal the paleodietary patterns of historical peoples even in the absence of other scientific evidence.
To acquire the information on the diets of the past, some of the pioneering stable isotope analyses have also focused on ancient samples from Korean archaeological sites [6, 14, 15]. In the cases, information invaluable to any comprehensive understanding of historical dietary habits in Korea has been obtained. However, the data required to reveal the general patterns of the diets representing the relatively recent later-Joseon period (1392-1910 CE) still remains insufficient. In fact, most completed studies on Joseon samples are case reports on just a few individuals at a time.
Even though Joseon-period samples are of relatively recent chronology in Korean history, their academic meaning is not at all insignificant. Indeed, between Joseon and modern Korean samples, there is an intervening period of rapid industrialization and modernization. We expect that there would be many and significant differences in the biological traits of the bones representative of those respective periods, as induced by the very divergent socio-economic environments.
Over the past several years, we have endeavored to build a human sample collection consisting of skeletons discovered in 16th-18th century Joseon cemeteries in Korea. In fact, our previous studies have yielded clarifying data on the health and disease statuses of pre-modern Joseon peoples [16, 17, 18, 19, 20, 21, 22]. In the present study, to contribute to a better understanding of the food-intake patterns of pre-modern Joseon populations in Korean history, we tried to perform a stable isotope analysis on skeletons from the same Joseon collection.
Materials and Methods
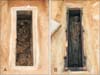
The samples of this study were obtained from the bones of Joseon Human Skeletal Series (JHSS) maintained in Department of Anatomy, Seoul National University College of Medicine. Briefly, the skeletal individuals were collected from the tombs identified in the archaeological sites of Sinnae (SN) and Eunpyeong (EP) (by Hangang Institute of Cultural Heritage, Seoul, Korea). Both sites were known to be the cemeteries for Seoul people of Joseon period. Rescue archaeology was done on the sites before an urban redevelopment plan began. In the site, archaeologists found many tombs where human skeletons were discovered (Fig. 1). The bones were moved to Seoul National University, being maintained as a part of skeletal series.
Anthropologists among us did sex and age estimation on the samples. Sex was determined by methods recommended by Buikstra and Ubelaker [23]. Briefly, the estimation of the individuals' sexes was based on the anatomical differences of the pelvic bone (e.g., sciatic notch, preauricular sulcus, ischiopubic ramus, and subpubic angle). Additional clues obtained from the skull, such as the nuchal crest, mastoid process, supraorbital margin, and the palate, also were considered [24, 25]. Age was also estimated by auricular-surface degeneration of the hip bone, based on the degree of transverse organization, granularity, apical activity, retroauricular area degeneration, and auricular-surface porosity [26]. The age was accordingly categorized into eight phases: 1-2, young adult (20-35 years old); 3-6, middle-aged (36-50 years old); and 7-8, old adult (over 50 years old).
For studying carbon and nitrogen stable isotope ratio, collagen is extracted from archaeologically obtained bones because it is regarded as an ideal experimental sample for stable carbon and nitrogen isotope analysis. All samples were prepared for isotopic analysis following a modified Longin method [27], with the addition of an ultrafiltration step [28]. Briefly, 200 mg of powdered bone were demineralized in 0.5 M HCl solution at 4℃ for 16 hours. The collagen was then gelatinized in pH 3 water at 75℃ for 48 hours. After removing insoluble residues with a 5-8 µm Ezee mesh filter (Elkay Laboratory Products, Hampshire, UK), the remaining solution was filtered using 30-kDa filters once again to remove impurities [29].
Content and isotope ratios of C and N were determined using a continuous-flow stable isotope ratio mass spectrometer (IsoPrime-EA, Micromass, Manchester, Milan, UK) linked with a CN analyzer (NA Series 2, CE Instruments, Milan, Italy). Carbon and nitrogen isotope compositions (δ13C and δ15N) were calculated as: δ (‰)=[(Rsample/Rstandard)-1]×1000 where R is the ratio of 13C/12C or 15N/14N; and the standards were the Pee Dee Belemnite (PDB) for carbon and atmospheric (AIR) for nitrogen. Two replicate analyses were performed for each sample; and the averages were used for the statistical analysis in this study. Multiple replicate analyses indicated that standard deviations for the δ13C and δ15N measurements were <0.1‰ and <0.2‰, respectively.
It is crucial for researchers to seek out outliers or extreme values that could make a serious negative influence on the statistical analysis [30]. Among the 40 samples examined in this study, we tried to find out the outliers by general boxplot methods [30, 31]. Briefly, a simple method for constructing inner and outer fences could be applied to our data. Inner fences in this study (f1 and f3) were made by the equations of f1=q1-1.5×IQR and f3=q3+1.5×IQR. The probability of the mild outlier beyond the inner fences is 0.006976. As for the extreme outlier beyond the outer fences (probability, 0.00000235), we used the equations, F1=q1-3×IQR and F3=q3+3×IQR. Mild or extreme outliers identified were finally removed from our dataset.
Dataset before and after removal of outlier were evaluated by Shapiro test for distribution and by variance equality test. Two sample t test for independent samples was used for testing differences in δ13C and δ15N values between each sex and cemetery group. Differences of δ13C and δ15N among age groups (young, middle, old) were tested using one-way analysis of variances (ANOVA). All statistical analyses were performed using the R version 3.1.1 [32]. Differences at the 0.05 level are reported as significant.
Results
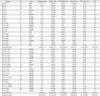
The stable isotope results of Joseon people buried in the cemeteries around Old Seoul City are summarized in Table 1. The δ13C and δ15N results are also summarized in the same Table. As for the preservation status of collagen in this study, we analyze the atomic C/N ratios and the yield of extracted gelatin [7]. Considering C/N ratios of 2.9-3.6 as acceptable [7, 8, 33], every sample in this study (C/N ratios, 3.0 to 3.6) looks fall within the acceptable range, being used as a dataset for the analysis.
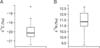
By the outlier-finding analysis suggested by Schwertman et al. [30], EP-3-D1-384 was removed as outlier from our original dataset (Fig. 2). The δ13C value of EP-3-D1-384 is -17.26, that is greater than inner fence f3 (δ13C value, -18), but not beyond the outer fence F3 (δ13C value, -16.7). As EP-3-D1-384 falls into mild outlier, we remove it from the dataset.
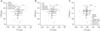
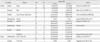
Stable isotope results of new dataset (n=39) ranged -18.54‰ to -21.4‰ (mean, -20.03±0.64‰) for δ13C, and 9.34‰ to 12.66‰ (mean, 11.40±0.84‰) for δ15N. The results of the different sex, age, and cemetery groups are also summarized in Table 2, and plotted in Fig. 3.
Briefly, t test showed that there are no significant differences in δ13C values between sex (male and female; t=-1.756, P=0.087), and between cemeteries (SN and EP; t=-1.989; P=0.054). One-way ANOVA test also exhibited no significant difference in δ13C values between age groups (young, middle and old; F=0.274, P=0.762). On the other hand, in case of nitrogen values by t test, we observed significant differences in δ15N between sexes (t=-2.779; P=0.010) and cemeteries (t=-3.247, P=0.002). Significantly lower δ15N values were for females and cemetery SN. However, ANOVA test exhibited that there were no statistical difference of δ15N values between age groups (F=1.951, P=0.157) (Table 2).
The isotope ratios in each cemetery were analyzed further by sexes. There were no statistical differences in δ13C values between males and females of EP (P=0.237) and SN (P=0.355) cemetery populations. However, in case of δ15N values, SN showed significant difference between sexes (lower values for female; P=0.001) while EP did not exhibit the difference (P=0.884) (Table 3).
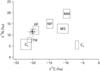
There were no statistical differences in δ13C values between males (P=0.180) of both cemeteries. Females in SN and EP did not show the difference in δ13C values either (P=0.279). However, as for the δ15N values of females from both cemeteries (EP and SN), we found significant difference between them (t=-3.8441, P=0.002) while males of both cemeteries did not show the difference in δ15N values between them (t=-0.8778, P=0.3905) (Fig. 4). The isotope ratios from the current and previously reported data from historical populations in Korea and Japan are summarized in Table 4 [6, 7, 14, 15, 29, 34, 35]. Mean and one standard deviation of the δ13C and δ15N values from Joseon cemetery samples are also compared with the ranges of isotope ratios of Japanese food groups (Fig. 5) [36, 37, 38].
Discussion
Stable carbon and nitrogen isotope analysis has become a kind of routine technique for application to archaeologically obtained samples. Analyses of the carbon and nitrogen isotope ratios δ13C and δ15N have revealed patterns of the consumption of specific foods by various peoples in history [39, 40, 41]. The carbon isotope ratio δ13C provides the dietary proportions of C3 (wheat, rice and potatoes)- and C4 (maize, millet and other tropical grains)-based foods consumed in the past. By analysis of δ13C data, researchers can isolate the important crops for the people inhabiting a given region [6]. In general, C4-based foods show higher δ13C values than do C3-based foods [41, 42, 43, 44]. Previous studies have shown that the δ13C value of a C3 crop is -25.4±1.6‰ while that of a C4 crop is -10.0±0.5‰ [36, 45].
In Korea, a number of pioneering studies subjecting ancient samples to stable isotope analysis already have provided researchers with clearer pictures of historical Joseon dietary patterns. Briefly, Kang et al. [15] revealed a diet of C3 crops such as rice, barley, wheat and beans in their stable isotope analysis of four sets of human-skeletal remains from Joseon Dynasty tombs. Kang and Shin [35], having performed a stable isotope study on a female mummy discovered in a Joseon tomb in Mungyeong City of South Korea, hypothesized a dietary dependence of the case on protein-rich C3 crops [35]. Considering the relevant previous studies' obtained δ13C values together, it seems that the Joseon staples were mainly C3-based foods. Similarly, in the current study, we also see that Joseon people buried around Old Seoul City consumed more C3-based than C4-based foods as the main staples.
Meanwhile, the nitrogen stable isotope also has been applied to the study of the trophic level, and has been integral to successful reconstructions of food webs of the past [6, 46]. In fact, nitrogen stable isotope data has provided information on the dietary influence by marine proteins [47, 48]. The nitrogen isotope ratio, δ15N, is higher in cases of ingestion of marine food than of terrestrial resources. By knowing that δ15N increases in the order of plants, herbivores, carnivores, researchers could reconstruct animal versus plant protein consumption patterns among historical populations [46, 48, 49, 50]. In general, when a δ13C value is measured at about -12‰ and a δ15N value between 12‰ and 22‰, it is likely that the main protein source was marine food. For C3-based terrestrial protein, on the other hand, the δ13C value is about -20‰ and the δ15N, between 5‰ and 12‰ [6, 51, 52].
In this regard, the current study on the Joseon skeletal series provides a new perspective on the dietary patterns of Koreans prior to industrialization and modernization. Based on our δ13C (-18.54‰ to -21.4‰; mean, -20.03±0.64‰) and δ15N (9.34 to 12.66; mean, 11.40±0.84‰) results, we can conclude that the Joseon people (especially those living in Old Seoul City, the Joseon capital) represented by our samples consumed protein mainly of terrestrial origin.
Yet in a sense, it is natural that the Joseon people living inland Old Seoul City might have ingested more foods containing terrestrial-origin protein. However, based on the previous historical study, the diet ingestion pattern of Joseon people looks much complicated. According to Oh [53], seafood was commonly consumed by Joseon people because salted fishes were widely available at the period. Considering that the Joseon people of Old Seoul City easily bought salted or dried fishes in the nearby markets, studying how large proportion of protein they ingested was actually originated from the seafood looks very meaningful to concerned researchers.
Also, the values of stable isotope analysis in this study showed unique patterns within each age, sex and cemetery group. For example, although the δ13C values did not reveal any statistical differences between the groups we examined, significantly higher values of δ15N were observed among the male samples. This result corresponds well with the data previously reported by Tsutaya et al. [7], who found that the δ15N values representative of 17th century Edo males were higher than those of females. Similarly to the data interpretation of Tsutaya et al. [7], on this sex difference among pre-modern Joseon people's δ15N values, we also speculated that dietary differences between the sexes could have been determinative.
Actually, we should consider that food-sharing pattern among people were different at each stage of human history. While most reports showed that the δ15N values were lower in women than in men of the historical populations [7, 29, 54], the other studies reported that there is also a kind of fare share of food between sexes [55, 56, 57]. In this regard, to know whether males and females' protein diets in pre-modern Korea were similar to the specific historical society already reported, we admit that stable isotope analyses should be done on more cases of archaeologically obtained human remains in this country. In this regard, the current study can be the stepping-stone for revealing the changes in dietary share between sexes in historical Korean population.
Differences in δ15N values also were observed among the sampling sites (i.e., cemeteries). Briefly, the values were higher for the EP cemetery individuals than for the SN ones. In fact, previous studies have already established that distinct groups show different patterns in their dietary components: more and higher-quality food for higher-status individuals than for their lower-status counterparts [14, 58]. However, we were unable to confirm whether the difference in δ15N values between the cemetery groups of our study also reflect such a socioeconomic difference. Additional studies are still needed for revealing what made such differences in δ15N values among the sampling sites.
In conclusion, our purpose of this study is to contribute to a better understanding of the food-intake patterns of premodern populations in Korean history, by a stable isotope analysis on human skeletons from Joseon-period cemeteries discovered around Old Seoul City. Our data clearly showed that Joseon individuals consumed mainly C3-based foods as the main staples, and that the proteins they ingested were mainly of terrestrial, but not of marine origin. We also found that significantly higher values of δ15N were identified in males than in females, which might reflect dietary differences between the sexes.
Certainly, as compared with their modern counterparts, stable isotope analysis of Joseon samples contribute greatly to an understanding of the dietary patterns of contemporary Koreans' ancestors. However, in Korea, whereas a number of studies subjecting ancient samples to stable isotope analysis have provided researchers with general pictures of historical Korean dietary patterns, we admit that further studies of this type, on samples temporally and spatially more wide-ranging, are still necessary.


 XML Download