

 PDF
PDF ePub
ePub Citation
 Print
Print


Introduction
Amyotrophic lateral sclerosis (ALS), commonly known as Lou Gehrig's disease, is a progressive and fatal adult-onset neurodegenerative disease characterized by selective loss of central and peripheral motor neurons (MNs) in the brain and spinal cord [1]. The most common mutations found in familiar ALS (10% of total cases) involve the gene that code for the enzyme copper-zinc superoxide dismutase 1 (SOD1). However, this explains only about 20% of familiar ALS cases and 2% of the sporadic form of this disease. This strongly supports the involvement of several genes and the possible role of environmental factors that may trigger the pathogenic mechanisms in vulnerable individuals [2]. The landmark discovery that transgenic mice or rats overexpressing mutant SOD1 have symptoms that mimic human ALS has contributed significantly to our understanding of human ALS [3, 4, 5, 6]. The G93A mutation in SOD1 [SOD1(G93A)] is one of the 150 currently known mutations that cause human ALS. Nevertheless, effective approaches for preventing SOD1 mutation-mediated MN degeneration remain unknown.
Autophagy is a eukaryotic degradative mechanism which maintains cellular homeostasis in environmental stress [7]. It is generally activated by metabolic stresses including hypoxia, nutrient deprivation, and an increase in proliferation [8]. During this process, bulk cytoplasm is sequestered within double-membrane vesicles called autophagosomes and delivered to the lysosome for subsequent degradation and recycling [9]. Recently, 30 autophagyrelated (Atg) genes were identified whose products appear to be related to the autophagy process: these genes were characterized in yeast [10, 11, 12]. It was found that the molecular basis of autophagy may well be highly conserved from yeast to humans [13, 14]. For example, rat microtubule-associated protein 1 light chain 3, a mammalian homologue of Atg8 plays a critical role in the formation of autophagosomes [15]. Recently, the study of mice deficient for autophagy-related 5 (Atg5) or autophagy-related 7 (Atg7), specifically in neurons, suggested that the continuous clearance of diffuse cytosolic proteins through basal autophagy is important to prevent the accumulation of abnormal proteins, which can disrupt neural function and ultimately lead to neurodegeneration [16, 17, 18]. Atg9 is an integral membrane protein localized in the phagophore/pre-autophagosomal structure (PAS), the origin of the autophagosomal membranes [19, 20, 21]. Atg9 is required for both the formation and the expansion of the autophagosomes [22, 23]. The role of Atg9A in the formation of autophagosomes remains to be identified, although subcellular localization of the Atg9A protein is clearly dependent on nutrient availability. Because autophagy is a highly conserved degradation system, it is expected that tissue distribution of Atg expression will be relatively uniform [22].
Despite the significance of Atg9A signaling in pathology, relatively little is yet known about the activation of Atg9A signaling in ALS. Therefore, in the current study, we examined ALS-related changes in the levels of Atg9A immunoreactivity in ALS mice using immunohistochemical studies. For the first time, we have demonstrated significant changes in the levels of Atg9A immunoreactivity in the central nervous system (CNS) using SOD1(G93A) mutant transgenic mice as an in vivo model of ALS.
Materials and Methods
Animals and tissue preparation
Twelve male SOD1(G93A) transgenic and 10 male wild-type (wt) SOD1 transgenic mice developed by Gurney et al. [4] were used for these experiments. They were bred by The Jackson Laboratory (Bar Harbor, ME, USA) under the strain designations B6SJL-TgN (SOD1G93A) 1Gur and B6SJL-TgN (SOD1) 2Gur for mutant transgenic and wtSOD1 transgenic mice, respectively. The B6SJL-TgN (SOD1) 2Gur strain carries the normal allele of the human SOD1 gene, and it has been reported that the SOD1 protein levels are the same as in the transgenic strain carrying the SOD1(G93A) transgene. This strain serves as a control for the B6SJL-TgN (SOD1G93A) 1Gur. Animals were sacrificed at the age of 8 (w), 13 (presymptomatic) and 18 (symptomatic) weeks. Clinical symptoms were manifested in the 18w mutant transgenic mice. The first signs of hind limb paresis appeared at 16-18w in the SOD1(G93A) transgenic mice. When suspended from the tail, these mice did not extend symmetrically both hind limbs, as normal mice do. The weak limb was closer to the body. Subsequently, the weakness of one hind limb progressed to paralysis of this limb, and soon thereafter the other hind limb became paralyzed. At that stage, both hind limbs were dragged as the mouse moved around the cage. From the time when transgenic mice showed motor deficits, nutritional gel was routinely placed in the cages of all transgenic animals for easy access to food and hydration. The mice were weighed weekly with an electronic scale. Because of ethical considerations, transgenic animals were euthanized when they were unable to right themselves within 30 seconds. The animals used in this experiment were treated according to the Principles of Laboratory Animal Care (NIH publication no. 86-23). The mice were perfused transcardially with cold phosphate-buffered saline (0.02 M, pH 7.4) and then with ice-cold 4% paraformaldehyde for 10 minutes at a flow rate of 5-6 ml/min. Brains were immediately removed and sliced into 4-6 mm thick blocks. Spinal cords were also removed and sliced into the cervical, thoracic, and lumbar segments of 3-10 mm in length. These blocks were immersed in a cold fixative for 12 hours and replaced with 20% sucrose for 1-2 days, followed by 30% sucrose for 1-2 days. After the treatment with sucrose solutions, the tissues were embedded in OCT compound (Sakura Fine Tek Inc., Torrance, CA, USA). Frozen sections were cut at 40 µm in the coronal plane at -20℃.
Immunohistochemistry
Immunohistochemistry was performed using the free-floating method as previously described [24, 25]. Briefly, the goat anti-Atg9A polyclonal antibody (sc-70141, Santa Cruz Biotechnology, Inc., Santa Cruz, CA, USA) was used as the primary antibody. This antibody was affinity-purified and raised against a peptide that mapped near the amino terminus of the human Atg9A protein. Sections were visualized according to the avidin-biotin complex (ABC) method, using an ABC kit (Vectastain, Vector Laboratories, Burlingame, CA, USA) and developed for peroxidase reactivity using 3,3'-diaminobenzidine (Sigma-Aldrich Co., St. Louis, MO, USA). To observe the stained cells, a microscope (Leica DM4500B, Leica Microsystems, Wetzlar, Germany) with a computer-driven digital camera (DFC320, Leica Microsystems) was used.
Primary antibody specificity testing
To confirm the specificity of the primary antibodies, we performed a preadsorption test using the previously mentioned immunohistochemical method. In the preadsorption test, sections that were reacted using the above protocol without the primary antibodies were used as negative controls, while other sections were exposed to the anti-Atg9A antibody that had been preadsorbed with Atg9A antibody (Atg9A: sc-70141, Santa Cruz Biotechnology, Inc.) for 24 hours. Other sections were exposed to the anti-Atg9A antibody as positive controls. Negative control sections (not anti-Atg9A antibody) and samples exposed to the anti-Atg9A antibody that had been preadsorbed with Atg9A antibody did not exhibit immunoreactivity, whereas positive controls showed definitive Atg9A immunoreactivity.
Statistical analysis
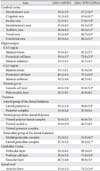
To determine whether the observed changes in Atg9A immunoreactivity were statistically significant, we randomly selected five areas in each brain and spinal cord region of each wtSOD1 transgenic and SOD1(G93A) transgenic mice and compared the determined mean staining densities using the NIH image program (Scion Image). Mean staining density represented the sum of the gray values of all the pixels in the selected area divided by the number of pixels within the area. The averages of the mean staining densities in various brain and spinal cord regions of each animal were then calculated, and the Mann-Whitney U-test was performed using these averages (P<0.05) (Table 1).
Results
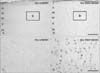
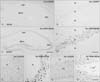
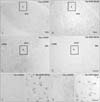
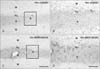
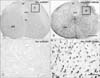
Sections from the brain and spinal cord of wtSOD1 transgenic and presymptomatic SOD1(G93A) transgenic mice exhibited strong levels of Atg9A immunoreactivity at the age of 8 weeks and 13 weeks. No differences were observed in staining intensities between the two groups (data no shown). In symptomatic SOD1(G93A) transgenic mice, increased expression of Atg9A was pronounced in the cerebral cortex, hippocampal formation, thalamus, cerebellum and spinal cord (Table 1). In the cerebral cortex of wtSOD1 transgenic mice, cells positively stained for Atg9A were observed in layers II-VI in most cortical regions, including the somatomotor area (Fig. 1A), somatosensory area, auditory area, visual area, entorhinal area, piriform area, and prefrontal area. At a higher magnification, Atg9A-immunoreactive cells in symptomatic SOD1(G93A) transgenic mice illustrated the typical morphology of cell bodies (Fig. 1D), whereas only weakly stained cell bodies were found in wtSOD1 transgenic mice (Fig. 1C). There were more Atg9A positive cells in the same cortical regions in symptomatic SOD1(G93A) transgenic mice (Fig. 1B, D). In hippocampal formation, there were layer-specific alterations in the number and staining intensities of Atg9A-immunoreactive cells (Fig. 2A, C). It was noted that the pyramidal cell layers in the CA1-3 region did not exhibit immunoreactivity for Atg9A in wtSOD1 transgenic mice (Fig. 2A, B, E). In symptomatic SOD1(G93A) transgenic mice, Atg9A immunoreactivity was significantly increased in all three layers of the CA1-3 areas, and the alteration was prominent in the pyramidal cell layers (Fig. 2C, D, F). In the dentate gyrus, Atg9A immunoreactivity was also increased in the granule cell layers in SOD1(G93A) transgenic mice (Fig. 2G, H). In the thalamus of wtSOD1 transgenic mice, unstained cell bodies were observed in the dorsal lateral geniculate nucleus, ventral lateral geniculate nucleus, lateral posterior thalamus nucleus, mediorostral, lateral posterior thalamus nucleus, laterorostral, and intramedullary thalamus area (Fig. 3A, C, E, G), while Atg9A-positive cells were strongly detected in symptomatic SOD1(G93A) transgenic mice (Fig. 3B, D, F, H). In the cerebellar cortex of wtSOD1 transgenic mice, unstained cells bodies were observed in the granular, molecular, and Purkinje cell layers (Fig. 4A), while Atg9A positive cells were strongly detected in the same layers in symptomatic SOD1(G93A) transgenic mice (Fig. 4C). At a higher magnification, Atg9A-immunoreactive cells with large cell bodies were not observed in the granular, molecular, and Purkinje cell layers in wtSOD1 transgenic mice (Fig. 4B). High levels of immunoreactivity were detected in the cell bodies of symptomatic SOD1(G93A) transgenic mice (Fig. 4D). In the spinal cord of wtSOD1 transgenic mice, stained cells were not observed in the lumbar segments (Fig. 5A). However, Atg9A immunoreactivity was significantly increased in symptomatic SOD1(G93A) transgenic mice (Fig. 5B). At a higher magnification, the spinal cord layers, dorsal cortiscospinal tract and anterior horn did not exhibit Atg9A immunoreactive cells with large cell bodies in wtSOD1 transgenic mice (Fig. 5C). High levels of immunoreactivity were detected in the cell bodies in SOD1(G93A) transgenic mice (Fig. 5D). In the cervical, thoracic, and sacral segments, their distribution patterns were similar to those in the cervical segments.
In the brain and spinal cord areas where Atg9A-immunoreactive cells were located, ALS-related changes in the expression of Atg9A were analyzed. When the distribution of Atg9A immunoreactivity in symptomatic SOD1(G93A) transgenic mice was compared with that in wtSOD1 transgenic mice, the overall distribution pattern seemed to be preserved in symptomatic SOD1(G93A) transgenic mice. The increased levels of Atg9A immunoreactivity observed in these areas were statistically significant at P<0.05 (Table 1).
Discussion
The present study demonstrated that, in symptomatic SOD1(G93A) transgenic mice, the distribution patterns and staining density of Atg9A immunoreactivity were significantly increased in several areas, such as the cerebral cortex, hippocampal formation, thalamus, cerebellum and spinal cord. Previously, Atg9A-related brain-specific expression was reported to be altered in various regions in the brain and spinal cord in mice [11]. In the current study, more Atg9A-immunoreactive cells were observed in the CNS of symptomatic SOD1(G93A) transgenic mice compared with wtSOD1 mice, and Atg9A-immunoreactive cells exhibited increased levels of immunoreactivity compared to those seen in Atg9A-immunoreactive cells. As previously reported [11], Atg9A expression was ubiquitous and high in CNS tissue, particularly in neurons. Also, Atg9A was detected in part in Purkinje cell bodies and distinctly in axon terminals of the cells. Although the PAS, in which Atg proteins are localized, has been shown in yeast, its existence in mammalian cells has not been confirmed. Nevertheless, like the PAS membrane in yeast, identification of the membrane origin of autophagosome formation in mammalian cells is very important. Because the Atg9A protein is the only Atg membrane protein, it has been suggested that the Atg9A protein transports membranes during autophagosome formation. The protein is localized to late endosomes, and it dynamically cycles between these organelles under starvation conditions [23, 26]. In fact, generation of Atg9A-deficient mice has shown that the protein is essential for survival during neonatal starvation [27]. These results indicated that the protein expression of Atg9A in mouse tissues may be regulated in a posttranslational manner [11]. The protein was localized in lysosomes/late endosomes in Purkinje cells of the mouse cerebellum. Moreover, localization of the Atg9A protein both in the axon terminals of Purkinje and basket cells and in Purkinje cells suggests that the Atg9A protein, which is the only membrane Atg protein, may play an essential role in the initiation of autophagosome formation.
There have been several reports of autophagy in ALS [27, 28, 29, 30]. Autophagy in transgenic mice with the G93A mutant SOD1 gene is increased because of upregulation of Atgs immunoreactivity, and mutations in the autophagy-lysosomal pathway transport machinery have been shown to be associated with frontotemporal dementia and ALS [31, 32, 33]. A detectable, although variable in magnitude, degree of cognitive involvement has been found in many patients with ALS. Indeed, 5-15% of ALS patients meet criteria for frontotemporal dementia, while a substantial percentage of patients without dementia may show mild to moderate executive (approximately from 22% to 35%) and behavioral (up to 63%) dysfunctions [7, 8, 9]. Structural and functional magnetic resonance imaging, positron emission tomography, and single photon emission-computed tomography studies have corroborated the theory of frontotemporal impairment in ALS with approximately half of the patients displaying at least mild abnormalities [34, 35, 36, 37]. Moreover, by electron microscopy, all ALS patients exhibited autophagosomes and/or autolysosomes in the cytoplasm of both normal-appearing and, more frequently, degenerated MNs, and an increase in autophagic processes was closely correlated with ALS-characteristic inclusions. In this regard, it is possible that the autophagic pathway could be preferentially activated in the cellular response to misfolded proteins in the endoplasmic reticulum (ER), because ER stress seems to be involved in the pathomechanism of neurodegeneration of MNs in sporadic ALS [38, 39]. The absence of autophagosomes in the cytoplasm of normal-looking MNs in controls is consistent with previous reports that have shown that the levels of autophagosomes detected in neurons are very low under normal and even starvation conditions [40]. By contrast, both autophagosomes and autolysosomes were far more abundant in the cytoplasm of MNs in patients with sporadic ALS, which is consistent with typical results of induction of autophagy [41].
Previously, To test new therapies, investigators measured clinical, histological and functional features so as to be able to evaluate disease severity and progression in SOD1 mice. They compared six testing methods including clinical grading, weighing, hanging wire test, rotarod test, MN counting and motor unit number estimation in SOD1 mice and control animals. The number of functional motor units precisely correlated with MN counts [42]. A confirmed relation between autophagy and ALS exits, but it is still controversial whether activating autophagy is beneficial or detrimental for the MNs degeneration. Autophagy is considered as initial factor to ALS process, but expanding evidence suggests the impaired autophagic flux and excessive autophagic vacuoles are responsible for this pathologic alternation in late stage. ALS-associated protein aggregations and certain mutant genes may be possible causative factors for autophagic flux inhibition. Further studies need to be done to elucidate other molecules and possible mechanisms involved in ALS, which can help us depict a more integrated network between autophagy and ALS [43].
As shown in the present study, the levels of Atg9A immunoreactivity were increased in several brain and spinal cord of the symptomatic SOD1(G93A) transgenic mice, suggesting that the levels of expression of Atg9A is altered in specific brain and spinal cord areas during ALS development, and these changes may provoke specific functional consequences. We have demonstrated, for the first time, that Atg9A immunoreactivity was significantly increased in the cerebral cortex, hippocampal formation, thalamus and spinal cord of the CNS of SOD1(G93A) transgenic mice. These results propose that changes in expression levels of Atg9A may underlie several ALS-induced selective neuronal losses in symptomatic SOD1(G93A) transgenic mice. Controlling the activity of these proteins has become a specific target in the treatment of motor functional deficits in degenerative and neurological diseases. However, more work into understanding the function and role of Atg9A signaling is still required. Thus, the functional consequences of Atg9A signaling have yet to be elucidated.
 XML Download