

 PDF
PDF ePub
ePub Citation
 Print
Print


Introduction
Root exposure caused by gingival recession can lead to hypersensitivity, root caries, increased gingival inflammation, and unaesthetic results because of improper plaque management [1]. Various types of periodontal plastic surgery and materials such as free gingival grafts, subepithelial connective tissue grafts, acellular dermal matrix grafts, and guided tissue regeneration have been developed to solve this problem [2]. Subepithelial connective tissue grafts that use a dense connective tissue of the palatal mucosa have shown high success rates and can minimize discomfort after the operation, so they are frequently used when treating an exposed root, alveolar ridge, or soft tissue around implants [2, 3]. Successful surgery depends on several factors, such as a sufficient blood supply to the graft, color harmony with the recipient site, minimal damage at the donor site, and patient comfort after the operation [3]. These factors require anatomical knowledge of the palatal mucosa and the greater palatine artery (GPA), which supplies the palatal gingiva with blood, for determination of the optimal treatment plan and prognosis.
The palatal mucosa used as the main donor site for autologous grafts comprises a keratinized stratified squamous epithelium for frictional resistance; the lamina propria (LP), which is a dense connective tissue that supports the oral epithelium; and the submucosa layer composed of glandular and adipose tissues that surround the palatal neurovascular bundle under the LP [4]. In the anterior region of the hard palate constituting the mucoperiosteum, Sharpey's fibers in the submucosa layer, which tightly attach the LP to the periosteum, make it difficult to separate these 2 structures [5].
The GPA, which supplies the hard palate with blood, branches in the descending palatine artery, travels within the palatal bony groove through the greater palatine foramen, and ascends to the nasal cavity passing through the incisive foramen [6]. At this position, the palatal groove is divided into medial and lateral sides by the palatine spine, and the GPA traverses the lateral groove while the greater palatine nerve traverses the medial groove [7, 8].
Subepithelial connective tissue grafting involves transplanting the dense connective tissue under the keratinized epithelium in the hard palate in a wedge shape [3]. In this procedure, it is important to remove the LP in a uniform thickness without damaging the palatal neurovascular bundle. This has prompted many researchers to use various methods to evaluate the entire thickness of the palatal mucosa, including direct bone sounding by using a periodontal probe [9], ultrasonic devices [10], and computed tomography [11]. However, these methods are limited because they evaluate only the whole thickness of the palatal mucosa from the surface of the epithelium to the periosteum.
Recent studies on epithelial thickness have been conducted by collecting mucous membranes from patients and using optical coherence tomography [12, 13], but evaluations of the LP thickness-which is an important factor in autologous grafting-are still inadequate. Therefore, this study aimed to measure the thickness of the epithelium and LP of the palatal mucosa and to elucidate the location of the GPA to provide the anatomical basis for subepithelial connective tissue grafting by using histomorphometric analysis.
Materials and Methods
Sixteen cadaver heads (32 hemimaxillae) with dentulous dentition from the canine to the first molar, which had been donated for educational purposes to the Department of Anatomy, School of Medicine, Chosun University, were examined. They comprised 13 men and 3 women, with the age at death ranging from 39 to 73 years (mean, 57.1 years). This study followed the Declaration of Helsinki on medical protocol and ethics.
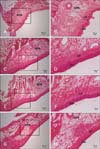
The maxillae were decalcified for 2 months in a decalcification solution (8 N formic acid and 1 N sodium formate), and each maxilla specimen was sectioned horizontally at the interdental line from the canine to the first molar perpendicular to the midpalatal suture by using a microtome blade (Feather, Osaka, Japan). The sectioned specimens were then processed for embedding in paraffin based on the location of the distal surface (canine, first premolar, second premolar, and first molar) and microsectioned at a thickness of 7 µm. These histology sections were stained with hematoxylin-eosin and observed with the aid of a light microscope (EZ4HD, Leica, Wetzlar, Germany) with a built-in image acquisition system (LAS Basic v4.0, Leica).
On the obtained histology specimens, the reference line was initially set to touch the surface of the palatal mucosa. The alveolar crest at the 0-mm level was arranged to contact a line extending from the alveolar crest with the reference line perpendicular. Three measurement positions were designated, starting from 3 mm below the alveolar crest and with 3-mm intervals. The thickness of the epithelium from the mucosal surface to the epithelial ridge and the thickness of the LP from the epithelial ridge to dense connective tissue were measured at these positions perpendicular to the mucosal surface. In addition, to elucidate the location of the GPA, the length from the alveolar crest to the center of endothelium of the GPA and the depth from the surface of the palatal mucosa to that center were evaluated based on the fact that the lateral branch of the GPA provides the main blood supply to the palatal gingiva (Fig. 1). All measurements were evaluated by using image processing software (I solution capture, iMTechnology, Vancouver, Canada) to an accuracy of 0.01 mm, and two investigators measured the same items with standards of measurement.
Statistical analyses were performed by using SPSS ver. 12.0 (SPSS Inc., Chicago, IL, USA) to determine the mean, standard deviation, median, interobserver difference, and right and left differences. These analyses indicated no significant difference between the observers (P=0.812), therefore the mean of the two measurements was used as the final measurement value. There was also no significant difference between the right and left sides (P=0.621). One-way ANOVA with a post-hoc comparison by using Scheffé's method was applied according to tooth site and measurement position. No distinctions were made with regard to either age or gender. The level of statistical significance was set at P<0.05.
Results
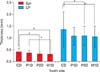
The epithelial thicknesses of the palatal mucosa were 0.38, 0.34, and 0.31 mm at 3, 6, and 9 mm below the alveolar crest, respectively, thus decreasing from the alveolar crest to the midpalatal suture, with a statistically significant difference only between 3 and 9 mm below the alveolar crest (Table 1). In terms of tooth site, the thicknesses were 0.41±0.14 (mean±standard deviation), 0.36±0.10, 0.32±0.09, and 0.30±0.06 mm in the canine, first premolar, second premolar, and first molar distal areas, respectively, thus significantly decreasing toward the posterior tooth (Figs. 2, 3).
The LP thicknesses of the palatal mucosa were 1.48, 1.04, and 0.87 mm at 3, 6, and 9 mm below the alveolar crest, respectively, thus decreasing toward the midpalatal suture, like the epithelial thickness, with the thickness being significantly greater at 3 mm below the alveolar crest (Table 2). In terms of tooth site, the thicknesses were 1.36±0.76, 1.08±0.37, 1.09±0.40, and 1.05±0.46 mm in the canine, first premolar, second premolar, and first molar distal areas, respectively. The thickness of canine distal was significantly smaller compared with the first premolar distal (P=0.053), thus it was significantly thicker than other tooth sites, which showed similar thickness (Figs. 2, 3).
The lengths of GPA increased toward the posterior molar, and significantly shorter in the canine distal. The depths of the GPA decreased from the canine distal to the first premolar distal but then increased again toward the posterior molar (Table 3).
Discussion
Partial or overall gingival recession causes marked hypersensitivity to cold air and liquid, increases the difficulty of plaque management, and results in an unaesthetic and aged appearance [3]. The subepithelial connective tissue graft first introduced by Langer and Langer [14] for root coverage is most commonly used to solve this problem because it has shown a high success rate and a long-term desirable aesthetic result [2].
The width and thickness of the transplant graft in the hard palate first need to be determined for covering the partially or overall exposed root. A too-thin graft has a higher probability of necrosis or atrophy at the recipient site. A graft that is too thick and wide can cause severe pain, bleeding, and secondary complications such as oral candidiasis and oronasal fistula due to the deep and broad wound at the donor site; at the recipient site, a thick graft can prolong the treatment period by delaying revascularization and can produce an unaesthetic result [15, 16]. Therefore, this study aimed to determine the dimensions of the palatal dense connective tissue available for transplantation and assess the palatal mucosa on histology specimens.
Various complications can reportedly occur after subepithelial connective tissue grafting, such as a cyst and edema forming between the graft and flap at the recipient site, with lining by epithelial cells evident in histological analyses [17, 18]. This indicates that residual epithelium on the graft causes the postoperative complications, which makes it especially important to know the epithelial thickness of the palatal mucosa in order to obtain a uniform LP composed of connective tissue and having the minimum amount of residual epithelium [12].
Previous optical coherence tomography measurements found that the oral epithelium was 0.12 and 0.24 mm thick in the anterior palatal arch region and the hard palate, respectively [13]. In the present study the epithelial thickness was found to decrease from the canine distal (0.41 mm) to the posterior molar tooth, and toward the midpalatal suture. This difference in the epithelial thickness might be due to the spicy and salty diet of the Koreans [12], increased keratinized epithelial layer upon aging [19], and tissue atrophy after formalin fixation during histological preparation [20]. Therefore, there is a need to analyze differences in epithelial thicknesses according to race and age and to increase the number of samples in future studies.
Subepithelial connective tissue grafting is a technique involving the use of the LP, which consists of wedge-shaped collagen fiber bundles that give an inverse bevel apically toward the alveolar bone starting from the 3-mm gingival margin [3]. Therefore, a preoperational evaluation of the thickness of the LP is important for graft success; a previous study found that it is typically 2-4 mm thick and gradually thins from the cementoenamel junction to the midpalatal suture [21]. Other studies have evaluated the whole thickness of the palatal mucosa and have found an overall tendency for this to increase from the canine to the second molar [9, 11, 22]. In contrast, the present study evaluated the palatal mucosa thickness by using the histology sections, thereby making it possible to measure the thickness of the LP that performs the practical function in a transplant (i.e., excluding the epithelium and submucosa layers). The LP was distinctively thick in the canine distal, with its thickness from the first premolar to the first molar remaining uniform at approximately 1 mm. This result differs from those of previous studies, which might be due to the thickness of the epithelium and submucosa layer being included in the previous measurements of the entire palatal mucosa.
There is growing interest in the palatal neurovascular bundle, and there are many different ways to study this structure including Sihler's staining [23], because the palatal mucosa is widely used as an autologous donor material. The GPA is generally located 12.2 mm in the first premolar and 13.1 mm in the first molar, perpendicular to the cementoenamel junction [24]. The present study performed measurements on histology sections according to the lateral branch of the GPA that supplies the palatal gingiva with blood. The GPA was found to be shorter than reported previously, and its length decreased gradually from the first molar (11.28 mm) and sharply at the first premolar (9.21 mm). Therefore, careful consideration is required during any surgical procedure involving the anterior region of the first premolar. In addition, the depth of the GPA decreased from the canine distal to the first premolar but increased toward the posterior region, which indicates an increase in the volume of the gland and adipose tissue in the upper part of the artery.
In conclusion, the LP had a uniform thickness of 1 mm, and the GPA was located 10.72 mm from the alveolar crest and 4.38 mm from the surface of the palatal mucosa in the palatal region between the first premolar and the first molar. Therefore, the LP at approximately 8 mm from the alveolar crest could be a suitable donor site during subepithelial connective tissue grafting that involves taking a dense wedge-shaped piece of connective tissue. The detailed histological assessments of the thickness of epithelium and LP of the palatal mucosa and the location of the GPA reported here are expected to provide useful anatomical guidelines for subepithelial connective tissue grafting.


 XML Download