

 PDF
PDF ePub
ePub Citation
 Print
Print


Introduction
Arsenic is an environmental pollutant of global concern. Inorganic arsenic in polluted drinking water is the chief source of exposure to arsenic in the Ganga-Meghna-Brahmaputra basin of India and Bangladesh [1]. Acute exposure to high concentrations of arsenic is highly toxic and fatal [2]; however, the effects of sustained exposure to lower concentrations are less clearly defined. Arsenic exposure can lead to toxic effects in the nervous, the cardiovascular, the respiratory, the integumentary and the hepatobiliary systems [3]. In the hepatobiliary system, the liver remains the center of metabolic activity during the fetal period and after birth [4]. The profound changes in the environment of the developing liver after birth, in the form of its blood supply, its adaptation to the diurnal rhythm of eating etc., determine cell reorganization and the development of various cyclic processes [5]. In rats, this period of great cellular and functional reorganization corresponds to postnatal days (PND) 9-28; maturation is completed by PND 28 [5]. In humans, it corresponds to the fifth postnatal year [5]. The developing liver is highly vulnerable to endogenous and exogenous insults during this period. The infantile exposure to arsenic has been reported to lead to morbidity in adult life [6-9]. This work reports the effects of postnatal exposure to sodium arsenite on rat livers. Maturation parameters are studied: the conversion of double cell plates to single cell plates [5]; the increase in size of hepatocytes and their nuclei [10] and the centrilobular distribution of lipid droplets [11].
Materials and Methods
Animals
Pregnant female Wistar rats were from the Experimental Animal Facility of the All India Institute of Medical Sciences. The study was approved by the Institute Ethics Committee.
Experimental diet
The animals were provided with a standard rodent diet and drinking water ad libitum. They were maintained on 12-hour light/dark cycles under controlled temperature and humidity.
Experimental design
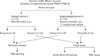
The day of birth of the pups was considered postnatal day zero (PND 0). The mother-reared pups were divided into a control group (I) and an experimental group (II) (n=12/group). They received intraperitoneal injections of double distilled, pyrogen-free, sterile water (group I) or aqueous sodium arsenite (1.5 mg/kg body weight, group II) from PND 9 to 28. The animals were sacrificed on PND 29. During the experimental period, the animals were weighed daily and various developmental signs were noted (eye opening, development of fur, etc.). Each group was further divided into subgroups "a & b" (n=6). The experimental design is summarized in Fig. 1.
The animals of groups Ia and IIa (Fig. 1) were sacrificed under ether anaesthesia followed by trans-cardiac perfusion with 4% paraformaldehyde in 0.1 M phosphate buffer. The liver was dissected out and tissue from the right and the left lateral lobes was further processed for paraffin embedding. Serial sections (7 µm) were cut and stained with hematoxylin and eosin (H&E).
The animals of groups Ib and IIb (Fig. 1) were sacrificed by cervical dislocation under ether anaesthesia and processed for cryosectioning and Sudan Black B (SBB) staining.
Sampling
The pups were randomly assigned to the control or experimental group, each containing 12 pups. These groups were further randomly divided into subgroups, each with 6 pups, for the obtaining of fresh and paraformaldehyde fixed liver tissue post sacrifice.
Biochemical assay
The middle lobe of the liver (fresh unfixed; groups Ib and IIb) was weighed, sliced and homogenized at a final concentration of 20% in water [12]. To 0.5 ml of this homogenate, 20% trichloroacetic acid and 0.6 mM ethylene diaminetetraacetic acid were added to a final volume of 1 ml. This solution was centrifuged (2,000 rev./min for 5 minutes). To 0.2 ml supernatant, was added 2 ml 0.6 mM Ellman's reagent (5,5'-dithiobis-2-nitrobenzoic acid; DTNB) in 0.2 M phosphate buffer (pH 8.0) to a final volume of 3 ml. This was pipetted into a well of an enzyme linked immunosorbent assay plate. Each reaction was carried out in duplicates and the absorption was read at 415 nm against a reagent blank [12] to assay tissue's reduced glutathione content [13].
Histology and histochemistry
H&E and SBB staining procedures were employed.
Animals in groups Ia and IIa (Fig. 1) were anaesthetized with ether before trans-cardiac perfusion with 4% paraformaldehyde in 0.1 M phosphate buffer. The liver was dissected out and tissue pieces from the right and the left lateral lobes were further processed for paraffin embedding. Serial sections (7 µm) were cut and stained with H&E.
Animals in groups Ib and IIb (Fig. 1) were sacrificed by cervical dislocation under ether anaesthesia. Fresh liver tissue from the right and the left lateral lobes were immersion fixed in cold 4% paraformaldehyde in 0.1 M phosphate buffer and further processed for cryosectioning and SBB staining. Briefly, 20 µm thick cryocut sections were dehydrated in ascending grades of ethanol up to 70% and stained with a saturated solution of SBB in 70% ethanol (90 minutes). After washing in 70% ethanol, the slides were immersed in tap water before mounting with glycerine [14-16].
Photomicrography
Sections were observed using a Nikon Eclipse E600 microscope and photographed using a digital camera (DS-Fi1, Nikon, Melville, NY, USA).
Morphometric assessments
The H&E and SBB stained sections were separately morphometrically analyzed. Taxonomy, the counting of uni- and bi-nucleate cells, and nuclear area, and equivalent nuclear diameter, were assessed in groups Ia and IIa. Optical density (OD), a marker of the density of lipid accumulation, was measured in groups Ib and IIb.
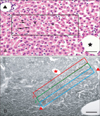
For morphometric analysis of H&E stained sections, digital photomicrographs were captured to measure the area and the equivalent diameter of hepatocytes' nuclei under 40× (pixel size, 0.24 µm/pixel). One randomly chosen section of each sample, incorporating both right and left lateral lobes, and ten randomly chosen fields/sections were considered for measurement, so that a minimum of fifty hepatocytes per sample were measured [17]. Heptatocytes with a prominent nucleolus within the nucleus were considered for measurement [18]. A standard rectangular grid (270×80 µm2) was placed on the section and the uninucleate and binucleate hepatocytes within the measured grid area were counted (Fig. 2A). Cells contacting the left and the lower margins of the grid were not counted.
The SBB stained sections were observed by optical microscopy with image analysis software (NIS-Elements AR 3.1, Nikon). The chosen fields were converted to gray scale of 0 (black)-255 (white). In each field, three rectangular grids of equal area were placed between the central vein and the portal triads in question (half area of a classical liver acinus). The grid areas were numbered 3, 2, 1 from the central vein towards the portal triad (Fig. 2B) [19]. The mean intensity of staining was proportional to the amount of lipid localized in each grid zone. Twenty five such fields were observed for each lobe (left and right lateral) per sample [20] and the gray values were pooled to obtain a mean gray value. For each group, the mean gray value from six animals was taken as the final gray value for the group.
Statistical analysis
The morphometric parameters' mean±SD were computed for each lobe (right and left lateral) of each liver. The values were compared between the control and the experimental groups using Mann Whitney U and Kruskalwallis tests. The mean reduced glutathione levels of the individual samples of each group were treated as clustered data, and their differences were compared between the groups by Mann Whitney U testing. The OD data were subjected to Mann Whitney U testing and Kruskalwallis testing to evaluate the difference in staining intensity on zonal basis, if any, between the control and the experimental animals. SPSS ver. 17 (SPSS Inc., Chicago, IL, USA) was used for the analysis and P<0.05 were considered significant in all the tests.
Results
General features
Various developmental features (ear unfolding, development of fur and spontaneous quadruped walking with the ventral surface of body off the floor) appeared at the scheduled times in both groups of animals. There was no observed difference in the two goups' general activities such as food intake, alertness and movement.
Body weight
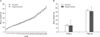
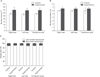
The groups' growth, measured daily by body weight, showed progressive and comparable increases in body weight from PND 1 to 9, before arsenic was first introduced to group II (Fig. 3A). On PND 29 (the day of sacrifice), the body weight of groups I and II, 54.8±13.79 g and 51.8±11.52 g, respectively, had tripled from the values at PND 9 (Fig. 3B). The control group showed a marginally higher weight gain.
No apparent gross abnormality in the liver's shape or lobar pattern was observed in either group.
Microscopic observations (H&E stained sections)
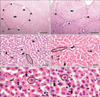
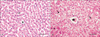
The lobular pattern, with the central vein in the center and the portal triads in the periphery, was clearly evident in both groups (Fig. 4A, B). The radially arranged plates of hepatocytes (with a single nucleus) between the adjacent sinusoids (Fig. 4C) were regular in outline and directed from the central vein of each lobule towards its periphery. The sinusoids, lined by flat endothelial cells and Kupffer cells, appeared somewhat larger in group II (Fig. 4D). The hepatocytes, larger in group II, appeared as large polyhedral cells with acidophilic cytoplasm. The central spherical nucleus, with a sharply outlined nuclear membrane, exhibited large prominent nucleoli and peripherally dispersed chromatin. Binucleate cells were also distributed throughout (Fig. 4E, F). Vacuoles (Fig. 5B) were observed in the hepatocytes near the centrilobular areas; when compared to control group (Fig. 5A); in some of the group II sections, raising the possibility of increased fat deposition in these regions.
Morphometric observations
The hepatocytes' mean nuclear area was 28.32±0.83 µm2 in group I and 34.42±3.28 µm2 in group II. Their mean nuclear diameter was 5.97±0.83 µm in group I and 6.56±0.31 µm in group II. The differences were significant (P<0.05) (Fig. 6A, B). The percentage of uninucleate and binucleate hepatocytes was largely comparable in both groups (Fig. 6C).
SBB stained sections
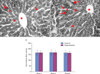
The expression of SBB staining, a measure of lipid droplet distribution, was mostly confined to the cytoplasm of the hepatocytes, with some hepatocytes showing more intense staining (Fig. 7A). The hepatic acinus, the region between a central vein and a nearby portal triad (Fig. 7A, B), was clearly demarcated, showing more intense staining in the zones closer to the central vein in both groups (Fig. 7A, B). The mean gray values for zones (1, 2, 3) between the central vein and the inter-portal triad area [19] from the six animals of each group were largely similar between group I (166.14±24, 167.95±25, and 164.35±24) and group II (166.22±17, 166.58±17, and 163.57±16) (Fig. 7C).
Glutathione (GSH) levels
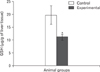
The GSH level of wet liver tissue in group II (11.23±0.98 µg/g) was significantly (P<0.05) less than that in group I (19.72±3.63 µg/g) (Fig. 8).
Discussion
The effects of postnatal exposure (PND 9-28) to sodium arsenite on the hepatic maturation parameters of rats were assessed. The conversion of double cell plates to single cell plates [5]; increases of hepatocyte (nuclear) size [10] and the centrilobular distribution of lipid droplets [11] were measured. PND 28 in rats corresponds to five years' postnatal hepatic development in humans [5], suggesting a similar extrapolation of animal exposure effects to humans. The late fetal, the neonatal and the late suckling period have been identified as periods of enzymatic differentiation in the liver, hence the importance of cytological changes during these periods. Exposure to toxic stimuli during this period of functional and structural heterogeneity can adversely influence various morphological and functional parameters, thereby increasing morbidity.
The observation of no significant difference in body weight between the two groups is in accordance with earlier work [21, 22]. However, decreased body weight of rat pups has been reported subsequent to arsenic exposure (36.7 mg/l) via drinking water from PND 1 to 4 months [23]. This significant decrease likely resulted from higher dosage administer for a longer duration. In another study, no significant difference in adult rats' body weight was observed following exposure to arsenic at 5 mg/kg bw sodium arsenite [24-26]. One work has reported a dose-dependent decrease in the net gain in body weight of adult rats [27] after the inhalation exposure of arsenic trioxide (0.3, 3, and 10 mg/mg). The decrease in weight gain was associated with decreased food consumption. The present study represents a shorter duration (PND 9-28) and a low level (1.5 mg/kg body weight) of exposure to sodium arsenite, hence the observed lack of effect on body weight is not to be unexpected given previous results. As the maturational development of liver is at its peak during this period, the metabolically active cells could be presumed to be able to cope with the additional stress of the environmental insult without manifesting changes in general parameters such as body weight.
Arsenic-induced distortion of liver histology, such as sinusoidal dilatation, cellular edema, megalocytosis, vacuolation and distorted hepatocyte nuclei, have been reported [28] in Indian catfish (Clarias batrachus L.) following exposure to sub-lethal concentrations (0.5 µM) of arsenic. In the present study, the intervening sinusoids appeared wider in group II than in group I, consistent with the above findings. Liver sinusoidal endothelial cells possess specialized filtering functionality. They provide low-pressure, trans-endothelial transport of nutrients and wastes into and out of the liver parenchyma [29]. Progressive inflammatory angiogenesis and blood vessel remodeling of mice livers has been observed following low-level sodium arsenite exposure via drinking water [30-32]. Sinusoidal dilatation has been suggested to represent the early stages of hyperplasia of the sinusoidal lining cells [32]. These previous reports conform to the current observations of an association between exposure and consequences in endothelial cells (sinusoids) determined by dosage and duration of exposure to low levels of arsenic.
The conversion of double to single cell (hepatocyte) plates is an important parameter of hepatic maturation. The initial irregular and thick arrangement of cell plates [5] begins to straighten and thin in the centrilobular region and proceed in a centrifugal manner. Formation of two to five cell thick cords has been reported on gestational day eleven in rat embryos, with the cellular thickness decreasing with further growth [33]. The lowest and highest percentages of single cell plates in rat livers have been observed at PND 8 (16.9%) and 28 (84.6%), respectively [5]. In the present study (PND 29), almost the all plates of hepatocytes were single cell plates in both groups, suggesting that the low dose and short exposure used here may not greatly affect this ongoing maturational event. Exposure to infectious or hepatotoxic agents has been established to be related to the vulnerablity of the hyperplasia of the liver parenchyma. Two-cell thick hepatocytes plates (within the hepatic lobule) and a high nucleo-cytoplasmic ratio is a predominant feature of hepatitis B surface antigen positive adult (human) hepatocytes [34]. This suggests te integration of viral genome into the human DNA (hepatocytes) as the underlying basis for the hyperplasia (increased thickness) of hepatocyte plates [34].
Hepatocyte nuclear diameters in group I of this work were similar (4-6 µm) to those found in other works [35, 36], those in group II were significantly higher. Increased hepatocyte nuclear diameter and volume subsequent to exposure to arsenic in green sunfish has been reported [37]. Changes in hepatocyte nuclear size have also been reported following exposure to other substances. Dose-dependent initial increases from 8.24 to 8.75 µm and a later decrease to 7.34 µm following phenobarbitone exposure (5 consecutive days) has been observed [38] in a work postulating the cytoplasmic and nuclear enlargements were due to increased accumulation of phenobarbital inducing membranes in the cytoplasm and increasing mitotic activity. In other work [39, 40], phenobarbitone-induced liver growth was imputed to hepatocyte enlargement without any influence of nuclear compartment. Studies on human hepatocytes [41-45] have reported normal hepatocyte nuclears diameter of 6.5-7.3 µm, and their enlargement following hepatitis B infection.
Sodium potassium adenosine triphosphatase (Na/K ATPase) has been reported to be responsible for the energy dependent extrusion of sodium ions (Na+) and uptake of potassium ions (K+), an important part of the maintenance of ionic homeostasis [46]. Damage to membrane lipids with impaired Na/K ATPase functioning subsequent to arsenic induced oxidative stress could be important in altering water/ion transport. This could lead to fluid/substances retention in cells and cell swelling. The crippling of cellular transport due to impaired ATP metabolism subsequent to arsenic or 4-hydroxy-2-nonenal (HNE; a lipid peroxidation product) exposure has been suggested [47, 48]. The competitive substitution of arsenate for inorganic phosphate [49], so that the energy generated in kreb's cycle (oxidative phosphorylation) cannot be trapped for ATP synthesis, can compromise cellular energy requirements for the ongoing synthetic processes. A time dependent reduction in hepatic plasma membrane Na/K ATPase activity has been reported in mice exposed to arsenic through drinking water [50]; an arsenic dose dependent induction of lipid peroxidation in rats has also been reported [51]. Besides arsenic, other environmental factors such as nicotine, insulin, and sodium fluoride have been implicated in affecting Na/K ATPase [52-56] and so compromising cellular energy requirements.
In the present study, group I (89.26±0.82%) and group II (90.99±1.77%) showed mainly uninucleate cells with a small remainder of binucleate cells. This is in partial agreement with another study [57], which reported 4.6% of rat hepatocytes as binuclear at day 22 and 27.5% at 25-30 days. Acytokinesis or the defective cytokinesis of mononuclear cells or the fusion of two mononuclear cells was suggested as the cause of the binucleation, which could be important cells in the genesis of tetraploid hepatocytes. Liver cell polyploidation is considered an original physiological process: cells pass through a binucleation step which enables them to increase metabolic output and constitutes an alternative to cell division. The observation of an increased number of binucleate cells following trypan blue injection in guinea pigs suggested increased mitosis as the underlying basis for increased binuclearity [58]. Rats fed high-fat diets have shown higher numerical density of binucleate hepatocytes, presumably as a compensatory response to the decreased number and size of hepatocytes following necrotic changes [59]. In the present study, the observed similarity in the percentage of uninucleate and binucleate cells between the two groups suggests that arsenic exposure at low dosage (1.5 mg/kg body weight) from PND 9-28, might not be influential in altering cells' polyploidy status.
Lipid droplet distribution shows a definitive pattern with age: there is an even distribution of lipid droplets in the centrilobular and periportal areas of newborn mice [11] and their centrilobular localization in growing animals [60, 61]. The adult pattern (more numerous in centrilobular than in periportal hepatocytes) in mice is reached between PND 21 and 24 [11]. Therefore, lipid droplet distribution is an important parameter for evaluating the liver's lipid metabolic function, as an altered pattern suggests altered lipid function, this is in spite of lipid demonstrable in the histological sections being only a part of the hepatic lipid reserves. The observed intense fatty change in the central region of the hepatic lobule in rats after trypan blue injections suggests low oxygen tension in the central part of the lobule interfering with rapid oxidation or phosphorylation of the fat [62]. The observation of more intense staining (SBB) in zone 3 (centrilobular) than in zone 1 (periportal) was suggestive of no modification of the adult pattern of lipid droplet distribution following the exposure to arsenic-administered in this study. The formation of a fatty liver as a later development in arsenic induced toxicity, rather than reduced levels of glutathione present at an earlier period is interesting [50]. Mixed patterns of steatosis (microvesicular and macrovesicular) in the liver biopsies of hepatitis C virus patients with the fat globules initially formed in zone 3 and then coalesced to form large droplets (macrosteatosis) with associated fibrosis [20]. Microvesicular steatosis implies the presence of mitochondrial dysfunction and oxidative stress [63]. Sporadic degeneration with cytoplasmic vacuolation and necrosis in adult rat hepatocytes treated with either alcohol or arsenic points to the direct hepatotoxic effects of both; the coadministration of alcohol and arsenic also significantly increased hepatocyte degeneration and vacuolation, suggesting a synergistic hepatotoxicity [64].
The initiation of oxidative stress following exposure to hepatotoxic agents is an important factors underlying chronic liver diseases associated with fibrosis. Disturbed membrane molecular properties through damage to such as membrane lipids, building blocks of proteins (amino acids), sugars (carbohydrates) and nucleic acids, is likely the primary factor of chemical induced hepatocellular injury. The liver is the center of metabolism of various chemicals including inorganic arsenic in a number of animals including mammals [65] and reduced GSH in hepatocytes acts as a vital antioxidant. It is present at high concentrations (7-8 µM) in the liver tissue [66]. The significant decrease in GSH level in group II of the present study suggests the arsenite induced impairment of cellular antioxidant defense. Significant reduction in hepatic GSH has been reported in animals receiving sodium meta-arsenite (25 ppm) in drinking water (24 weeks) [67]. Reduced GSH in the liver tissue of rats treated with arsenic trioxide was reversed by the administration of ascorbic acid, suggesting the role of antioxidants in ameliorating arsenic induced oxidative stress [68].
Arsenic's imbalancing of redox systems is also associated with its role as a potent inhibitor of glutathione reductase. Animals fed arsenic have been reported to show reduced levels of hepatic GSH with decreased enzymes of GSH regeneration, suggesting that arsenic induced exacerbation of toxic effects with depleted GSH levels in the liver [50]. GSH is essential for the reduction of arsenic (V) to arsenite (III) in protecting the cell against more toxic inorganic forms [69]. The biochemical observations of the present study indicate impairment of hepatocytes' GSH related antioxidant capacity due to arsenic exposure which in turn could lead to liver function derangement manifesting at a later age.
Biochemical and morphological evidence of arsenite induced hepatotoxicity was observed in developing rat livers. The evidence was reduced levels of GSH (leading to increased oxidative stress), increased size of hepatocyte nuclei, sporadic vacuolation of hepatocyes and sinusoidal dilatation in the animals administered arsenic. To understand the exact mechanisms underlying arsenic induced toxicity at cellular and molecular levels, broader studies using various dosages of sodium arsenite and varied durations of exposure at different developmental periods should be considered.


 XML Download