

 PDF
PDF ePub
ePub Citation
 Print
Print


Introduction
Arginine vasopressin (AVP) is synthesized in magnocellular neurons of the paraventricular nucleus (PVN), and in the supraoptic nucleus (SON) of the hypothalamus, and is then transported axonally and released into the systemic circulation from nerve terminals in the posterior pituitary. AVP is a neuropeptide that has vasoconstrictive, antidiuretic, cardiovascular regulatory and other behaviors including affecting learning [1-3].
Several studies have investigated hypertension regulation using spontaneously established animal model systems, such as, stroke-prone spontaneously hypertensive rats (SHRSP) or a spontaneously hypertensive rat (SHR) in association with AVP. Moreover, AVP has been found to be strongly related to arterial blood pressure regulation in various experimental settings [4-8]. However, it has not been understood how AVP is regulated in the hypothalamic region in SHRSP rats. These rats characteristically show a continuous increase in aortic blood pressure and usually die before they are 40 weeks old from cerebral hemorrhage or heart failure [9]. In addition, several investigations on AVP regulation have associated metabolic diseases like diabetes mellitus, and age related changes in AVP have been well demonstrated in other animal models [10-14]. However, little is known about the relationship between AVP and hypertension in brain with respect to age. In order to determine the nature of the relationship between AVP and hypertension, we examined pre-hypertensive rats, i.e., at postnatal month (PM) 1, and post-hypertensive rats at PM 8 and 12.
In this study, we investigated age-related morphology, AVP immunoreactivity and its mRNA expressional changes in the hypothalamic PVN and SON.
Materials and Methods
Experimental animals and check of blood glucose level
Male SHRSPs were obtained from the Experimental Animal Center, Hallym University, Chuncheon, Korea. PM 1 (n=10), PM 8 (n=10), and PM 12 (n=10) rats in each strain were housed in a conventional state under adequate temperature (23℃) and humidity (60%) control with a 12-hour light/12-hour dark cycle, with free access to food and water. We adhered to the procedures for handling and caring for the animals as per the NIH Guide for the Care and Use of Laboratory Animals (NIH publication No. 85-23, 1985, revised 1996).
All the experiments were conducted to minimize the number of animals used and the suffering caused by the procedures. The blood glucose levels of animals were checked with a validated one touch basic glucose measurement system.
Cresyl violet (CV) staining
To observe the overall morphology of PVN and SON, SHRSP rats in PM 1, PM 8, and PM 12 group (n=5 at each time point) were used for CV staining. In brief, the sections were mounted on gelatin-coated microscopy slides. CV acetate (Sigma, St. Louis, MO, USA) was dissolved at 1.0% (w/v) in distilled water, and glacial acetic acid was added to this solution. Before and after staining for 2 minutes at room temperature, the sections were washed twice in distilled water. The fixed brain tissues were dehydrated by immersion for 2 hours in 50%, 70%, 80%, 90%, 95%, and 100% ethanol baths in succession at room temperature. After dehydration, the sections were mounted with Canada balsam (Kanto Chemical, Tokyo, Japan).
Immunohistochemistry
An immunohistochemistry was performed under the same conditions for each group. Sections were treated with 0.3% hydrogen peroxide (H2O2) in phosphate buffered saline (PBS) for 30 minutes and then 10% normal goat serum in 0.05 M PBS for 30 minutes. They were then incubated with diluted rabbit anti-AVP antibody (1 : 2,000, Phoenix Pharmaceuticals, Belmont, CA, USA) overnight at room temperature and then exposed to biotinylated goat anti-rabbit IgG and streptavidin peroxidase complex (1 : 200, Vector, Burlingame, CA, USA). Sections were then visualized by staining with 3,3'-diaminobenzidine in 0.1 M Tris-HCl buffer (pH 7.2), and then mounted on gelatin-coated slides then dehydrated. A negative control test was carried out using pre-immune serum instead of the primary antibody in order to establish the specificity of immunostaining. The tissue in negative control contained no AVP immunoreactivity in any structure.
RNA isolation and quantitative real-time PCR (RT-qPCR) for AVP
The instruments used were treated with anti-RNase free solution. The skull was accessed aseptically and brains removed. A brain matrix was used to isolate the hypothalamic section which was dissected out using anatomical landmarks (medial to optic tract, and ventral to the mammillothalamic tract). Frozen hypothalami were homogenized and total RNA was isolated using a PureLink Micro-to-Midi total purification system (Invitrogen, Carlsbad, CA, USA) according to the manufacturer's instructions.
Reverse transcriptase and PCR procedures were carried out separately. A qPCR was performed using SYBR Green kit (Applied Biosystems, Warrington, UK) for AVP. RT-qPCR analysis of the mRNA expressions was carried out in a Stepone (Applied Biosystems, Foster City, CA, USA) sequence detector system 40 times with a 94℃ denaturation of 15 seconds, and annealing at 60℃ for 1 minute, The used primers for AVP and β-actin are F: 5'-CAG ATG CTC GGC CCG AAC-3'/R: 5'-TTC CAG AAC TGC CCA AGA-3' and F: 5'-TTG CTG ACA GGA TGC AGA A-3'/R: 5'-ACC AAT CCA CAC AGA GTA CTT-3' [15], respectively. The data were collected and analyzed using OneStep soft ware (Applied Biosystems). Relative determination of the CT values for references and target genes in each was set according to the 2-ΔΔCT method described by the manufacturer.
Quantification of data and statistical analysis
All measurements were performed to ensure objectivity under blind conditions, by two observers per experiment, who performed analyses using identical conditions.
In order to quantitatively analyze AVP immunoreactivity, the corresponding PVN and SON areas were measured using in total 10 sections per animal. Images of all AVP immunoreactive structures were taken using a BX51 light microscope (Olympus, Tokyo, Japan) equipped with a digital camera (DP71, Olympus) connected to a PC monitor. Individual images were of 512×512 pixels (256 gray levels), which corresponded to a tissue area of 140×140 µm (40× primary magnification). The number of AVP immunoreactive neurons in all groups were measured using an image analyzing system equipped with a computer-based CCD camera (soft ware: Optimas 6.5, CyberMetrics, Scottsdale, AZ, USA). The number of CV positive neurons of PM 8 and PM 12 were compared to those of PM 1.
The data shown represents the experimental mean±standard error (SE) for each experimental area. The difference between means were analyzed using a repeated two-way analysis of variance followed by Duncan's new multiple methods to determine differences between experimental groups. Statistical significance was considered below P<0.05.
Results
CV staining
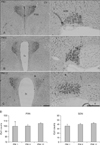
In PM 1, PM 8 and PM 12 groups, CV positive neurons in PVN and SON appeared structurally normal (Fig. 1), and compact CV positive neurons were observed in the lateral magnocellular area of the PVN. However, small neurons were stained by CV at low density in the medial parvocellular area of the PVN. In the SON, many CV positive neurons were detectable. The distributions of CV positive neurons in the SON were similar regardless of age. However, the ventricle was morphologically different in the PM 1, PM 8, and PM 12 groups. In the PM 1 group, the 3rd ventricle was narrower than in the PM 8 and 12 groups (Fig. 1).
Blood glucose level
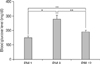
The blood glucose levels after fasting were 150.8±8.9 mg/dl (means±SE), 277.8±30.9 mg/dl and 189.4±11.8 mg/dl in the PM 1, PM 8, and PM 12 groups, respectively (Fig. 2). The PM 8 group had the highest blood glucose level. Significant differences were observed between blood glucose levels in the PM 1 and PM 8 groups (P<0.005) and in the PM 1 and PM 12 (P<0.01). In addition, blood glucose levels were also significant different in the PM 8 and PM 12 groups (P<0.05).
Immunohistochemistry
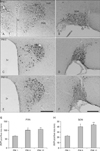
In the PVNs, mean numbers of AVP-positive neurons were 64.7±2.60 in the PM 1 group, 100.0±3.21 in the PM 8 group, and 105.0±1.53 in PM 12 group (Fig. 3A, C, E), and significant differences were observed between the PM 1 and PM 8 groups (P<0.01) and between the PM 1 and PM 12 groups (P<0.01) (Fig. 3G). However, no significant difference was observed between the PM 8 and PM 12 groups (Fig. 3G).
In the SONs, the mean numbers of AVP-positive neurons were 22.0±1.73 in the PM 1 group, 40.3±1.86 in the PM 8 group and 43.3±1.76 in the PM 12 group (Fig. 3B, D, F). As was observed in the PVN, significant differences for SON were found between the PM 1 and PM 8 groups (P<0.01) and between the PM 1 and PM 12 groups (P<0.01) (Fig. 3H). As well, no significant differences were observed between the PM 8 and PM 12 groups (Fig. 3H).
Changes in AVP mRNA levels
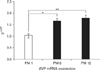
AVP mRNA expression levels in the hypothalamus of the PM 1, PM 8, and PM 12 groups are shown in Fig. 4. Changes in AVP mRNA expression values are expressed in 2-ΔΔCT for the three groups. These were 1.02±0.088, 1.65±0.12, and 1.78±0.13, respectively. Significant differences were observed between the PM 1 and PM 8 groups (P<0.05) and between the PM 1 and PM 12 groups (P<0.01), but no significant difference was observed between the PM 8 and the PM 12 groups.
Discussion
SHRSP is a representative genetic model of cerebrovascular disease, a major cause of premature death [16], which can be classified into several types in humans. Intracerebral hemorrhage, atherothrombotic infarction, and lacunar infarction have reported that they are similar to SHRSP [17, 18]. Blood pressure in SHRSP is higher than that in SHRs [19] and these two strains differ in terms of stroke susceptibility due to an "extra" hypertensive gene and other factors that make SHRSP rats more susceptible to stroke [16]. Hyperlipidemia with hypertension is also an important risk factor for cardiovascular and cerebrovascular diseases, and is believed to cause vascular damage and progression to the hypercoagulative state [20]. In the present study, we chose PM 1, PM 8, and PM 12 SHRSP rats. The PM 1 group represented the pre-hypertensive phase, PM 8 the established hypertensive phase, and PM 12 the established hypertensive and middle aged phase [21]. Immunoreactivities and mRNA expressions of AVP as determined by immunohistochemistry and RT-qPCR gradually increased with age, although no significant differences were observed between the PM 8 and PM 12 groups. However, blood glucose levels increase to PM 8, and then reduced at PM 12. A number of studies about the relationship between diabetes mellitus and the AVP expression report that the pathological hyperglycemic conditions in animals showed a high expression of AVP compared with that of normal animals [22-25]. Accordingly, the AVP expression level might be expected to be dependent by dynamic changes of blood glucose levels, and the high AVP expression levels itself might not be necessary condition for making blood glucose level high. Küchler et al. [26] reported that AVP does not alter insulin-stimulated phosphorylation or glucose uptake in adipocytes. This study might provide clues to indicate that AVP does not influence the direct effect for regulating blood glucose by itself but cannot exclude indirect effects. Since the reason for this reduction in blood glucose levels in the middle aged group is not known so far, further studies are required to elucidate the issue.
Several studies have shown that AVP up-regulated in the diabetic brain [17, 27, 28]. Diabetes mellitus is known to be strongly associated with hypertension, which explains the up-regulation of AVP observed in the present study [11, 29]. Moreover, it has been reported that blood-brain barrier (BBB) permeability is increased by hypertension and diabetes [30-33]. Ischemia-induced edema originating from brain damage, such as, BBB disruption in stroke and hydrocephalic and vasogenic edemas in peri-infarcted hippocampal formation, is due to increased Na and Cl transport, and in addition, AVP also promotes brain edema [34, 35]. CV staining showed that the third ventricles were wider in the PM 8 and PM 12 groups than in the PM 1 group. In the PM 1 group, the third ventricles were tightly closed, whereas in the PM 8 and PM 12 groups, ependymal cells appeared to have been damaged. These morphological changes might also have been caused by an increased influx of cerebral fluid and vulnerability of BBB due to hypertension.
The results of the present study also show that AVP expression in brain is gradually elevated according to the degree of hypertension. In addition, this finding suggests that AVP up-regulation may induce blood fluid influx and edema formation.
 XML Download