Abstract
Objective
To determine whether different weight percentiles influence the clinical characteristics and growth in appropriate for gestational age preterm infants.
Methods
We collected data retrospectively on preterm infants (n=176; gestational age <35 weeks; birth weight <2,500 g) admitted to neonatal intensive care unit from March 2009 to August 2010. Infants were divided according to birth and weight loss percentile during the admission period.
Results
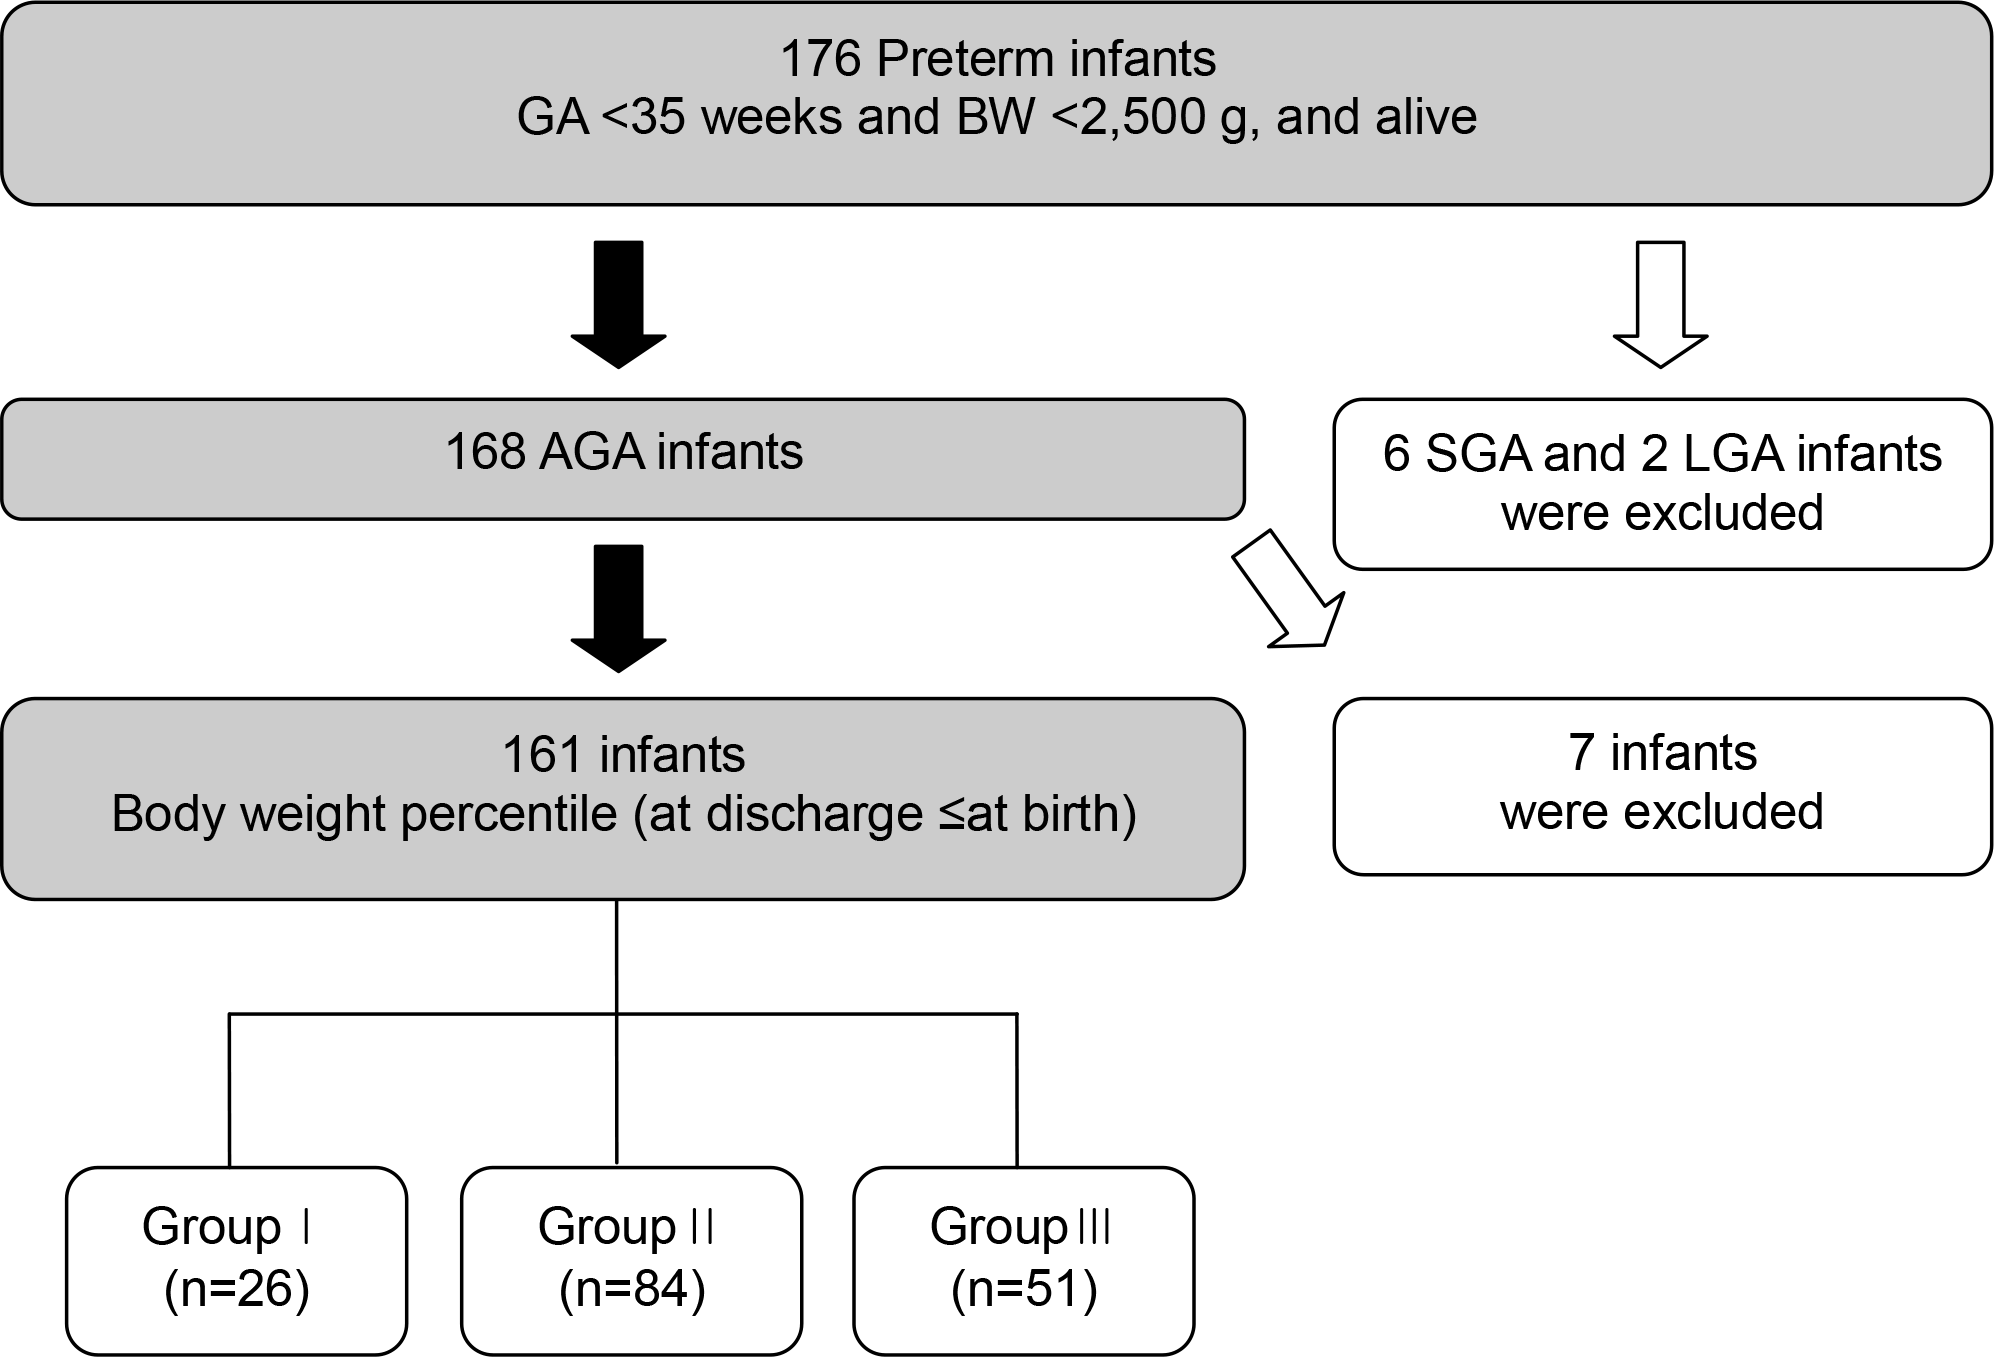
A total of 161 infants were included in the study. Study data showed that the birth percentiles of 135 (84%) infants decreased at discharge and the rest 26 (16%) remained the same. Female infants were discharged at a significantly lower weight percentile than male. Infants with high birth weight percentile had a reduced weight percentile at discharge. For the infants with decreased weight percentile at discharge the length of birth weight recovery was longer and the maximal weight loss was greater (P<0.05). And considering their weights at discharge, these infants also showed a statistically higher percentage of extrauterine growth restriction.
Conclusion
Even though infant's weight is appropriate for gestational age, premature infants possibly fail to keep up with their birth weight percentile and show extrauterine growth restriction at discharge. Therefore, we should make more efforts to prevent postnatal growth failure for the appropriate growth.
REFERENCES
1). Ehrenkranz RA., Dusick AM., Vohr BR., Wright LL., Wrage LA., Poole WK. Growth in the neonatal intensive care unit influences neurodevelopmental and growth outcomes of extremely low birth weight infants. Pediatrics. 2006. 117:1253–61.

2). Lemons JA., Bauer CR., Oh W., Korones SB., Papile LA., Stoll BJ, et al. Very low birth weight outcomes of the National Institute of Child health and human development neonatal research network, January 1995 through December 1996. NICHD Neonatal Research Network. Pediatrics. 2001. 107:E1.
3). Embleton NE., Pang N., Cooke RJ. Postnatal malnutrition and growth retardation: an inevitable consequence of current recommendations in preterm infants? Pediatrics. 2001. 107:270–3.

4). Nakagawa H., Iwasaki S., Kichikawa K., Fukusumi A., Taoka T., Ohishi H, et al. Normal myelination of anatomic nerve fiber bundles: MR analysis. AJNR Am J Neuroradiol. 1998. 19:1129–36.
5). Lubchenco LO., Hansman C., Boyd E. Intrauterine growth in length and head circumference as estimated from live births at gestational ages from 26 to 42 weeks. Pediatrics. 1966. 37:403–8.

6). Latal-Hajnal B., von Siebenthal K., Kovari H., Bucher HU., Largo RH. Postnatal growth in VLBW infants: significant association with neurodevelopmental outcome. J Pediatr. 2003. 143:163–70.

7). Franz AR., Pohlandt F., Bode H., Mihatsch WA., Sander S., Kron M, et al. Intrauterine, early neonatal, and postdischarge growth and neurodevelopmental outcome at 5.4 years in extremely preterm infants after intensive neonatal nutritional support. Pediatrics. 2009. 123:E101–9.

8). Cooke RW. Are there critical periods for brain growth in children born preterm? Arch Dis Child Fetal Neonatal Ed. 2006. 91:F17–20.

9). Polin RA., Abman SH., Rowitch D., Benitz WE. Fetal and neonatal physiology. 5th ed.Philadelphia: Elsevier, Inc.;2016. p. 258–1085.
10). Zambrano E., Bautista CJ., Deás M., Martínez-Samayoa PM., GonzálezZamorano M., Ledesma H, et al. A low maternal protein diet during pregnancy and lactation has sex- and window of exposure-specific effects on offspring growth and food intake, glucose metabolism and serum leptin in the rat. J Physiol. 2006. 571(Pt 1):221–30.

11). Nguyen TM., Crowther CA., Wilkinson D., Bain E. Magnesium sulphate for women at term for neuroprotection of the fetus. Cochrane Database Syst Rev. 2013. 2:CD009395.

Fig. 1
Flowchart of the preterm infants’ group by weight percentile at birth and discharge. GA, gestational age; BW, birth weight; AGA, appropriate for gestational age; SGA, small gestational for age; LGA, large for gestational age.

Fig. 2
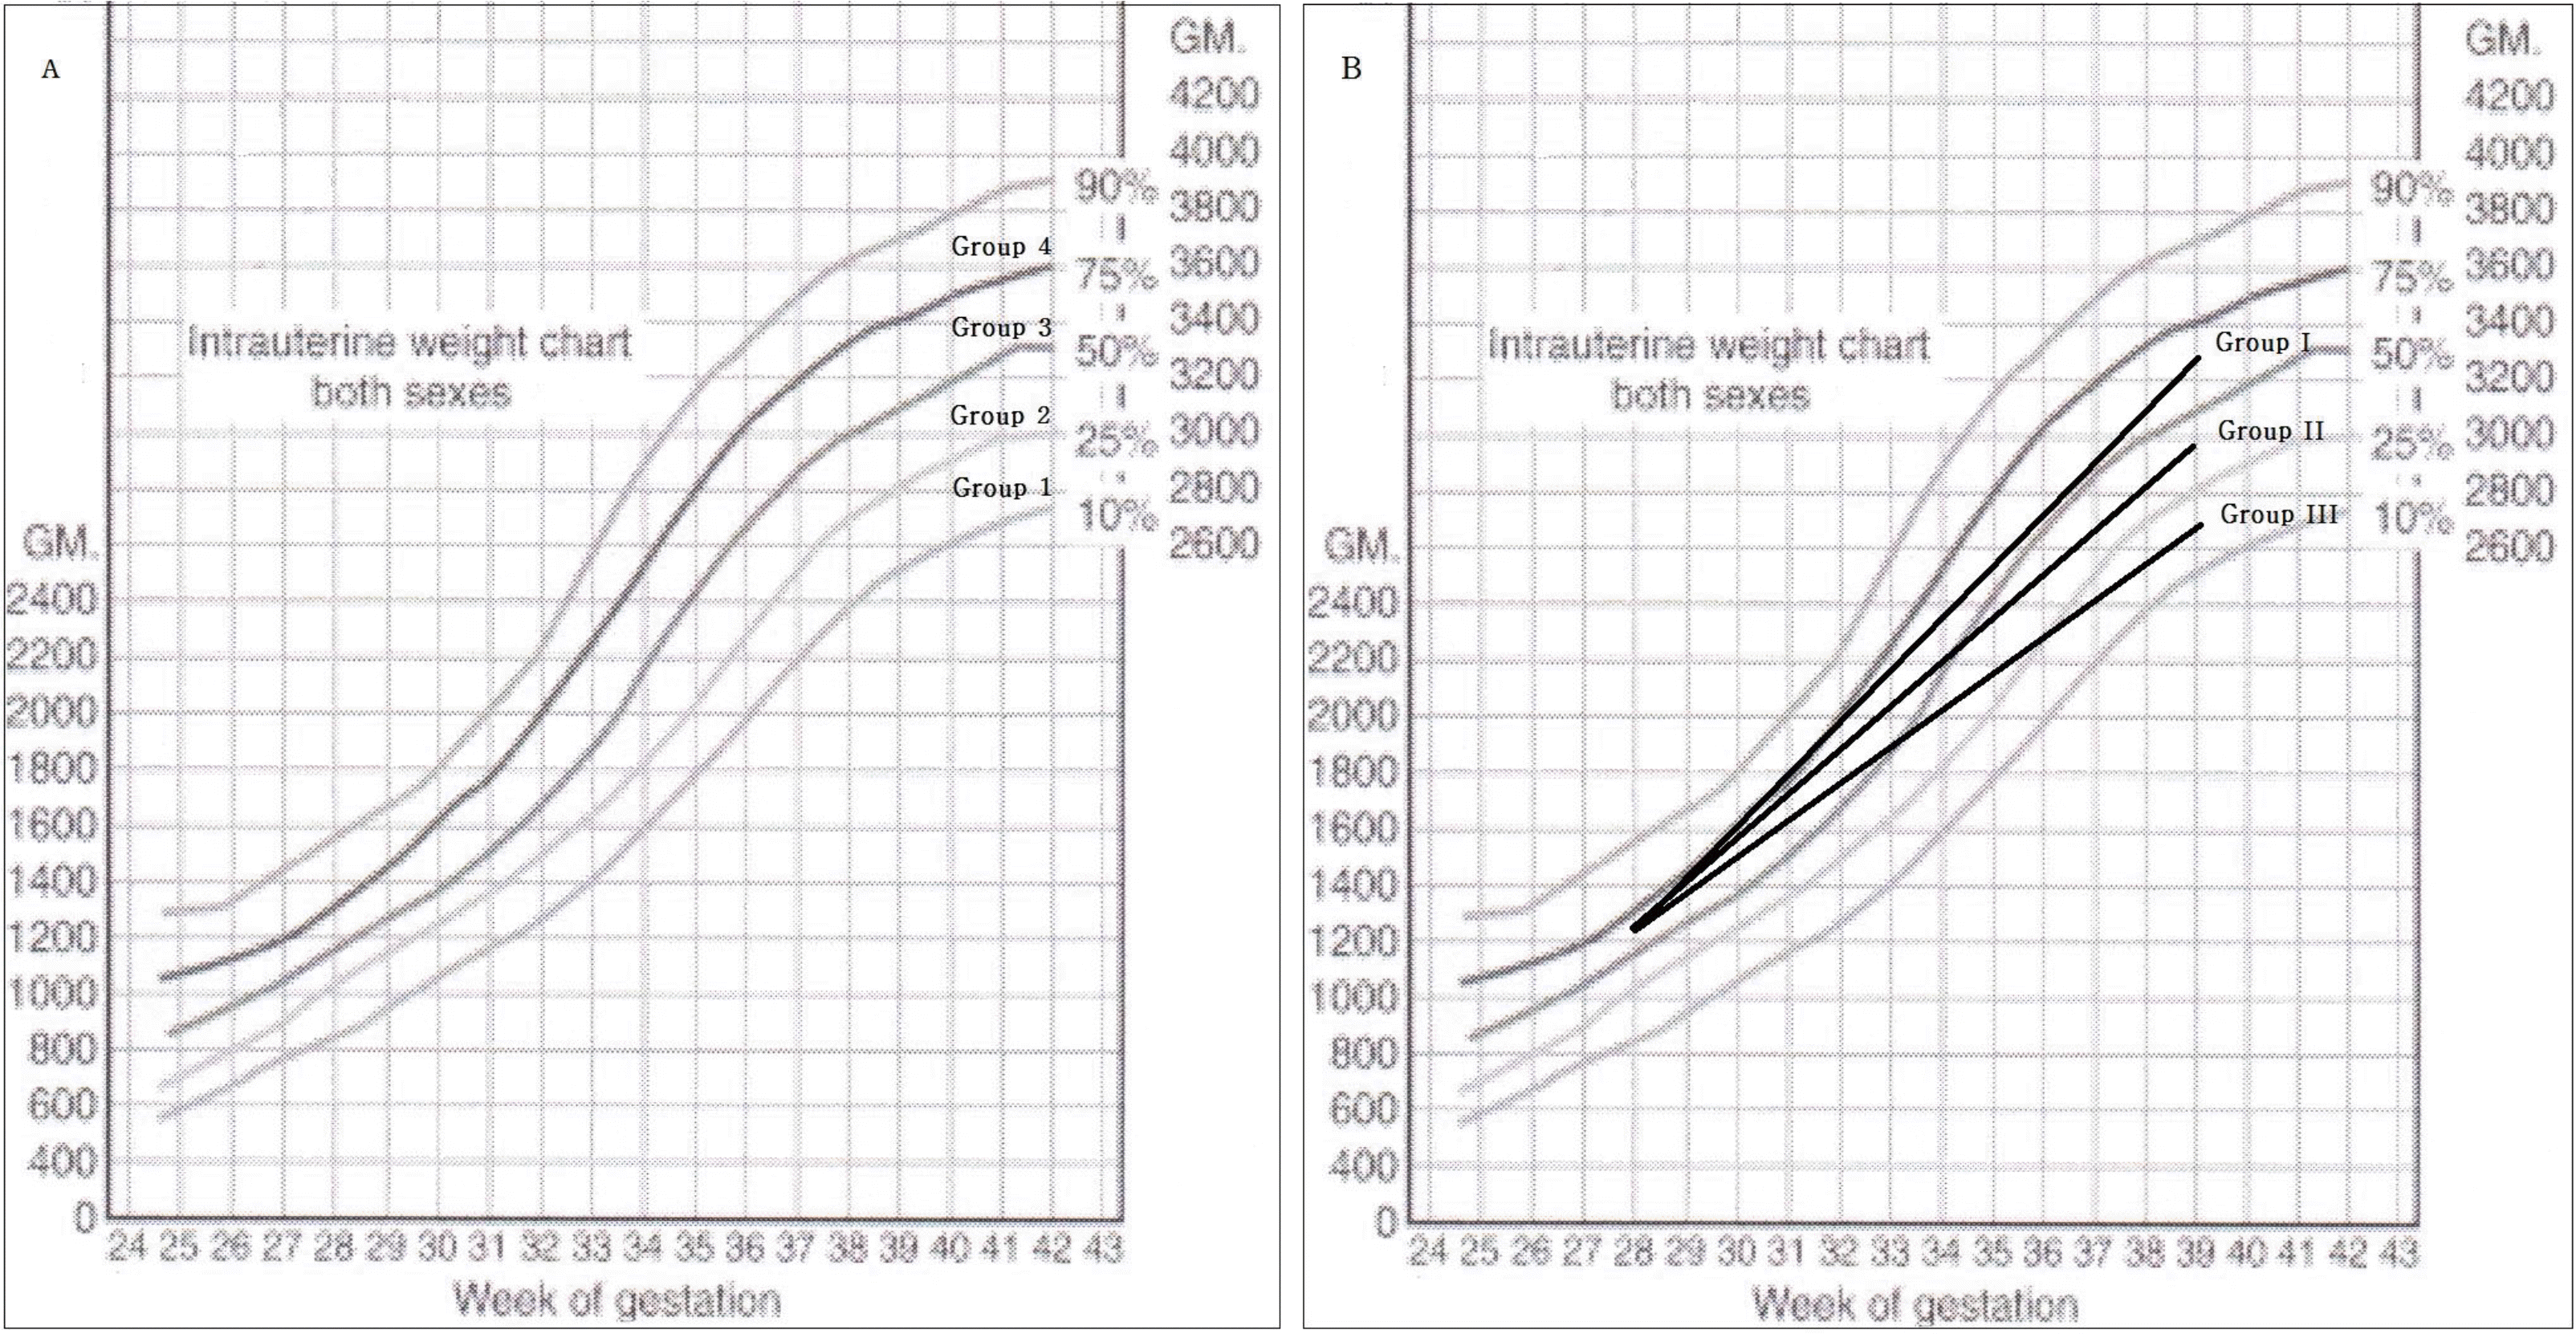
Group classification according to (A) weight percentiles of intrauterine growth and (B) different weight percentile between birth and discharge.

Table 1.
Clinical Features among Groups
Table 2.
Obstetric Factors among Groups
| Group I (n=26) | Group II (n=84) | Group III (n=51) | P-value | |
|---|---|---|---|---|
| C-sec delivery | 18 (69) | 57 (68) | 34 (67) | 0.974 |
| Multiple birth | 9 (35) | 26 (31) | 16 (31) | 0.939 |
| Antenatal antibiotics | 9 (35) | 40 (48) | 27 (53) | 0.312 |
| Antenatal steroid | 20 (77) | 52 (62) | 41 (80)∗ | 0.054 |
| Antenatal MgSO4 | 2 (8) | 10 (12) | 0 (0) | 0.038 |
| IVF | 3 (12) | 7 (8) | 4 (8) | 0.850 |
| PIH | 1 (4) | 7 (8) | 4 (8) | 0.742 |
| GDM | 0 (0) | 4 (5) | 2 (4) | 0.532 |
| Chorioamnionitis (clinical) | 2 (8) | 18 (21) | 14 (27) | 0.132 |
| PROM ≥24 hours | 8 (31) | 23 (27) | 18 (35) | 0.625 |
Table 3.
Factors Associated with Growth among Groups
Table 4.
Characteristics between Two Groups Divided by the 50th Percentile Birth Weight
Values are presented as mean±standard variation or number (%). Abbreviations: GA, gestational age; BW, birth weight; IVF, in vitro fertilization; PIH, pregnancy induced hypertension; GDM, gestational diabetes mellitus; PROM, premature rupture of membranes; RDS, respiratory distress syndrome; BPD, bronchopulmonary dysplasia; TPN, total parenteral nutrition; EUGR, extrauterine growth restriction.


 PDF
PDF ePub
ePub Citation
 Print
Print


 XML Download