

 PDF
PDF ePub
ePub Citation
 Print
Print


INTRODUCTION
Arterial spin labeling (ASL) is a safe and noninvasive technique for measuring cerebral blood flow (CBF). ASL can be repeatedly used in patients or research subjects because it only utilizes blood in the body without adding radiopharmaceutical or contrast agent (12). Owning to recent development of high magnetic field equipment and advanced imaging technology, ASL has been used as an imaging tool to understand the pathophysiology of various brain disorders (34). Recently, with improved signal to noise ratio (SNR) and spatial resolution such as pseudo-continuous technique, ASL can also be applied to functional magnetic resonance imaging (fMRI) study (5). Up to date, blood oxygenation level-dependent (BOLD) technique has been established as a standard method for fMRI study. However, BOLD technique has limitation in routine clinical practice for patients with acute stroke or moderate to severe brain illness because it needs additional scanning.
The purpose of this paper was to describe technical methods for fMRI study, compare ASL and BOLD techniques, and discuss the potential of ASL for research and clinical practice.
MATERIALS AND METHODS
Subjects
One female and 20 male volunteers were recruited for this study. The female was 22 years old. The mean age of the 20 males was 33 years (range, 21 to 42 years). They had no particular medical or psychiatric problem. The female participated in task-based fMRI (tb-fMRI) while all males participated in resting state fMRI (rs-fMRI). After explaining the study concept and procedures, written informed consent was obtained from all subjects according to our Institutional Review Board guidelines.
MR Image Acquisition
Images were acquired with a 32-channel sense head coil with a 3.0 Tesla MR Scanner (Ingenia, Philips Medical Systems, Best, the Netherlands). Basic imaging conditions for BOLD were as follows: gradient echo planar imaging (EPI) sequence, repetition time (TR) = 4000 ms, echo time (TE) = 30 ms, field of view (FOV) = 220 × 220 mm2, slice thickness = 6 mm with 10% gap, 20 slices, dynamic scans = 100, and total scan duration = 6 min 49 s. Imaging conditions for ASL were: single-shot gradient echo EPI sequence, pseudo-continuous arterial spin labeling (pCASL), TR = 4000 ms, TE = 12 ms, FOV = 220 × 220 mm2, slice thickness = 6 mm with 10% gap, 20 slices, dynamic scans = 50, label duration = 1650 ms, post label delay = 1600 ms, and total scan duration = 6 min 49 s. For 3D T1, the follow conditions were used: turbo field echo pulse sequence, TR = 8.3 ms, TE = 3.9 ms, slice thickness = 1 mm, and FOV = 220 × 220 mm2.
For tb-fMRI, functions were measured by tapping of the right finger using a block design (active = 5 block / rest = 5 block, 1 block = 10 dynamics for BOLD / 5 dynamics for ASL).
Post-Processing of tb-fMRI Data
Functional images of BOLD and ASL were preprocessed using statistical parametric mapping (SPM8) operated in Matlab (MathWorks, Natick, MA, USA). Realignment was done to compensate subject's movement during scanning. As functional data had a low resolution, co-registration was performed using 3D T1 images obtained alongside to precisely determine anatomical positions. After smoothing with 6 mm full-width at half-maximum Gaussian kernel, normalization into standard Montreal Neurological Institute (MNI) space was also done. For ASL data, perfusion-weighted image series were generated by pairwise subtraction of control image and label image. Using General Linear Model (GLM), voxel-wise analysis was applied to ASL perfusion-weighted images and BOLD images to compare task condition with resting baseline. Areas of significant activation were identified at cluster level with a threshold of P < 0.05, family-wise error corrected for multiple comparisons (BOLD [height threshold T= 5.695] and ASL [height threshold T = 5.435]). Functional images were co-registered with anatomic MR images to identify the precise location of activated areas.
Post-Processing of rs-fMRI Data
Rs-fMRI was conducted using data processing assistant for rs-fMRI (DPARSF, http://rfmri.org) (6). Concurrent BOLD data were firstly extracted from ASL data by regressing out the spin labeling paradigm [1, -1 … 1, -1] from the control/label image series (5). Data were then processed in the same manner as tb-fMRI. Additionally, following spatial normalization and smoothing, to eliminate trends generated by noises from breathing, heartbeats, and pulses during rs-fMRI, de-trending and nuisance regression were performed and low-frequency bands reflecting voluntary neural activity were extracted using band-pass filtering. Functional connectivity was measured by obtaining the time course after setting the sensorimotor cortex as ROI with seed method followed by correlating the time course with the time course obtained in voxel other than ROI using voxel-wise way method to generate sensorimotor network (SMN). The functional connectivity map was then converted into z-map using Fisher's r-to-z transformation to improve normality.
RESULTS
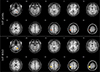
In tb-fMRI study, the primary motor cortex of the contralateral cerebral hemisphere and the ipsilateral cerebellum were activated on both BOLD and ASL perfusion fMRI studies (Fig. 1). However, the peak signal intensity (BOLD = 15.8704, ASL = 5.2857) and cluster size (BOLD = 386, ASL = 200) of the primary motor cortex were higher and larger in BOLD than those in ASL fMRI. On the other hand, ASL showed more localized function than BOLD.
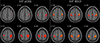
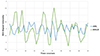
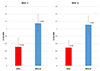
In the rs-fMRI study, the functional connectivity of SMNs showed similar results in BOLD and ASL (Fig. 2). For time courses, ROI signal intensity at seed points showed higher fluctuation in BOLD than that in ASL (Fig. 3). Mean Z scores of the sensorimotor cortex were also higher in BOLD (right = 1.1483 ± 0.2423, left = 1.1087 ± 0.2381) than those in ASL (right = 0.5101 ± 0.2423, left = 0.4930 ± 0.1827). The difference was statically significant (P = 0.001, Wilcoxon signed-rank test) (Fig. 4).
DISCUSSION
Task-Based fMRI
Due to its high sensitivity to detecting areas with neural activity, BOLD contrast has been widely used for functional mapping of activated brain regions during various tasks such as sensorimotor or cognition. However, BOLD signal indirectly measures neural activity because it reflects changes in blood flow, blood volume, and consumption of oxygen, thus offering limited spatial specificity to the site of neuronal activity due to contribution of draining veins. The baseline drift effect of BOLD can also be a limitation for tb-fMRI study, especially for evaluating low task frequency function such as mood changes or drug effects (78).
Although drawing less attention than BOLD fMRI, ASL perfusion fMRI has several advantages. As ASL utilizes magnetically labeled arterial blood water as a magnetic tracer, it provides a direct measure for arterial blood perfusion which refers to the delivery of oxygen and nutrients into neural tissues (78). In the present study, although it was performed in a single subject, we evaluated hand motor function with both BOLD and ASL techniques and obtained identical activation areas. However, BOLD showed higher signal strength and larger cluster size than ASL, whereas activation areas were more localized in ASL than those in BOLD, consistent with results of Kallioniemi et al. (8).
Second, ASL is particularly useful for longitudinal and multisite studies because it has high reproducibility among individuals with the absence of low task-frequency drift but with high local functional contrast. The drift effect can be minimized in ASL perfusion contrast primarily as a result of successive pairwise subtraction of adjacent control and label images. ASL also has less inter-subject variability in task activation compared to BOLD contrast (7). Fleisher et al. (9) have compared BOLD and ASL techniques among individuals with or without risk for Alzheimer's disease (AD). The risk group was found to have elevated level of resting perfusion with decreased fractional BOLD and perfusion responses to the encoding task. However, there was no difference in absolute cerebral blood flow during the task. They concluded that individuals with risk for AD had elevated resting cerebral blood flow which significantly contributed to apparent differences in BOLD activations. Therefore, BOLD activations should be interpreted with caution. They do not necessarily reflect differences in neuronal activation.
Resting State fMRI
Rs-fMRI allows indirect measurement of neural activity. It requires less cooperation from patients and lower demands for neural activity stimulation compared to conventional tb-fMRI. Rs-fMRI obtains images only during the resting period by excluding dynamic state. Thus, there has been a recent growing interest in rs-fMRI because tb-fMRI has a limitation in that it requires cooperation and ability of participants for paradigm performance.
As in tb-fMRI, the majority of rs-fMRI studies have employed BOLD contrast. Recently, several researchers have attempted to investigate the functional network of resting state brain using ASL technique. There are two main methods for rs-fMRI study using ASL. One is concurrent BOLD. The other is CBF-based (510). Concurrent BOLD uses BOLD contrast inherent in ASL data. In theory, it is the same as conventional BOLD. In the present study, we evaluated SMN in resting state with conventional BOLD and concurrent BOLD in ASL and both techniques showed similar results. However, conventional BOLD revealed higher maximum signal strength values than ASL, This might be due to differences in BOLD contrast between conventional BOLD technique and concurrent BOLD in ASL sequence. Conventional BOLD sequence is optimized for BOLD contrast, whereas ASL is optimized for perfusion measurement.
The ASL CBF time series may be also useful for resting brain activity analysis. As BOLD is affected by macrovascular effects, CBF can reflect activity better in tissue capillary bed. Therefore, ASL CBF might be a more precise approach to measure differences in resting brain activity (510). In our study, ASL perfusion data were obtained by using 2D pCASL and concurrent BOLD contrast was used for rs-fMRI study instead of CBF time series. ASL provided relatively low signal-to-noise ratio (SNR) due to small arterial blood fraction. Recently, several technologies have been developed to maximize the SNR of ASL, including background suppression (BS) and 3D sequences such as GRASE (a hybrid of gradient and spin echo). 3D acquisitions with BS offer increased SNR compared to 2D EPI sequences (10). With these advanced techniques, further studies are needed using CBF time series.
In summary, we performed tb-fMRI and rs-fMRI studies with ASL technique and obtained similar results to those using BOLD technique. ASL has an advantage for clinical and research fields because all brain perfusion imaging, CBF measurement, and fMRI study can be performed in a single acquisition. However, the subjects in our study was small in sample size and all were normal volunteers. Further studies with larger sample size and more patients are needed to validate our results.
 XML Download