

 PDF
PDF ePub
ePub Citation
 Print
Print


INTRODUCTION
Glioblastoma (GBM), the most common malignant primary brain cancer, and primary central nervous system lymphoma (PCNSL), an extra-nodal form of non-Hodgkin lymphoma which has been increasing in incidence, are two representative primary brain cancers (123). However, the first treatment of choice is totally different between these tumors (3). Therefore, precise differentiation of GBM and PCNSL is clinically crucial. Although histopathological tissue evaluation is the current standard for classifying primary brain cancers, the drawbacks of this invasive procedure have led to the demand for developing reliable preoperative differentiation methods (45).
As an adjunct to the conventional MR imaging in which GBM and PCNSL show characteristic but occasionally an overlapping pattern of enhancement, advanced MR imaging techniques offer useful physiologic information facilitating the precise evaluation of brain masses (56789101112). Previous studies have shown that dynamic susceptibility contrast-enhanced (DSC) perfusion MR imaging (PWI) analysis is a reliable way to differentiate GBM from PCNSL, and especially, the relative cerebral blood volume (rCBV) from DSC PWI, which reflects microvascular density and angiogenesis, is the most important hemodynamic parameter for a differential diagnosis of GBM and PCNSL (56789101112131415161718192021).
The region of interest (ROI) for the rCBV measurement can be determined manually or semi-automatically (22). The reproducibility and the inter- and intra-observer variation of the manual placement of ROI have been issues, and several studies have suggested that automatic or semiautomatic segmentation methods reduce observer-related problems (22232425). However, whether the software-assisted method shows better diagnostic performance than manual method has not been validated enough. Because the range of the rCBV value in the solid area of GBM is wide (2526), the sampling bias from the random manual ROI selection can significantly affect the accuracy of the differential diagnosis of GBM from PCNSL based on the rCBV. Therefore, we hypothesized that the semiautomatic segmentation method for the tumoral rCBV measurement can improve the preoperative diagnostic accuracy of the differentiation between GBM and PCNSL, because of its better reproducibility and observer-independence compared to random manual ROI selection (2223).
To the best of our knowledge, there have been no reports comparing the diagnostic accuracy of semiautomatic segmentation and random manual ROI selection methods for the discrimination of GBM and PCNSL using DSC PWI. Thus, this study aimed to evaluate whether the semiautomatic segmentation method can improve the diagnostic performance of the mean rCBV value derived from DSC PWI in the differential diagnosis of GBM and PCNSL compared to the random manual ROI selection method.
MATERIALS AND METHODS
This was a retrospective study approved by the Institutional Review Board of Seoul National University Hospital. The Institutional Review Board of Seoul National University Hospital waived the requirement of obtaining written informed consent from the patients.
Patient Selection
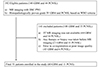
From January 2011 to July 2013, we retrospectively searched for patients diagnosed with grade IV GBM or PCNSL based on the World Health Organization histopathologic criteria by inspecting the electronic medical records and the radiology information systems of our hospital. During the whole period, 192 patients (148 GBM and 44 PCNSL) were histopathologically diagnosed as grade IV glioblastoma or lymphoma. Among them, patients who underwent 3T MR imaging with DSC PWI before surgery, a stereotactic biopsy or chemoradiotherapy and who had qualified image able to complete image post-processing without error are only included. Finally, 40 GBM (30 men and 10 women; mean age, 52.58 years; age range, 20-82 years) and 11 PCNSL (6 men and 5 women; mean age, 53.45 years; age range, 29-77 years) patients are enrolled in the study (Fig. 1).
Image Acquisition
A 3T MR system (Verio; Siemens Medical Solutions, Erlangen, Germany) with a 32-channel head coil was used to perform all MRI examinations. The MR imaging included T1-weighted imaging (T1WI) before and after contrast enhancement of multi-planar reconstructed transverse and coronal imaging with a sagittal three-dimensional magnetization prepared rapid acquisition gradient echo (3D-MPRAGE) sequence, transverse fluid-attenuated inversion-recovery (FLAIR) and transverse T2-weighted imaging (T2WI) with turbo spin-echo sequences. We obtained the T1WI with 3D-MPRAGE sequences using the following parameters: repetition time (TR), 1500 ms; echo time (TE), 1.9 ms; flip angle (FA), 9°; matrix, 256 × 232; field of view (FOV), 220 × 250; section thickness, 1 mm; and number of excitation (NEX), 1. The parameters in axial FLAIR imaging were as follows: TR, 9000 ms; TE, 97 ms; inversion time, 2500 ms; FA, 130°; matrix, 384 × 348; FOV, 199 × 220, and slice thickness, 5 mm. The parameters for the transverse T2WI were as follows: TR, 5160 ms; TE, 91 ms; FA, 130°; matrix, 640 × 510-580; FOV, 175-199 × 220; section thickness, 5 mm, and NEX, 3. Contrast-enhanced (CE) T1WI was obtained after the intravenous administration of gadobutrol (Gadovist®, Bayer Schering Pharma, Berlin, Germany) at a dose of 0.1 mmol per kilogram (mmol/kg) of body weight. To acquire the transverse DSC PWI, a single-shot gradient-echo echo-planar sequence was operated while 0.1 mmol/kg of body weight gadobutrol was intravenously injected at a rate of 4 mL/sec with a power injector (Spectris; Medrad, Pittsburgh, PA, USA). Following the contrast agent injection, a 30 mL bolus saline was injected at the same rate, The MR imaging parameters for DSC PWI were 1500 ms (TR), 30 ms (TE), 90° (FA), 128 × 128 (matrix), 240 × 240 mm (FOV), 5 mm (section thickness), 16 (sections), 1 mm (intersection gap) and 1.86 × 1.86 × 5 mm3 (voxel resolution). At intervals same as the TR, 60 images were acquired for each section.
Image Postprocessing
Two analysis methods for the DSC PWI processing, manual and semiautomatic segmentation, were performed by one medical student (Y.E.K.) under supervised by neuroradiology expert (S.H.C., 15-year experience in neuroradiology). For the procedure, commercialized software (Nordic ICE, and Nordic Tumor Ex, NordicNeuroLab, Bergen, Norway, respectively) was used. The post-CE T1WI was provided as structural images because this sequence is more useful to define the boundary of definite GBM and PCNSL area than T2WI. The rCBV maps were constructed based on an established tracer kinetic model applied to the first-pass data (2728). Using a gamma-variate function and an approximation of the first-pass response assuming the absence of the recirculation or leakage effect, 1/T2* curves were fitted to reduce recirculation effects. The mathematical correction of the dynamic curves was executed to reduce contrast-agent leakage effects (6). After that, the rCBV value was computed by taking the means of the numeric integration of curves. To minimize variances in the rCBV values of individual patients, normalized rCBV (nCBV) was automatically calculated by dividing each rCBV value by the mean rCBV value of contralateral normal-appearing white matter, where rCBV value of the normal appearing white matter was automatically analyzed (24). Co-registration between the structural images and nCBV maps (color overlay) was achieved using a software package (NordicICE; NordicNeuroLab AS, Bergen, Norway) (29).
Image Analysis
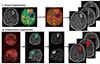
The image analysis method is shown in Figure 2. The tumor region presented as a high-signal intensity, contrast-enhanced area on the CE-T1WI. In both the manual and semiautomatic segmentation approaches, non-tumor regions such as necrotic, hemorrhagic or edematous regions and contrast-enhanced macro-vessels were excluded from the ROI for nCBV measurement.
For the manual analysis, five to ten 3.52 mm2 sized ROIs per individual tumor were randomly drawn on enhanced mass area of axial co-registered images (color overlay). Each tumor containing axial plane included at least one ROI. The nCBV values of the selected ROIs were computed, and the average nCBV of the mass (manual mCBV) was calculated.
For the semiautomatic analysis, perfusion analysis software (Nordic TumorEx) was used. The elliptical volume of interest (VOI) was specified manually, and then the automatic segmentation with the clustering analysis of the defined VOI was done. Based on the expectation and maximization algorithm, the software divided the segmented VOI into non-overlapping six clusters. In reference to the multi-planar structural images, the observer selected clusters which correspond to the enhanced tumor area and erased non-tumor regions within the selected clusters. The nCBV values of whole pixels within the semiautomatically processed VOI were computed, and the mean nCBV value of the tumor (semiautomatic mCBV) was calculated. During the semiautomatic segmentation analysis, the volume of the enhancing portion of the tumor was also measured automatically.
Statistical Analysis
Two commercial software programs (MedCalc version 12.3.0, MedCalc Software, Mariakerke, Belgium, and Instat version 3, GraphPad Software, Inc. La Jolla, CA, USA) were used for statistical analyses. To check the normality of the sample, the Kolmogorov-Smirnov test was done with the Dallal and Wilkinson approximation to Lilliefors' method. All analyses considered P-values less than 0.05 as statistically significant.
Categorical data were analyzed with Fisher's exact test. Independent samples t-test (unpaired Student t-test) was done to test the difference in the manual mCBV and the semiautomatic mCBV as well as the enhancing volume between GBM and PCNSL. Pearson's correlation coefficient was measured to assess the correlation between the manual mCBV and the semiautomatic mCBV. The discriminative ability of each parameter was evaluated individually through receiver operating characteristic (ROC) curve analysis. The sensitivity, specificity, cutoff value, and area under the curve (AUC) of each parameter were computed by the ROC curve analysis. Pair-wise comparison of sensitivities and specificities was done by Fisher's exact test. Pair-wise comparison of AUC values was performed based on DeLong et al. (30) method. To assess the predictive power of three independent variables, multivariate logistic regression analysis with stepwise method was done.
RESULTS
mCBV and Enhancing Volume Values
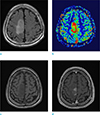
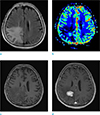
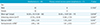
All the data in this study (e.g., enhancing volume, manual mCBV, and semiautomatic mCBV of the 40 GBMs and 11 PCNSLs) followed a normal distribution according to the Kolmogorov-Smirnov test. The clinical and analyzed data are summarized in Table 1. GBM had a significantly higher enhancing volume and manual mCBV and semiautomatic mCBV values than that of PCNSL (27.70 ± 20.39 [mean ± SD] vs. 13.66 ± 7.79 cm3; P = 0.0307, 3.50 ± 2.33 vs. 1.76 ± 0.41; P = 0.018, 2.95 ± 1.65 vs. 1.61 ± 0.53; P = 0.0111, respectively). Representative GBM and PCNSL cases are shown in Figures 3 and 4, respectively. According to the correlation analysis, the manual mCBV and the semiautomatic mCBV were in a positive correlation with the correlation coefficient r = 0.8688 (P < 0.0001).
ROC Curve Analysis
Table 2 shows the summary of the ROC curve analysis results. Here, the sensitivities and specificities indicate the percentage of correctly classified GBM and PCNSL, respectively. For the differential diagnosis of GBM and PCNSL, the optimal criterion value for enhancing volume was 15.58 with a sensitivity of 72.50%, specificity of 72.73% and AUC of 0.761, and the manual CBV optimal criterion value was 2.09 with a sensitivity of 65.00%, specificity of 90.91% and AUC of 0.744. For the semiautomatic mCBV, the optimal criterion value was 2.13 with a sensitivity of 67.50%, specificity of 90.91% and AUC of 0.815. Based on Fisher's exact test, the sensitivities and specificities of the three variables were not significantly different (P > 0.05). The AUC of the semiautomatic mCBV had the highest value, but according to pairwise comparisons of the ROC curves, no combinations of variables reached a significant difference in the AUC values (P = 0.3546 for the manual mCBV and the semiautomatic mCBV, P = 0.8772 for the manual mCBV and enhancing volume, P = 0.6263 for the semiautomatic mCBV and enhancing volume).
Logistic Regression Analysis and Optimal Regression Model
The multivariate logistic regression analysis with stepwise method was done with the enhancing volume, manual mCBV and semiautomatic mCBV as independent variables. Based on the result, the regression equation only included the semiautomatic mCBV as an independent variable (P = 0.0111, variance inflation factor = 1.000).
DISCUSSION
This study measured and directly compared the diagnostic performance of three parameters, the manual mCBV, the semiautomatic mCBV and the enhancing volume, for the differential diagnosis of GBM and PCNSL. Two major findings of this study are that a) all three parameters were significantly higher in GBM than in PCNSL, and b) the semiautomatic mCBV was the best predictor for the differential diagnosis of GBM and PCNSL.
This study determined that GBM and PCNSL are distinguishable from each other using three parameters independently. The potential of an nCBV or rCBV as a reliable index of GBM or PCNSL diagnosis has been reported several times (57891011131415161718192021). According to a previous report using the maximum, the mean or the median value of nCBV, GBM has a significantly higher nCBV value compared to PCNSL (578910131415161718192021). Consistent with previous studies, GBM had markedly higher mCBV values than that of PCNSL regardless of the segmentation method in this study. The manual and semiautomatic mCBV values of GBM we estimated are lower than the mCBV values from other studies which are generally greater than 4.00. Both the intrinsic heterogeneity of GBM and the variation in the details of the analyses seem to affect the overall decrease in the nCBV value. During the manual ROIs placement, we tried to draw ROIs as randomly as possible including not only the center but also the margin of each tumor. In addition, we excluded macro-vessels within the tumor from the ROIs in both analysis methods. The difference in the nCBV value between the two tumors can be interpreted by their histological difference in microvasculature within the tumors. In contrast to malignant glial tumors exhibiting characteristic extensive angiogenesis, PCNSL is likely to grow angiocentrically without prominent neovascularization (51231). Liao et al. (21) revealed that CBV and microvascular density are both lower in PCNSL than in GBM, implying a correlation between CBV and histopathology.
This study for the first time showed that the semiautomatic nCBV performed best in the prediction of whether the tumor is GBM or PCNSL, though there was no significant difference among the sensitivities and specificities of the three parameters. To the best of our knowledge, the diagnostic accuracy of the nCBV obtained from the random manual ROIs placement and the semiautomatic segmentation method in brain tumor differential diagnosis has not been compared yet. Prior research assessed the manual and semiautomatic approach in the mass evaluation of various organs, but most of them focused on the reproducibility issue (222332). The semiautomatic lesion segmentation significantly improves both intraobserver and interobserver reproducibility in the GBM nCBV measurement (22) and reduces interobserver variability in the permeability parameter (Ktrans) measurement from dynamic contrast enhancement MRI in uterine fibroid (23). Bauknecht et al. (32) showed improved reproducibility in the semiautomatic volume measurement of brain metastasis compared to the conventional linear method. These studies, however, did not investigate the diagnostic performance of each method. Although the diagnostic value of nCBV in brain tumor evaluations is quite established, the method to obtain the nCBV is not standardized (6). The conventional hot-spot method determines a few small ROIs manually which make the process considerably observer dependent and susceptible to sampling bias (2325). Because GBM has a highly variable nCBV from pixel to pixel and a broad range of nCBV values in its solid area (1424252633), the nCBV of GBM is more likely to fluctuate even with the small variation of ROIs. The error induced by observers is inevitable but hard to estimate and control (23); thus, involving the whole lesion of the mass in the ROI was introduced to reduce unnecessary bias originating from an observer dependent process. The histogram analysis method that provides the rCBV from the total voxel of the tumor has less interobserver variability (232533), and in a study by Emblem et al. (25), histogram analysis of glioma grading showed higher sensitivity, equal specificity and increased interobserver agreement compared to the hotspot method. The semiautomatic lesion analysis contains the whole essential lesion of the mass while excluding macrovessels or cystic or necrotic areas within the tumor, which is better than manual analysis (22), and is less influenced by the observer. Due to these features of the semiautomatic method, semiautomatically measured nCBV is able to reflect the actual tumor vascularity better than the manually measured nCBV and reduce the overlapping area of the nCBV spectrum between GBM and PCNSL. Therefore, the semiautomatic segmentation is advantageous for accurate differentiation of GBM and PCNSL shown in this study.
With respect to the enhancing volume, GBM has a significantly larger volume than PCNSL. In our study, we included only the enhancing areas in each tumor, and the perienhancing T2 high signal intense regions were excluded which might result from infiltrative tumor cells and edema. Thus, our finding needs careful interpretation for future applications.
In addition to the retrospective study design, this study has several limitations. First, the small sample size is prone to sampling bias and can limit the identification of statistical significance. Instead, the ratio of PCNSL to GBM in our sample is similar to the actual incidence ratio. Second, selecting ROIs randomly by the observer results in inevitable variation in the manual mCBV on each measurement. In addition, the editing process during semiautomatic analysis might be influenced by the observer's experience (34), and add to the interobserver variability. The level of variation induced by editing is expected to be less than that induced by the conventional manual process; however, we need to pay attention to this error-prone factor. Therefore, further study comparing intraclass correlation coefficient of the manual mCBV and the semiautomatic mCBV is needed to assess their reproducibility. Third, the positive relationship between the manual mCBV and the semiautomatic mCBV can raise the multicollinearity issue in multiple regression model analysis. However, the multiple regression model in this study only included the semiautomatic mCBV as an independent variable because other variables became non-significant and were removed by stepwise analysis. The VIF value also indicates multicollinearity is not a significant problem in this model. Finally, this study only includes GBM and PCNSL. Because nCBV is used in grading gliomas (33), differentiating tumors such as GBM versus metastasis (26), identifying recurrent tumor versus treatment related changes (10) and predicting the genetic profile in GBM (35) described previously, our result can be applied to these areas.
In conclusion, we showed that the nCBV measurement can be helpful to differentiate GBM from PCNSL noninvasively, and the nCBV obtained from the semiautomatic segmentation method was the best independent variable for the discrimination of the two tumors. We anticipate that the computer-assisted measurement of nCBV will contribute to the improvement of perfusion based brain tumor analysis in future studies.

 XML Download