초록
Purpose
To optimize the saturation time and maximizing the pH-weighted difference between the normal and ischemic brain regions, on 3-tesla amide proton transfer (APT) imaging using an in vivo rat model.
Materials and Methods
Three male Wistar rats underwent middle cerebral artery occlusion, and were examined in a 3-tesla magnetic resonance imaging (MRI) scanner. APT imaging acquisition was performed with 3-dimensional turbo spin-echo imaging, using a 32-channel head coil and 2-channel parallel radiofrequency transmission. An off-resonance radiofrequency pulse was applied with a Sinc-Gauss pulse at a B1,rms amplitude of 1.2 μT using a 2-channel parallel transmission. Saturation times of 3, 4, or 5 s were tested. The APT effect was quantified using the magnetization-transfer-ratio asymmetry at 3.5 ppm with respect to the water resonance (APT-weighted signal), and compared with the normal and ischemic regions. The result was then applied to an acute stroke patient to evaluate feasibility.
Results
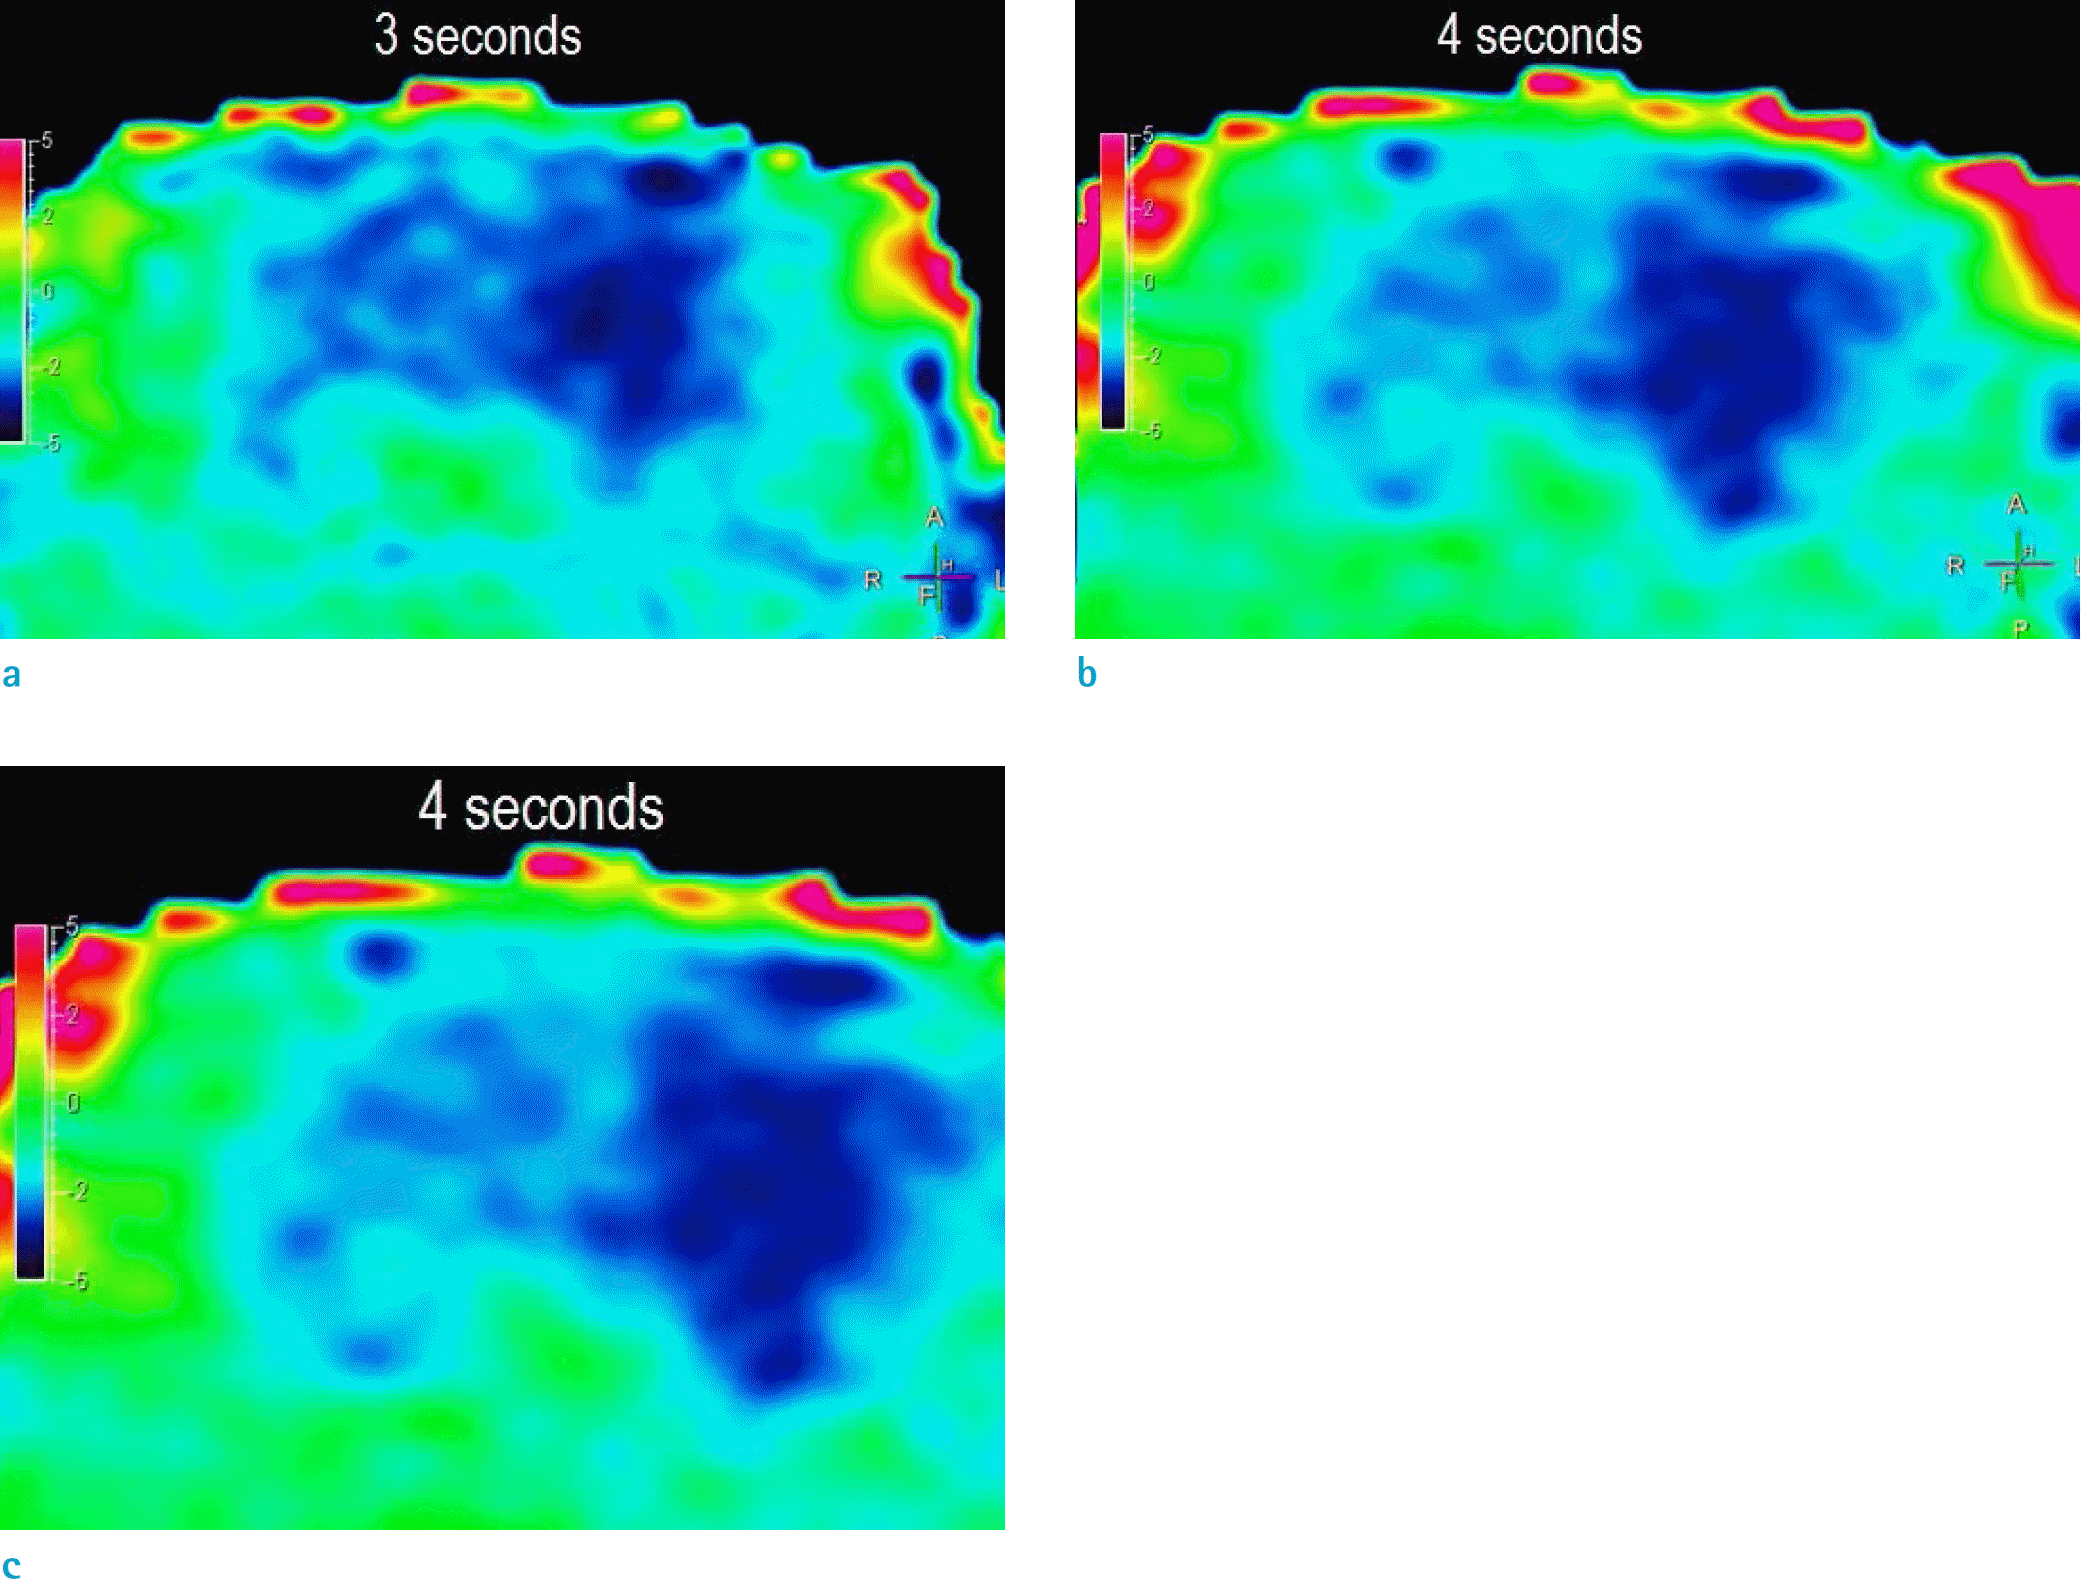
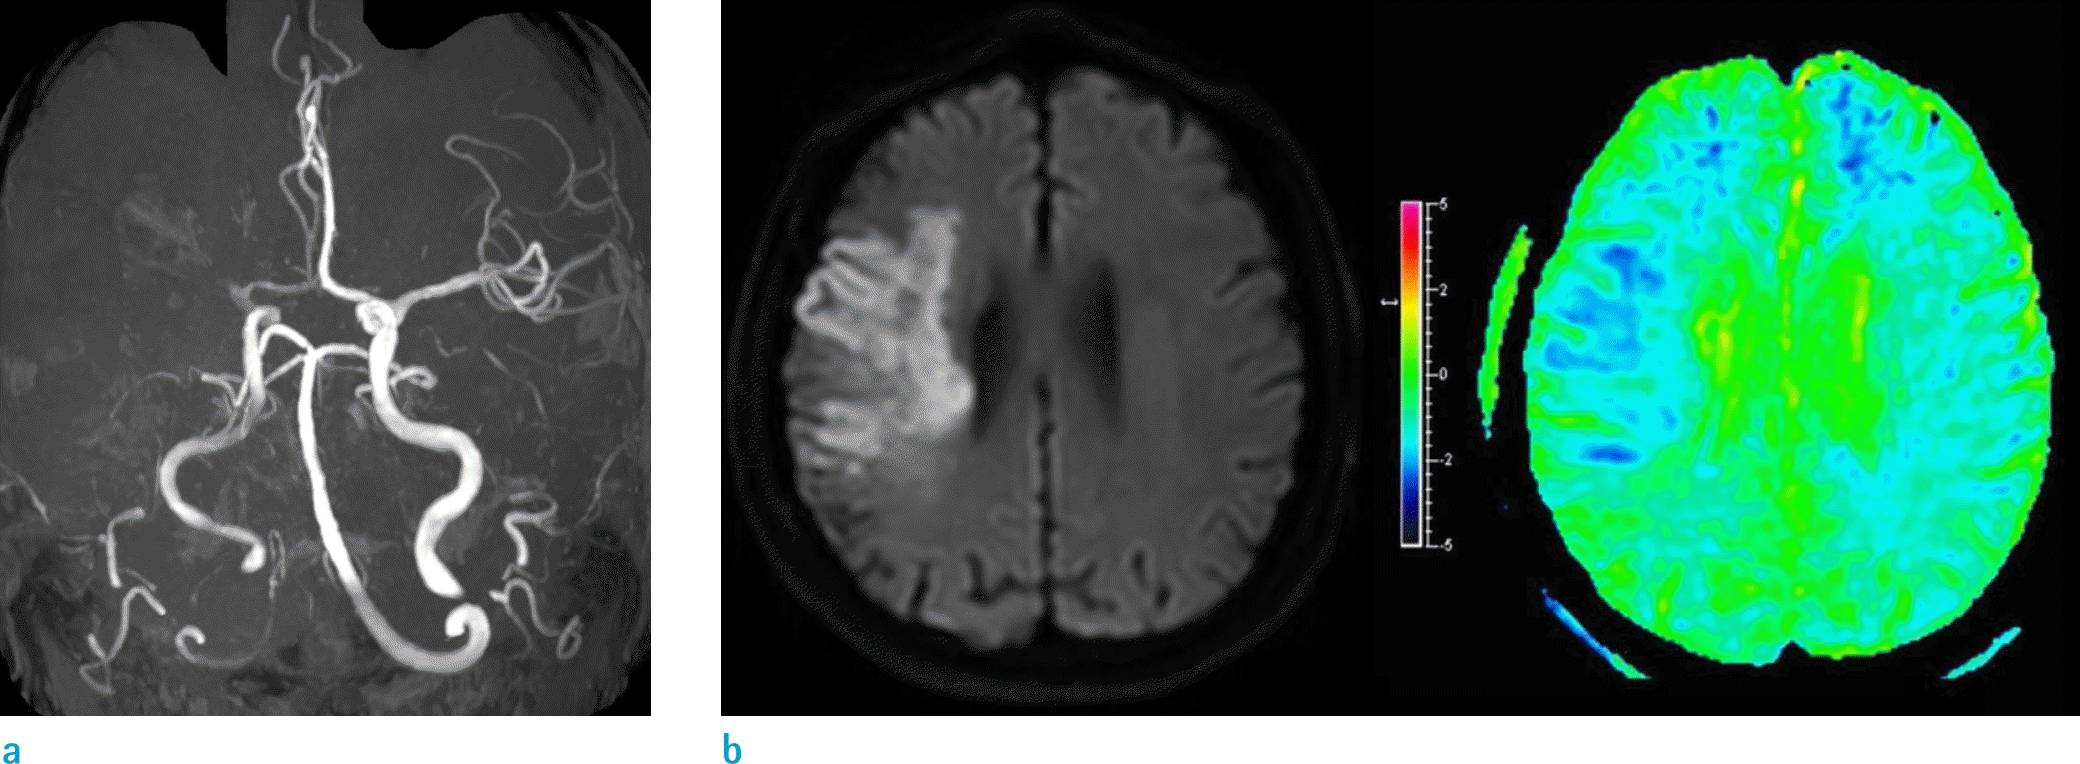
Visual detection of ischemic regions was achieved with the 3-, 4-, and 5-s protocols. Among the different saturation times at 1.2 μT power, 4 s showed the maximum difference between the ischemic and normal regions (-0.95%, P = 0.029). The APTw signal difference for 3 and 5 s was -0.9% and -0.7%, respectively. The 4-s saturation time protocol also successfully depicted the pH-weighted differences in an acute stroke patient.
Go to : 
REFERENCES
1. Zhou J, van Zijl PC. Defining an acidosis-based ischemic penumbra from pH-weighted MRI. Transl Stroke Res. 2011; 3:76–83.

2. Sun PZ, Benner T, Copen WA, Sorensen AG. Early experience of translating pH-weighted MRI to image human subjects at 3 Tesla. Stroke. 2010; 41:S147–151.

3. Tietze A, Blicher J, Mikkelsen IK, et al. Assessment of ischemic penumbra in patients with hyperacute stroke using amide proton transfer (APT) chemical exchange saturation transfer (CEST) MRI. NMR Biomed. 2014; 27:163–174.

4. Campbell BC, Mitchell PJ, Kleinig TJ, et al. Endovascular therapy for ischemic stroke with perfusion-imaging selection. N Engl J Med. 2015; 372:1009–1018.
5. Kidwell CS, Jahan R, Gornbein J, et al. A trial of imaging selection and endovascular treatment for ischemic stroke. N Engl J Med. 2013; 368:914–923.

6. Meng X, Fisher M, Shen Q, Sotak CH, Duong TQ. Characterizing the diffusion/perfusion mismatch in experimental focal cerebral ischemia. Ann Neurol. 2004; 55:207–212.

7. Keupp J, Baltes C, Harvey PR, van den Brink J. Parallel RF transmission based MRI technique for highly sensitive detection of amide proton transfer in the human brain at 3T. Proc Intl Soc Mag Reson Med. 2011; 19:710.
8. Zhu H, Jones CK, van Zijl PC, Barker PB, Zhou J. Fast 3D chemical exchange saturation transfer (CEST) imaging of the human brain. Magn Reson Med. 2010; 64:638–644.

9. Sun PZ, Benner T, Kumar A, Sorensen AG. Investigation of optimizing and translating pH-sensitive pulsed-chemical exchange saturation transfer (CEST) imaging to a 3T clinical scanner. Magn Reson Med. 2008; 60:834–841.

10. Zhao X, Wen Z, Huang F, et al. Saturation power dependence of amide proton transfer image contrasts in human brain tumors and strokes at 3 T. Magn Reson Med. 2011; 66:1033–1041.

11. Xiang QS. Two-point water-fat imaging with partially-opposed-phase (POP) acquisition: an asymmetric Dixon method. Magn Reson Med. 2006; 56:572–584.

12. Eggers H, Brendel B, Duijndam A, Herigault G. Dual-echo Dixon imaging with flexible choice of echo times. Magn Reson Med. 2011; 65:96–107.

13. Scheidegger R, Wong ET, Alsop DC. Contributors to contrast between glioma and brain tissue in chemical exchange saturation transfer sensitive imaging at 3 Tesla. Neuroimage. 2014; 99:256–268.
14. Kidwell CS, Alger JR, Saver JL. Evolving paradigms in neuroimaging of the ischemic penumbra. Stroke. 2004; 35:2662–2665.

15. Sun PZ, Zhou J, Sun W, Huang J, van Zijl PC. Detection of the ischemic penumbra using pH-weighted MRI. J Cereb Blood Flow Metab. 2007; 27:1129–1136.

16. Sun PZ, Cheung JS, Wang E, Lo EH. Association between pH-weighted endogenous amide proton chemical exchange saturation transfer MRI and tissue lactic acidosis during acute ischemic stroke. J Cereb Blood Flow Metab. 2011; 31:1743–1750.

17. Heo HY, Zhang Y, Lee DH, Hong X, Zhou J. Quantitative assessment of amide proton transfer (APT) and nuclear overhauser enhancement (NOE) imaging with extrapolated semi-solid magnetization transfer reference (EMR) signals: Application to a rat glioma model at 4.7 Tesla. Magn Reson Med. 2016; 75:137–149.

18. Li H, Li K, Zhang XY, et al. R1 correction in amide proton transfer imaging: indication of the influence of transcytolemmal water exchange on CEST measurements. NMR Biomed. 2015; 28:1655–1662.
Go to : 
 | Fig. 1.Characterization of acute middle cerebral artery occlusion using amide proton transfer imaging. (a) 3 seconds, (b) 4 seconds, (c) 5 seconds protocol. The 4 s protocol showed maximal visual contrast and localization of the ischemic region. |
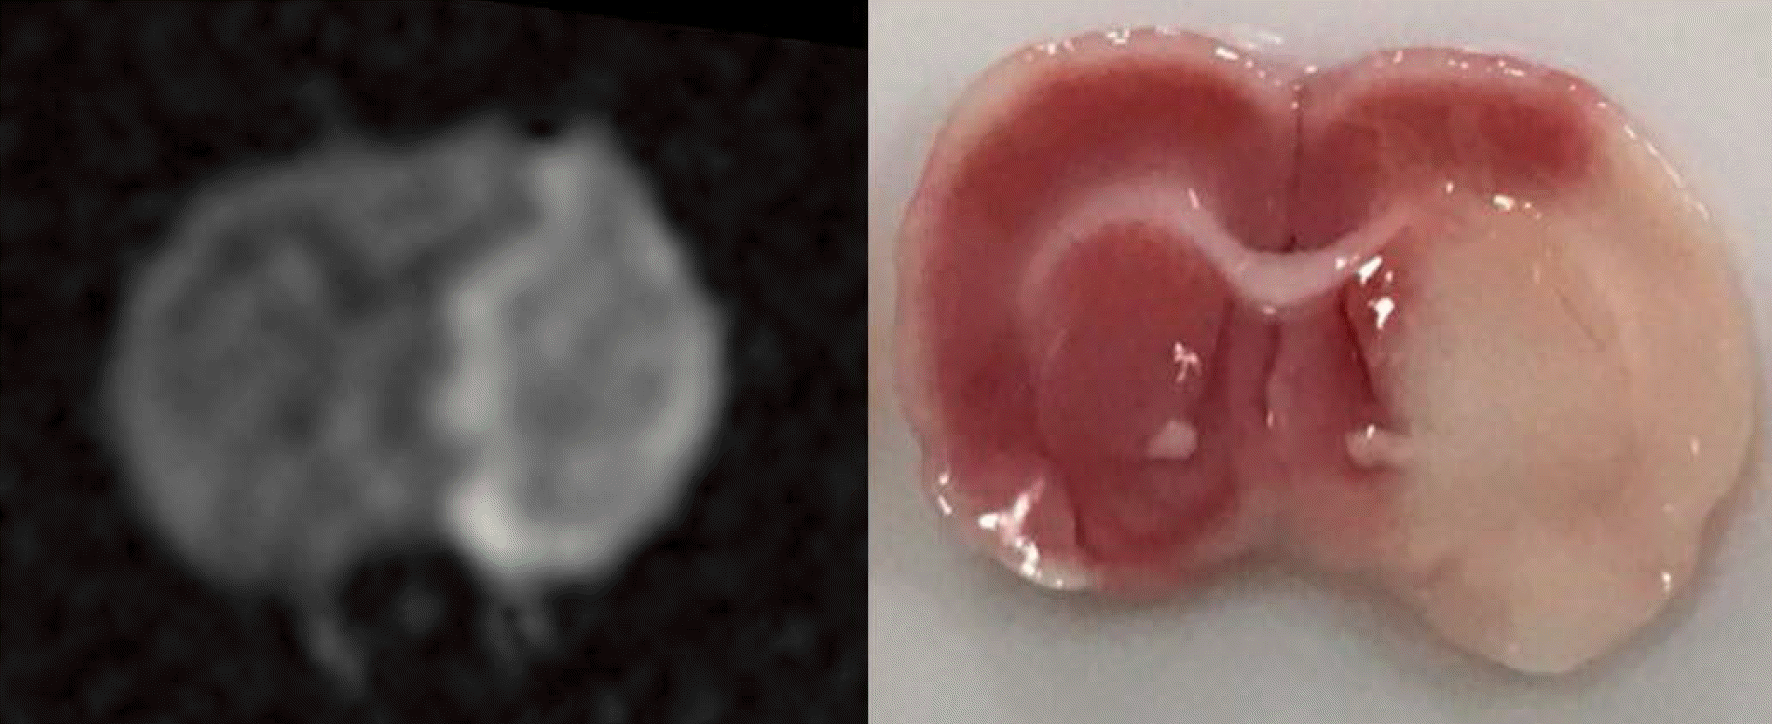
 | Fig. 2.Diffusion-weighted imaging and TTC (triphenyltetrazolium hydrochloride) stain for the same Wistar rat shown in Figure 1, shows the ischemic region matched with amide proton transfer imaging. |
 | Fig. 3.Amide proton transfer (APT) imaging with a 4 s saturation time protocol applied to a 69-year-old male, 4 days after an acute middle cerebral artery occlusion (a). (b) The diffusion-restriction region matched the reduced APT-weighted signal region, compared to the contralateral normal appearing brain. |
Table 1.
APT Difference between Ischemic Regions and Normal Appearing Brain, in a Rat Model, According to RF Saturation Time


 PDF
PDF ePub
ePub Citation
 Print
Print


 XML Download