

 PDF
PDF ePub
ePub Citation
 Print
Print


INTRODUCTION
Fat fraction of the bone marrow has been suggested as an important quantitative parameter in the assessment of treatment response and determination of the benignity in oncologic imaging (12) or in the investigation into the association between bone health and bone marrow adiposity (345). Therefore, accurate fat quantification is a prerequisite for the fat fraction to be established as a reliable imaging biomarker. For this purpose, a MR spectroscopy (MRS) has been widely studied, and these studies demonstrated the potential clinical utilities of the bone marrow fat quantifications (46).
Although MRS has been considered as a non-invasive standard fat fraction measurement tool, a spatial coverage is limited due to its time consuming spectral encoding process. Recently, multi-echo spoiled gradient echo (GRE) based fat quantification methods have been suggested to resolve this limitation because these methods have fast scan time and wide volume coverage (78). However, these GRE-based methods are inherently susceptible to spatial and temporal B0 variations from various sources such as respiration, cardiac pulsation, and body motion. Among them, a respiratory motion is one potential obstacle to estimating reliable fat fraction in the spine region. Respiration induces B0 field variations as well as physical motions. These variations make signal dispersions on both magnitude and phase images, and may hamper accurate fat quantification from gradient echo data. A recent 3T study has reported that B0 variations between inspired and expired conditions were measured up to 74 Hz in the cervical spine (9).
In this study, we investigate the effects of respiration-induced B0 variations on fat quantification of the bone marrow in the lumbar spine using the modified multi-echo GRE sequence. Furthermore, we compensate these effects using simultaneously acquired navigator echoes.
MATERIALS AND METHODS
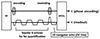
Eight healthy volunteers (6 male and 2 female, mean age = 24 years, and age range = 21-30; IRB-approved) were scanned at 3T clinical scanner (Verio, Siemens, Erlangen, Germany). For bone marrow fat quantification, 3D multi-echo GRE was acquired with following parameters: TR = 17 ms, # of echoes = 7, first echo time = 1.7 ms, echo spacing = 1.7 ms, 7th echo was used as a 1D (superior to inferior direction) navigator without phase encoding, flip angle = 10°, voxel size = 1.2 × 1.2 × 2.4 mm3, readout bandwidth = 704 Hz/px, 48 sagittal slices, scan time = 2 min. Bipolar readout gradients were used for acquisition efficiency and phase/magnitude errors due to bipolar acquisitions were corrected before fat quantification (10). Figure 1 summarizes the pulse sequence diagram used in this study.
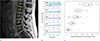
Temporal B0 variations in the readout direction (superior to inferior) were estimated by calculating phase differences between navigator echoes after 1D Fourier transform. Before calculation, navigator echo data were low-pass filtered (0 to 2 Hz) temporally to reduce high-frequency variations (not related to respiration). By the aid of the reconstructed images (1st to 6th echoes), each vertebral level (from L1 to L5) was manually defined in the navigator echo data (Fig. 2). For each vertebral level, the standard deviation of temporal B0 variations and the difference of maximum and minimum B0 variations were calculated for comparison. By utilizing the estimated B0 variations in the readout direction, each k-space line was compensated before 3D Fourier transform according to the following equation (111213):
where K (N, Kx, TE) is the k-space line of Nth TR at each echo time, FFT is the Fourier transform, iFFT is the inverse Fourier transform, LPF is a low pass filtering, and Δø(N, x) is a phase difference between Nth TR and 1st TR in the readout direction.
For both uncompensated and compensated complex images, fat quantification was performed using T2*-IDEAL technique with 6 echoes (8) We used six echoes for both T2* and fat fraction rather than three echoes because previous studies have shown the improved fat fraction estimation when six-echo is applied in GRE-based fat quantification (141516). Assuming identical T2* decay for both water and fat, the signal from a voxel including water and fat can be represented as:
where W and F are the amount of water and fat, Δf is the chemical shift difference between water and fat, ψ is the B0 field inhomogeneity. Total 4 unknowns (W, F, ψ, and T2*) were estimated using the iterative water and fat decomposition algorithm (8), then fat fraction was calculated as follows:
where W is the amount of water and F is the amount of fat, respectively.
Vertebral region of interests (ROIs) were manually drawn on the magnitude images, and then ROI-averaged fat fractions were calculated for five vertebral levels. For results of 8 subjects, a pair-wise Student's t-test was performed to determine statistical significance between the uncompensated and compensated. A P-value of 0.05 or smaller was considered statistically significant for statistical analysis.
RESULTS
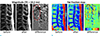
Figure 3 shows the estimated B0 variations from navigator echo data. A representative temporal fluctuation of a healthy volunteer showed an increase of B0 variations from L5 to L1 as shown in Figure. 3B. This increase was observed for all eight subjects. The results showed relatively high variations in the vertebral levels close to lungs such as L1 and L2, whereas relatively small fluctuations were observed in the lower vertebral levels (L4 and L5). In eight healthy volunteers, the standard deviations of temporal B0 variations (Hz) were 5.1 ± 1.1, 3.4 ± 0.8, 3.0 ± 1.0, 2.3 ± 1.0 and 1.8 ± 0.7 for L1, L2, L3, L4 and L5, respectively. The difference of maximum and minimum B0 variations (Hz) were 22.2 ± 2.8, 15.1 ± 3.5, 12.6 ± 4.3, 10.0 ± 3.8 and 10.1 ± 3.7 for L1, L2, L3, L4 and L5, respectively.
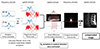
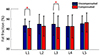
These B0 variations result in signal dispersions in gradient echo images, particularly, in late TE images. After compensation using navigator echo data, the effects of the B0 variations were reduced in magnitude images, particularly in L1 (red dotted circle in Fig. 4A). Similar difference patterns can be observed in the calculated fat fraction maps (Fig. 4B). For eight healthy volunteers, the means and standard deviations of the calculated fat fractions are displayed in Figure 5. The results showed significant differences (P < 0.05) in L1 and L3 between the uncompensated and the compensated fat fractions (Fig. 5).
DISCUSSION
We have investigated the effects of respiration-induced B0 variations on fat quantification in the lumbar spine. In the lumbar spine, approximately 20 Hz temporal B0 variations were observed in the superior vertebral levels (L1 and L2) and 10 Hz variations were observed in the inferior vertebral levels (L4 and L5). Furthermore, we have demonstrated that the proposed compensation method based on navigator echo data can effectively reduce the signal dispersions in the lumbar spine GRE images. The fat fraction maps calculated from the uncompensated and the compensated GRE images also showed the significant differences in the superior levels (L1 and L3). These observations raise the need for considering respiration-induced B0 variations for GRE-based fat quantification in the lumbar spine.
In this work, the respiration induced B0 variations were measured and compensated using the navigator echo data along the readout direction. The readout direction used in this study was superior to inferior direction. This approach is reasonable because the effects of the respirations on the images are directly related to the distance from lungs. The use of navigator echo could increase the total scan time slightly. In this study, however, the additional duration due to navigator echo occupied only 2 ms in each repetition time.
The navigator echo of this study was placed at the last echo time rather than the first echo time due to fast T2* decay of the marrow regions. Although navigator echo signals could be noisy with increasing the number of echoes, relatively high signal to noise navigator echo signals were obtained at our echo time of navigator because no phase encodings were applied for navigator echo data. Previous study using dual navigator echoes (TE = 7.36 and 32.62 ms) has shown that the respiration-induced B0 variations estimated from two navigator echoes were not substantially different at sagittal imaging with superior to inferior readout direction (17).
This study has a few limitations. Firstly, validation for accuracy of the estimated fat fractions was absent in this study. The phantom experiments with known fat fractions and breathing simulations will be considered for this purpose. Second, the number of subjects was insufficient to reach a reliable statistically significant conclusion. Lastly, the participants were limited to a young healthy group and the imaging conditions did not include the various situations such as deep or sudden changes of subject breathing.
In conclusion, the use of navigator echo data can be an effective way for the reduction of the effects of respiratory motion on the quantification of fat fraction because it requires a TR increase of only a few milliseconds. The proposed method may improve GRE-based fat quantification in the lumbar spine regions.
 XML Download