Abstract
Purpose
To investigate the association of carotid intraplaque hemorrhage (IPH) with acute cerebral ischemic events and progression of stenosis using magnetic resonance (MR) imaging.
Materials and Methods
From April 2014 to December 2016, 53 patients underwent carotid plaque MR imaging, including magnetization-prepared rapid acquisition with gradient-echo (MPRAGE) sequence. A total of 66 carotid arteries in 53 patients had carotid stenosis, and they were included in this study. Carotid arteries were classified according to the presence of IPH, the age of hemorrhage, and degree of stenosis. We assessed ipsilateral cerebrovascular event rates and progression of stenosis between the IPH and no-IPH groups.
Results
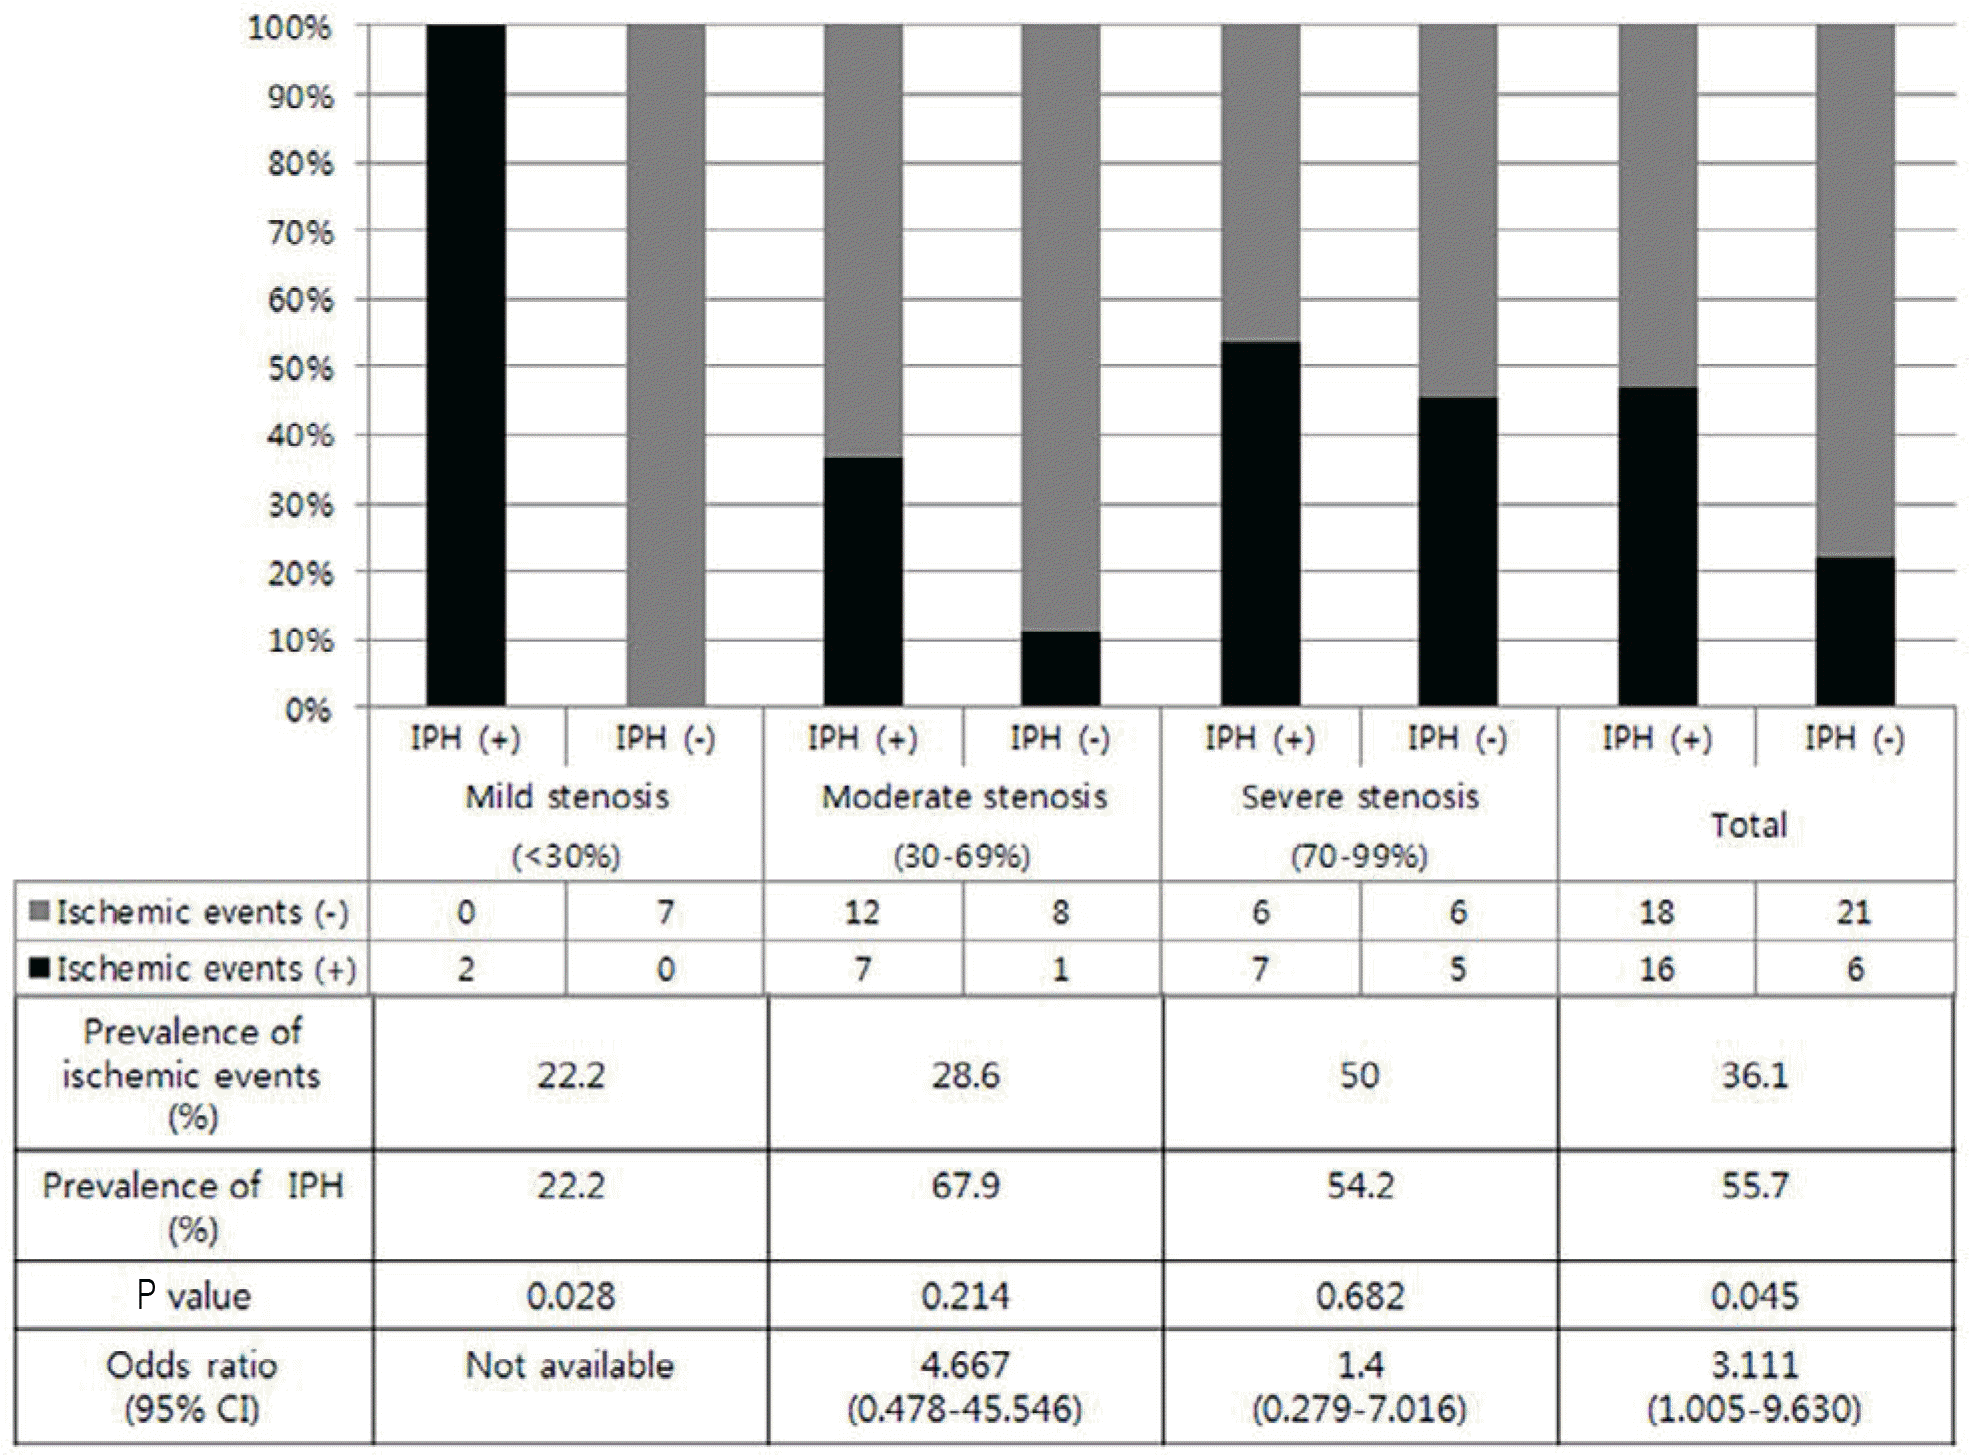
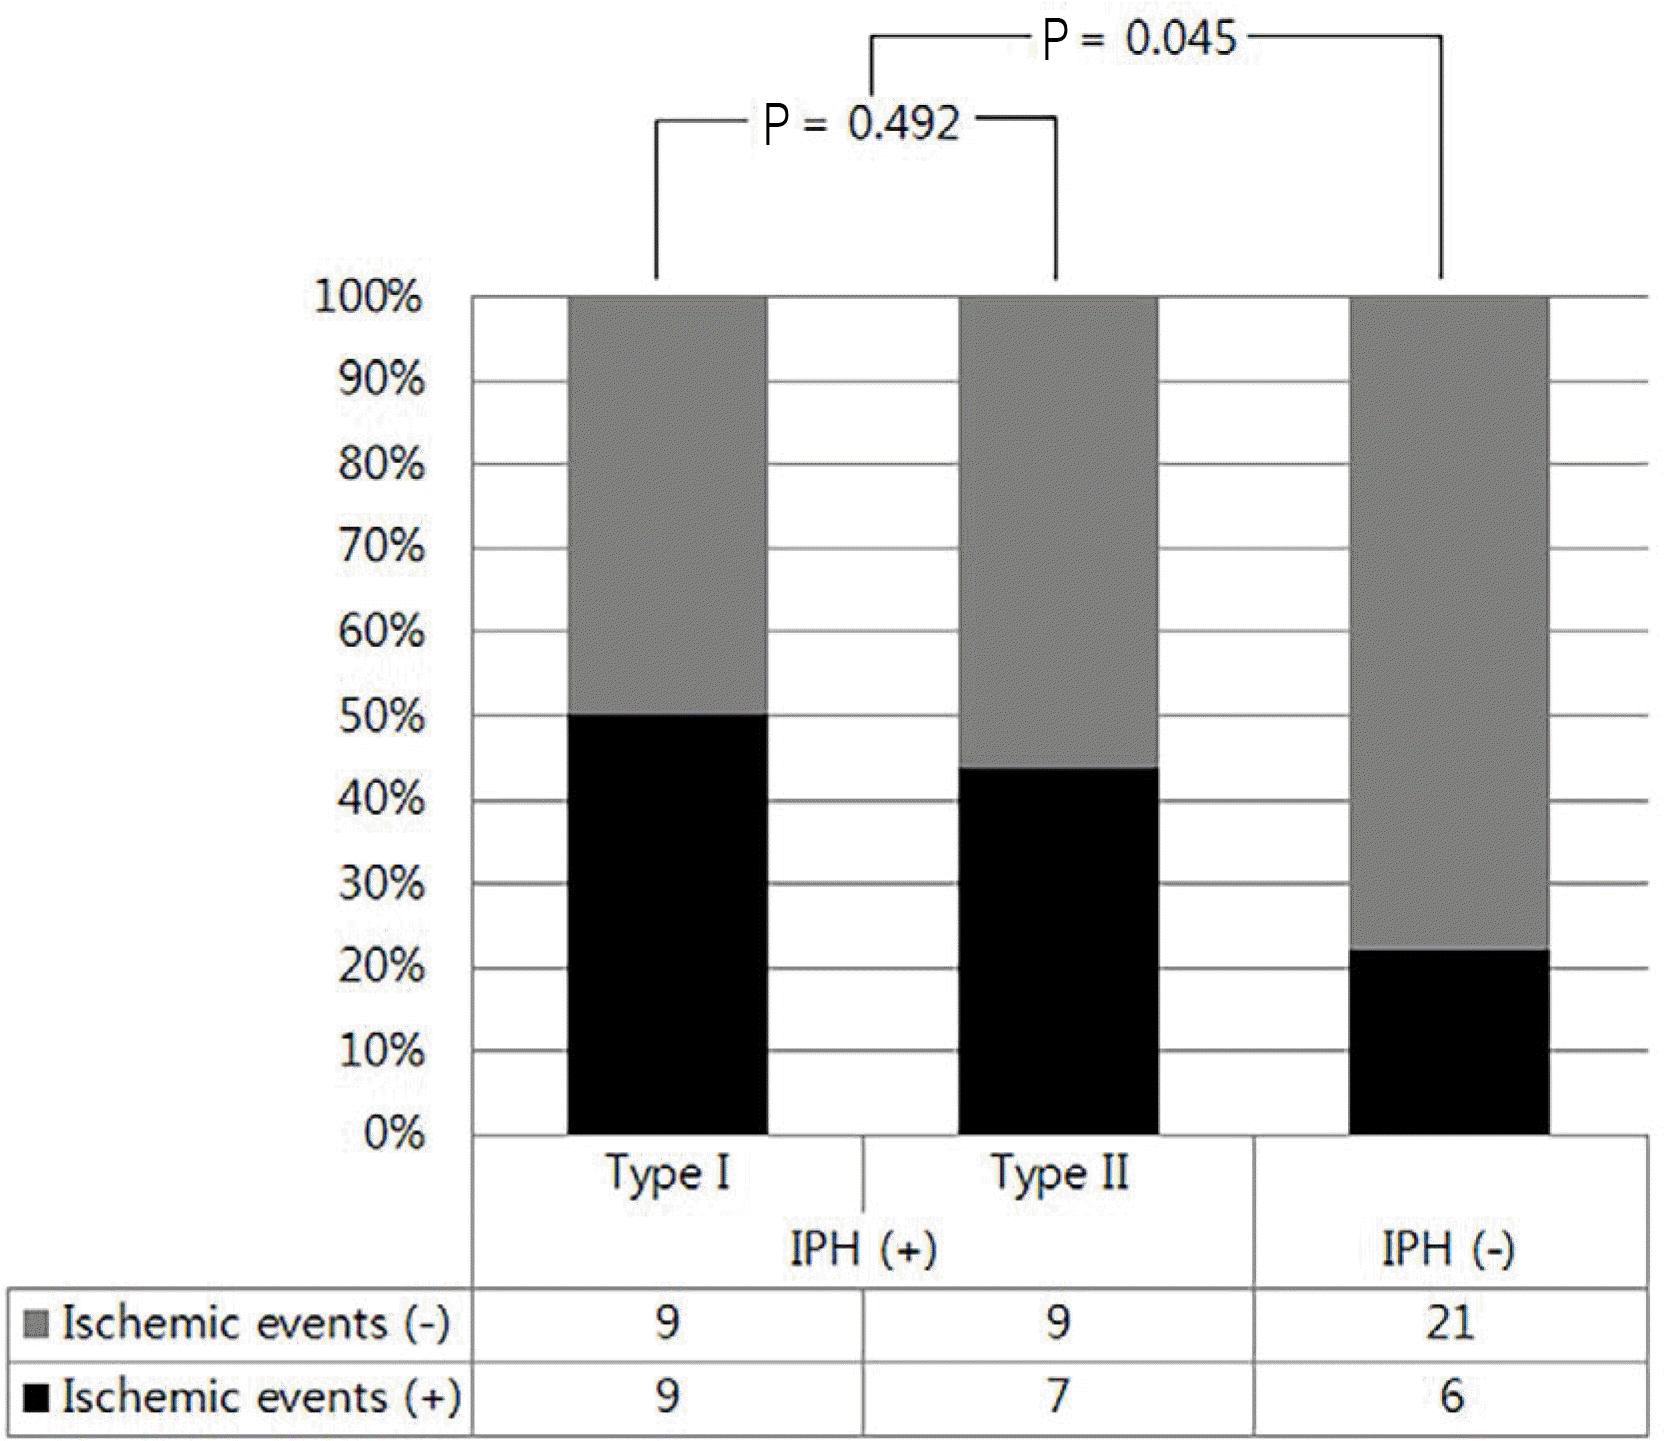
Of the 61 carotid arteries assessed, 34 (56%) had IPH, and 27 (44%) had no IPH. Acute cerebral ischemic events were more frequent in the IPH group (47% vs. 22%, P = 0.045), especially in the < 30%-stenosis group (100% vs. 0%, P = 0.028). However, there was no significant difference in the incidence of ischemic events according to the age of hemorrhage (50% vs. 44%, P = 0.492). Among the 61 carotid arteries, 20 carotid arteries had previously undergone carotid artery imaging and were evaluated for plaque progression. The trend for progression of stenosis favored the IPH group versus the no-IPH group, with a marginal P-value (20% ± 12.7 vs. 9.6% ± 5.7, P = 0.063).
Conclusion
IPH was associated with an increased incidence of acute ischemic events, especially in the mild-stenosis group and it was also associated with progression of stenosis. Evaluation of the carotid IPH by carotid plaque MR could improve discrimination of carotid plaques that cause ischemic events and progression of stenosis.
Go to : 
References
1. Go AS, Mozaffarian D, Roger VL, et al. Heart disease and stroke statistics–2014 update: a report from the American Heart Association. Circulation. 2014; 129:e28–e292.
2. Kwee RM, van Oostenbrugge RJ, Mess WH, et al. MRI of carotid atherosclerosis to identify TIA and stroke patients who are at risk of a recurrence. J Magn Reson Imaging. 2013; 37:1189–1194.

3. Naylor AR, Schroeder TV, Sillesen H. Clinical and imaging features associated with an increased risk of late stroke in patients with asymptomatic carotid disease. Eur J Vasc Endovasc Surg. 2014; 48:633–640.

4. Naghavi M, Libby P, Falk E, et al. From vulnerable plaque to vulnerable patient: a call for new definitions and risk assessment strategies: Part I. Circulation. 2003; 108:1664–1672.
Go to : 
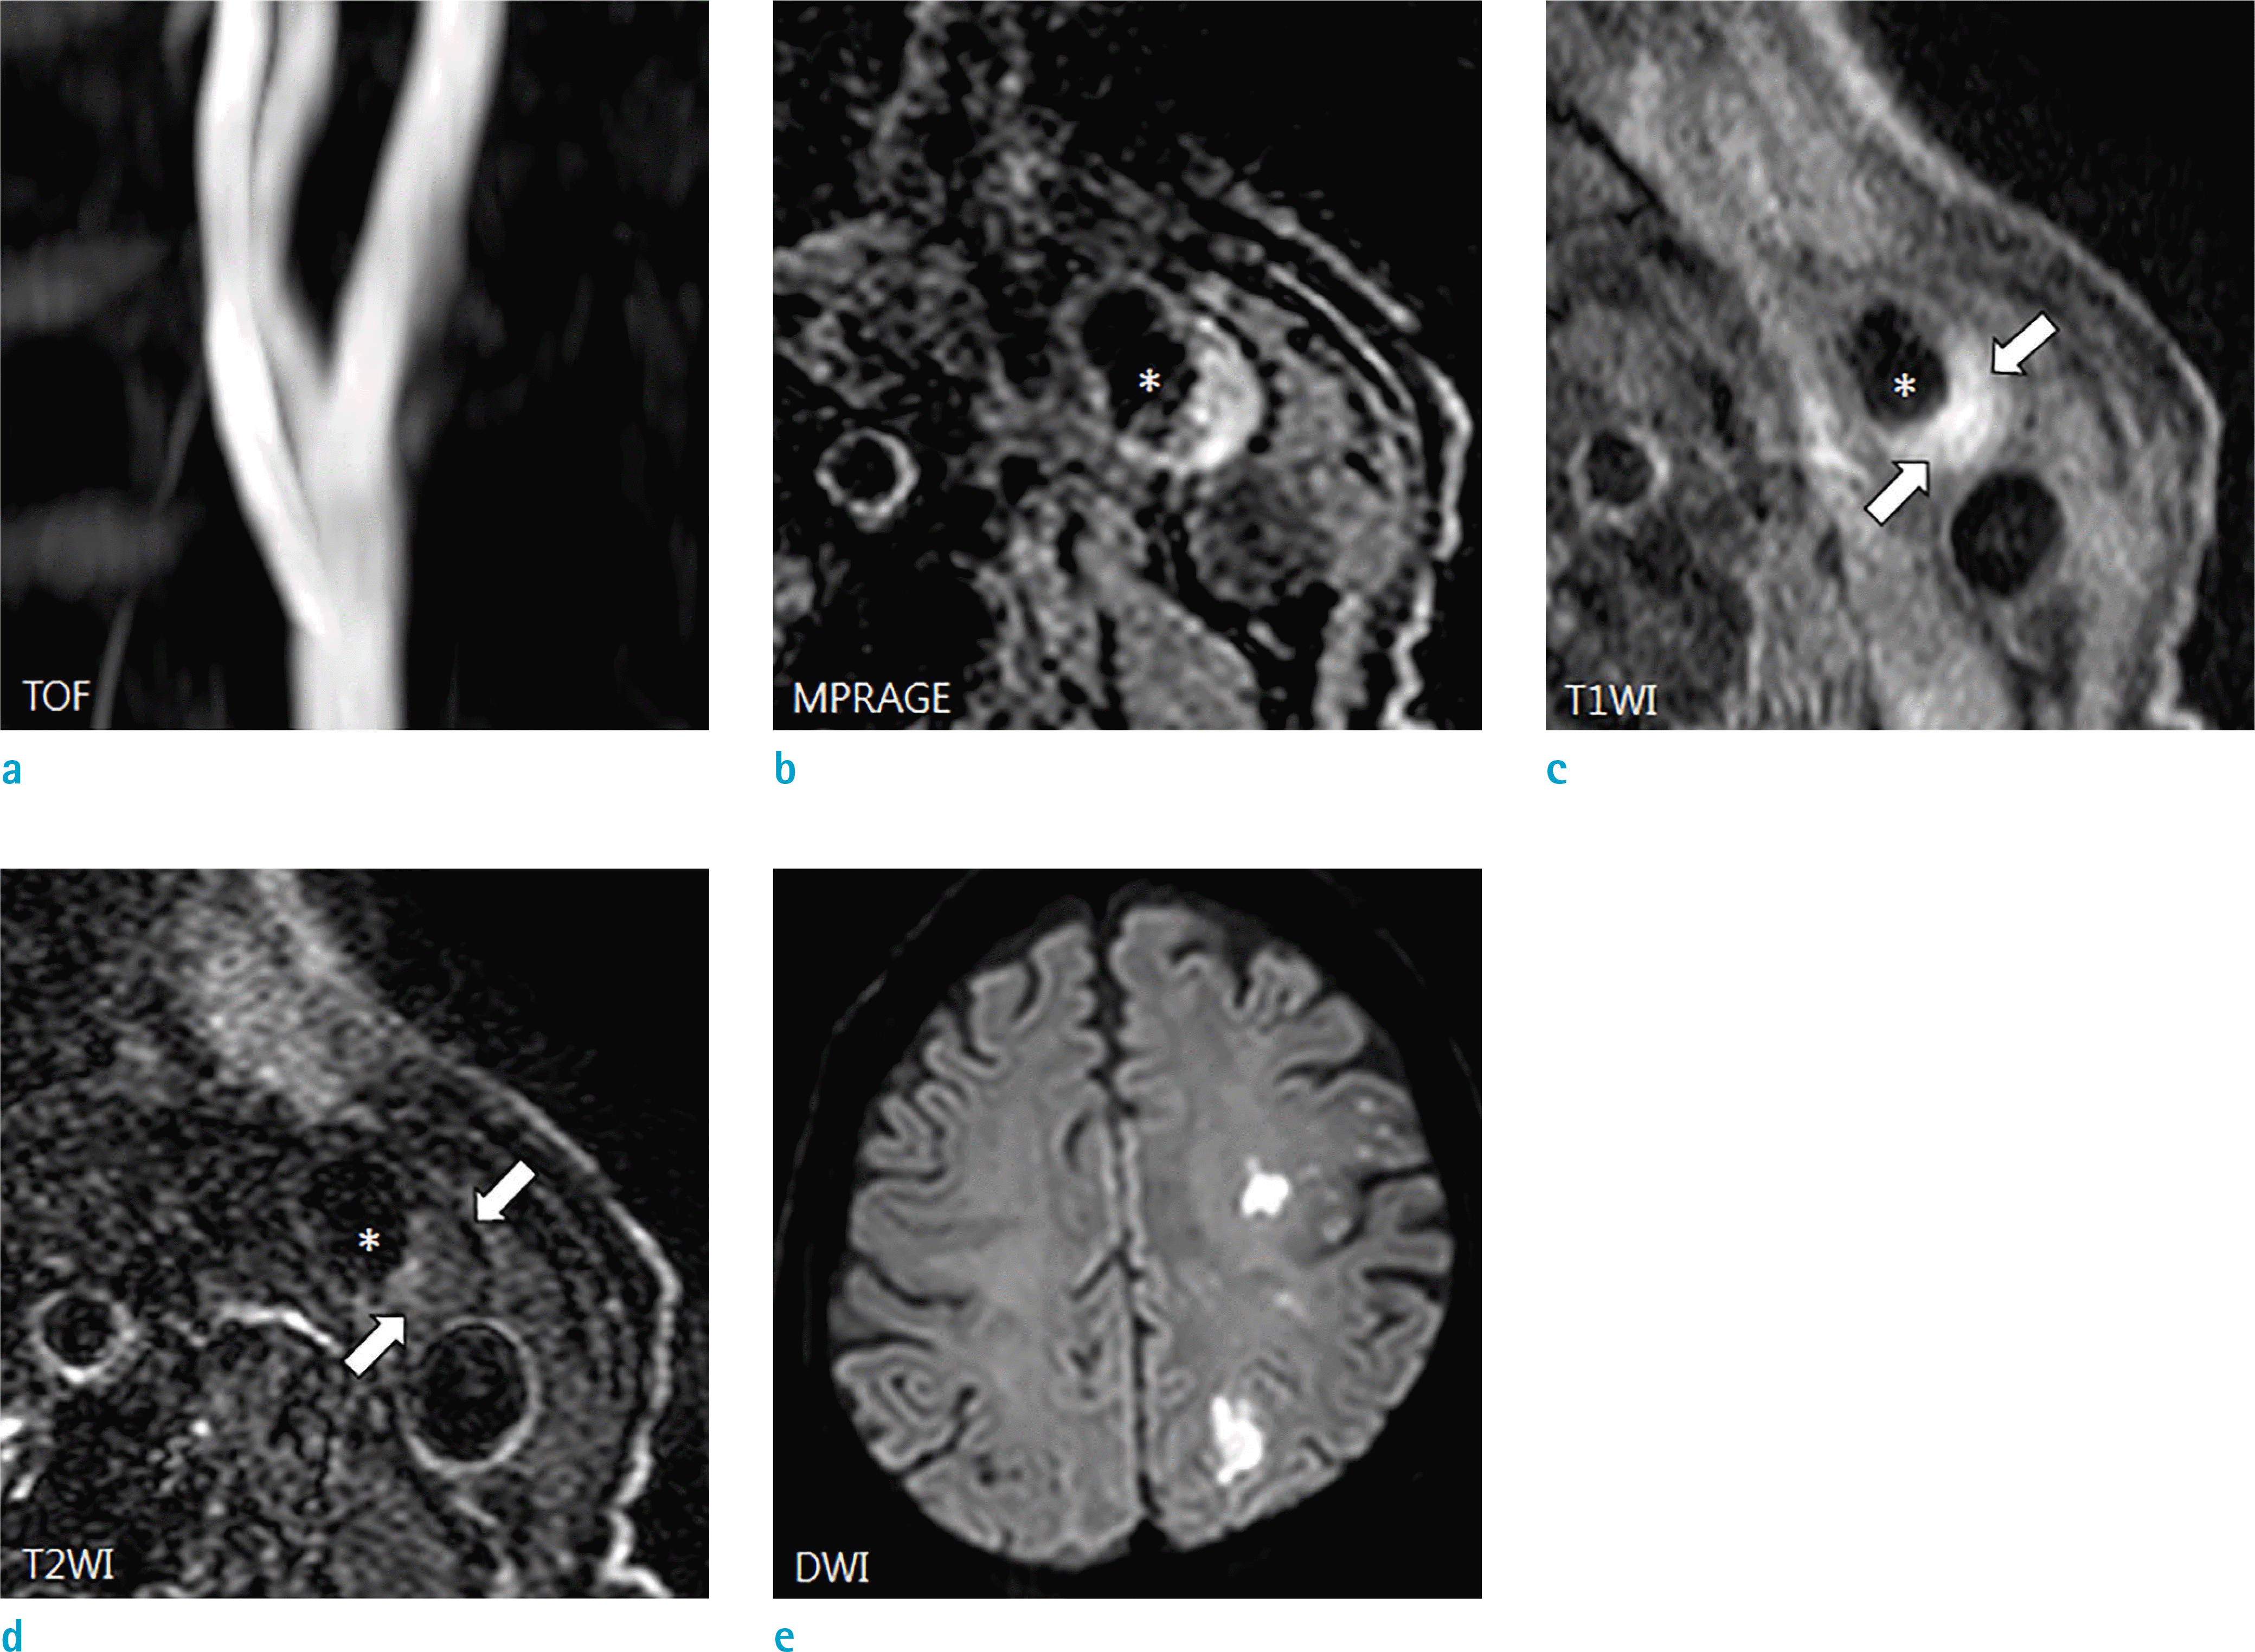
 | Fig. 1.An example of a 67-year-old man with type I IPH and ipsilateral cerebral infarction. (a) 3D TOF angiogram shows the high signal intensity of the plaque causing mild stenosis. (b) MPRAGE image also shows the high signal intensity of the plaque, which suggests IPH. (c, d) High signal intensity on the T1-weighted image (c) and iso-signal intensity on the T2-weighted image (d) indicate type I IPH (arrows). (e) DWI shows diffusion restriction in the left ICA territory. The asterisk indicates the ICA lumen. 3D = three-dimensional; DWI = diffusion-weighted imaging; ICA = internal carotid artery; IPH = intraplaque hemorrhage; TOF = time of flight |
 | Fig. 2.An example of a 62-year-old man with type II IPH and territorial infarction. (a) 3D TOF angiogram shows moderate focal stenosis in the left proximal ICA. (b) MPRAGE image shows the high signal intensity of the plaque, which suggests IPH. (c, d) A high signal intensity lesion on T1- and T2-weighted images (arrows) corresponds to a high signal intensity lesion on MPRAGE sequence. Also, note the iso-signal intensity lesion within the plaque (arrowheads), which shows no contrast enhancement on the contrast-enhanced T1-weighted image (not shown). This finding indicates type II IPH with a lipid-rich necrotic core. (e) DWI demonstrates territorial ischemic events. The asterisk indicates the ICA lumen. 3D = three-dimensional; DWI = diffusion-weighted imaging; ICA = internal carotid artery; IPH = intraplaque hemorrhage; TOF = time of flight |
 | Fig. 3.Association between IPH and acute ischemic events by further stratifying carotid plaques according to the grade of stenosis. IPH = intraplaque hemorrhage |
 | Fig. 4.Association between IPH and acute ischemic events by further stratifying IPH according to the age of hemorrhage. IPH = intraplaque hemorrhage |
 | Fig. 5.A 78-year-old man with IPH and progression of carotid stenosis. (a, b) TOF-MRA image (a) and axial 3D TOF source image (b) examined 45 months ago show moderate stenosis (arrows) in the right proximal ICA with the high signal intensity of the plaque. (c-e) Plaque MR images examined due to dysarthria show progression of luminal stenosis (arrows) and high signal intensity of the plaque on the TOF source image (d) and MPRAGE (e). The asterisk indicates the ICA lumen. ICA = internal carotid artery; IPH = intraplaque hemorrhage; MR = magnetic resonance; TOF-MRA = time-of-flight magnetic resonance angiography |
Table 1.
Baseline Clinical Characteristics of Patients with and without IPH
| IPH (+) (n = 34) | IPH (−) (n = 27) | P value† | ||||
|---|---|---|---|---|---|---|
| Type I (n = 18) | Type II (n = 16) | P value* | Total (n = 34) | |||
| Mean age, y | 73.7 ± 5.5 | 74.6 ± 1.0 | 0.751 | 74.1 ± 9.0 | 70.3 ± 9.4 | 0.083 |
| Men, n (%) | 16 (88.9) | 14 (87.5) | 1 | 30 (88.2) | 20 (74.1) | 0.190 |
| HTN, n (%) | 15 (83.3) | 13 (81.3) | 1 | 28 (82.4) | 24 (88.9) | 0.718 |
| DM, n (%) | 4 (22.2) | 5 (31.3) | 0.703 | 9 (26.5) | 11 (40.7) | 0.238 |
| Hyperlipidemia, n (%) | 1 (5.6) | 5 (31.3) | 0.078 | 6 (17.6) | 8 (29.6) | 0.269 |
| IHD, n (%) | 4 (22.2) | 2 (12.5) | 0.660 | 6 (17.6) | 6 (22.2) | 0.655 |
| Smoking, n (%) | 1 (5.6) | 1 (6.3) | 1 | 2 (5.9) | 3 (11.1) | 0.647 |
| Medication, n (%) | ||||||
| Statin | 4 (22.2) | 6 (37.5) | 0.457 | 10 (29.4) | 6 (22.2) | 0.526 |
| Antiplatelet | 4 (22.2) | 3 (18.8) | 1 | 7 (20.6) | 10 (37.0) | 0.155 |
Table 3.
Progression of Stenosis According to the Presence or Absence of IPH


 PDF
PDF ePub
ePub Citation
 Print
Print


 XML Download