

 PDF
PDF ePub
ePub Citation
 Print
Print


Abstract
Purpose
Caffeine is the most widely consumed psychostimulant. It is often adopted as a tool to modulate brain activations in fMRI studies. However, its pharmaceutical effect on task-induced deactivation has not been fully examined in fMRI. Therefore, the purpose of this study was to examine the effect of caffeine on both activation and deactivation under sustained attention.
Materials and Methods
Task fMRI was acquired from 26 caffeine naive healthy volunteers before and after taking caffeine pill (200 mg).
Results
Statistical analysis showed an increase in cognition-load dependent task activation but a decrease in load dependent deactivation after caffeine ingestion. Increase of attention and memory task activation and its load-dependence suggest a beneficial effect of caffeine on the brain even though it has no overt behavior improvement. The reduction of deactivation by caffeine and its load-dependence indicate reduced facilitation from task-negative networks.
Go to : 
References
1. Fredholm BB, Battig K, Holmen J, Nehlig A, Zvartau EE. Actions of caffeine in the brain with special reference to factors that contribute to its widespread use. Pharmacol Rev. 1999; 51:83–133.
2. Frary CD, Johnson RK, Wang MQ. Food sources and intakes of caffeine in the diets of persons in the United States. J Am Diet Assoc. 2005; 105:110–113.

3. Ferre S. An update on the mechanisms of the psychostimulant effects of caffeine. J Neurochem. 2008; 105:1067–1079.
4. Mandel HG. Update on caffeine consumption, disposition and action. Food Chem Toxicol. 2002; 40:1231–1234.
5. Axelrod J, Reichenthal J. The fate of caffeine in man and a method for its estimation in biological material. J Pharmacol Exp Ther. 1953; 107:519–523.
6. Smith A. Effects of caffeine on human behavior. Food Chem Toxicol. 2002; 40:1243–1255.
7. Lieberman HR. Caffeine in factors affecting human performance. The physical environment, Vol. 2. London: Academic Press,. 1992.
8. Smith A, Sutherland D, Christopher G. Effects of repeated doses of caffeine on mood and performance of alert and fatigued volunteers. J Psychopharmacol. 2005; 19:620–626.
9. Adan A, Prat G, Fabbri M, Sanchez-Turet M. Early effects of caffeinated and decaffeinated coffee on subjective state and gender differences. Prog Neuropsychopharmacol Biol Psychiatry. 2008; 32:1698–1703.
10. Koppelstaetter F, Poeppel TD, Siedentopf CM, et al. Caffeine and cognition in functional magnetic resonance imaging. J Alzheimers Dis. 2010; 20(Suppl 1):S71–84.
11. Einother SJ, Giesbrecht T. Caffeine as an attention enhancer: reviewing existing assumptions. Psychopharmacology (Berl). 2013; 225:251–274.
12. Addicott MA, Yang LL, Peiffer AM, et al. The effect of daily caffeine use on cerebral blood flow: how much caffeine can we tolerate? Hum Brain Mapp. 2009; 30:3102–3114.
13. Bendlin BB, Trouard TP, Ryan L. Caffeine attenuates practice effects in word stem completion as measured by fMRI BOLD signal. Hum Brain Mapp. 2007; 28:654–662.
14. Chen Y, Parrish TB. Caffeine dose effect on activation-induced BOLD and CBF responses. Neuroimage. 2009; 46:577–583.
15. Laurienti PJ, Field AS, Burdette JH, Maldjian JA, Yen YF, Moody DM. Relationship between caffeine-induced changes in resting cerebral perfusion and blood oxygenation level-dependent signal. AJNR Am J Neuroradiol. 2003; 24:1607–1611.
16. Liau J, Perthen JE, Liu TT. Caffeine reduces the activation extent and contrast-to-noise ratio of the functional cerebral blood flow response but not the BOLD response. Neuroimage. 2008; 42:296–305.
17. Liu TT, Behzadi Y, Restom K, et al. Caffeine alters the temporal dynamics of the visual BOLD response. Neuroimage. 2004; 23:1402–1413.
18. Mulderink TA, Gitelman DR, Mesulam MM, Parrish TB. On the use of caffeine as a contrast booster for BOLD fMRI studies. Neuroimage. 2002; 15:37–44.
19. Perthen JE, Lansing AE, Liau J, Liu TT, Buxton RB. Caffeine-induced uncoupling of cerebral blood flow and oxygen metabolism: a calibrated BOLD fMRI study. Neuroimage. 2008; 40:237–247.
20. Shulman GL, Fiez JA, Corbetta M, et al. Common blood flow changes across visual tasks: II. Decreases in cerebral cortex. J Cogn Neurosci. 1997; 9:648–663.
21. Buckner RL, Andrews-Hanna JR, Schacter DL. The brain's default network: anatomy, function, and relevance to disease. Ann N Y Acad Sci. 2008; 1124:1–38.
22. Binder JR. Task-induced deactivation and the "resting" state. Neuroimage. 2012; 62:1086–1091.
23. Raichle ME, MacLeod AM, Snyder AZ, Powers WJ, Gusnard DA, Shulman GL. A default mode of brain function. Proc Natl Acad Sci U S A. 2001; 98:676–682.
24. Greicius MD, Srivastava G, Reiss AL, Menon V. Default-mode network activity distinguishes Alzheimer's disease from healthy aging: evidence from functional MRI. Proc Natl Acad Sci U S A. 2004; 101:4637–4642.
25. Brice C, Smith A. The effects of caffeine on simulated driving, subjective alertness and sustained attention. Hum Psychopharmacol. 2001; 16:523–531.
26. Brunye TT, Mahoney CR, Lieberman HR, Taylor HA. Caffeine modulates attention network function. Brain Cogn. 2010; 72:181–188.
27. Lieberman HR, Wurtman RJ, Emde GG, Roberts C, Coviella IL. The effects of low doses of caffeine on human performance and mood. Psychopharmacology (Berl). 1987; 92:308–312.
28. Roache JD, Griffiths RR. Interactions of diazepam and caffeine: behavioral and subjective dose effects in humans. Pharmacol Biochem Behav. 1987; 26:801–812.
29. Koppelstaetter F, Poeppel TD, Siedentopf CM, et al. Does caffeine modulate verbal working memory processes? An fMRI study. Neuroimage. 2008; 39:492–499.
30. Serra-Grabulosa JM, Adan A, Falcon C, Bargallo N. Glucose and caffeine effects on sustained attention: an exploratory fMRI study. Hum Psychopharmacol. 2010; 25:543–552.
31. Bakan P. Extraversion-introversion and improvement in an auditory vigilance task. Br J Psychol. 1959; 50:325–332.
32. Sheehan DV, Lecrubier Y, Sheehan KH, et al. The Mini-International Neuropsychiatric Interview (M.I.N.I.): the development and validation of a structured diagnostic psychiatric interview for DSM-IV and ICD-10. J Clin Psychiatry. 1998; 59(Suppl 20):22–33. ;quiz 34–57.
33. Wesnes K, Warburton DM. Effects of smoking on rapid information processing performance. Neuropsychobiology. 1983; 9:223–229.
34. Elorza A, Roschzttardtz H, Gomez I, et al. A nuclear gene for the iron-sulfur subunit of mitochondrial complex II is specifically expressed during Arabidopsis seed development and germination. Plant Cell Physiol. 2006; 47:14–21.
35. Tzourio-Mazoyer N, Landeau B, Papathanassiou D, et al. Automated anatomical labeling of activations in SPM using a macroscopic anatomical parcellation of the MNI MRI single-subject brain. Neuroimage. 2002; 15:273–289.
36. Fox MD, Snyder AZ, Vincent JL, Corbetta M, Van Essen DC, Raichle ME. The human brain is intrinsically organized into dynamic, anticorrelated functional networks. Proc Natl Acad Sci U S A. 2005; 102:9673–9678.
37. Haatveit B, Jensen J, Alnaes D, et al. Reduced load-dependent default mode network deactivation across executive tasks in schizophrenia spectrum disorders. Neuroimage Clin. 2016; 12:389–396.
38. Metzak PD, Riley JD, Wang L, Whitman JC, Ngan ET, Woodward TS. Decreased efficiency of task-positive and task-negative networks during working memory in schizophrenia. Schizophr Bull. 2012; 38:803–813.
39. Wong CW, Olafsson V, Tal O, Liu TT. Anticorrelated networks, global signal regression, and the effects of caffeine in resting-state functional MRI. Neuroimage. 2012; 63:356–364.
40. Klaassen EB, de Groot RH, Evers EA, et al. The effect of caffeine on working memory load-related brain activation in middle-aged males. Neuropharmacology. 2013; 64:160–167.
41. Ruijter J, Lorist MM, Snel J, De Ruiter MB. The influence of caffeine on sustained attention: an ERP study. Pharmacol Biochem Behav. 2000; 66:29–37.
42. Haller S, Rodriguez C, Moser D, et al. Acute caffeine administration impact on working memory-related brain activation and functional connectivity in the elderly: a BOLD and perfusion MRI study. Neuroscience. 2013; 250:364–371.
43. Childs E, de Wit H. Subjective, behavioral, and physiological effects of acute caffeine in light, nondependent caffeine users. Psychopharmacology (Berl). 2006; 185:514–523.
44. Brunye TT, Mahoney CR, Lieberman HR, Giles GE, Taylor HA. Acute caffeine consumption enhances the executive control of visual attention in habitual consumers. Brain Cogn. 2010; 74:186–192.
45. Keane MA, James JE. Effects of dietary caffeine on EEG, performance and mood when rested and sleep restricted. Hum Psychopharmacol. 2008; 23:669–680.
Go to :
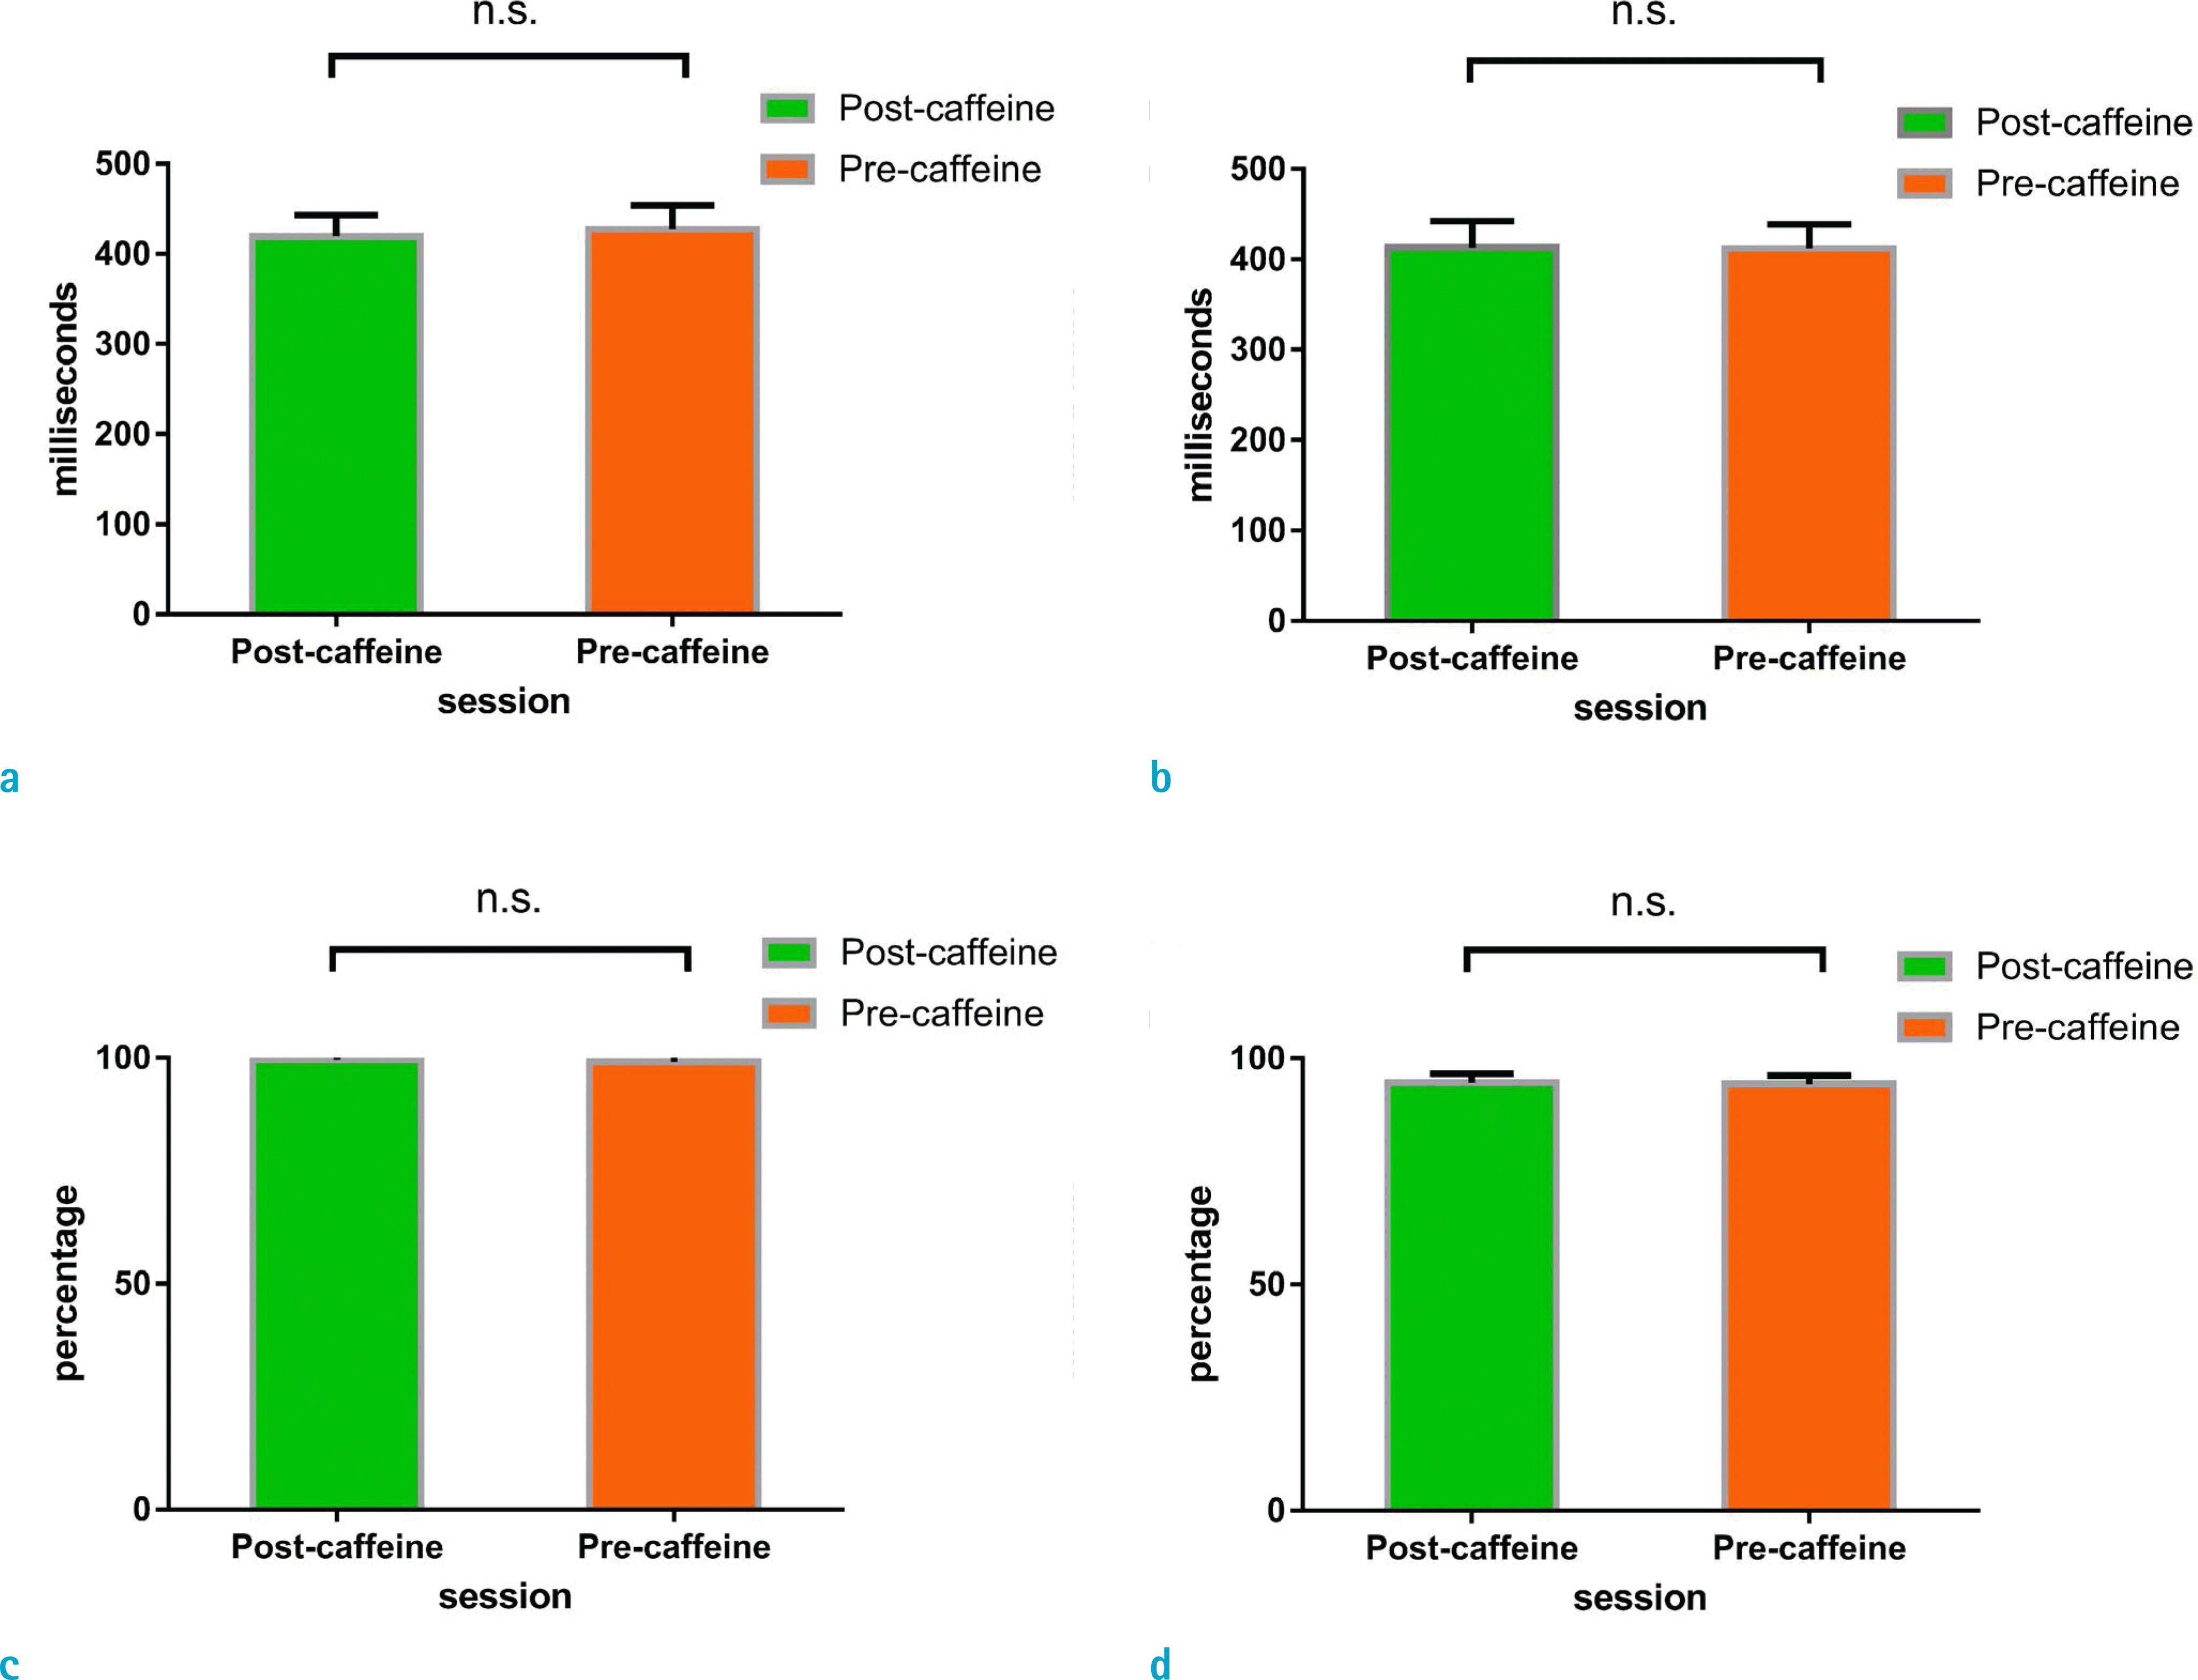 | Fig. 2.Bar graphs of reaction accuracy and reaction time before and after caffeine ingestion. (a) Mean reaction time at low-load condition, (b) Mean reaction time at high-load condition, (c) Mean reaction accuracy under low-load condition, (d) Mean reaction accuracy under high-load condition. |
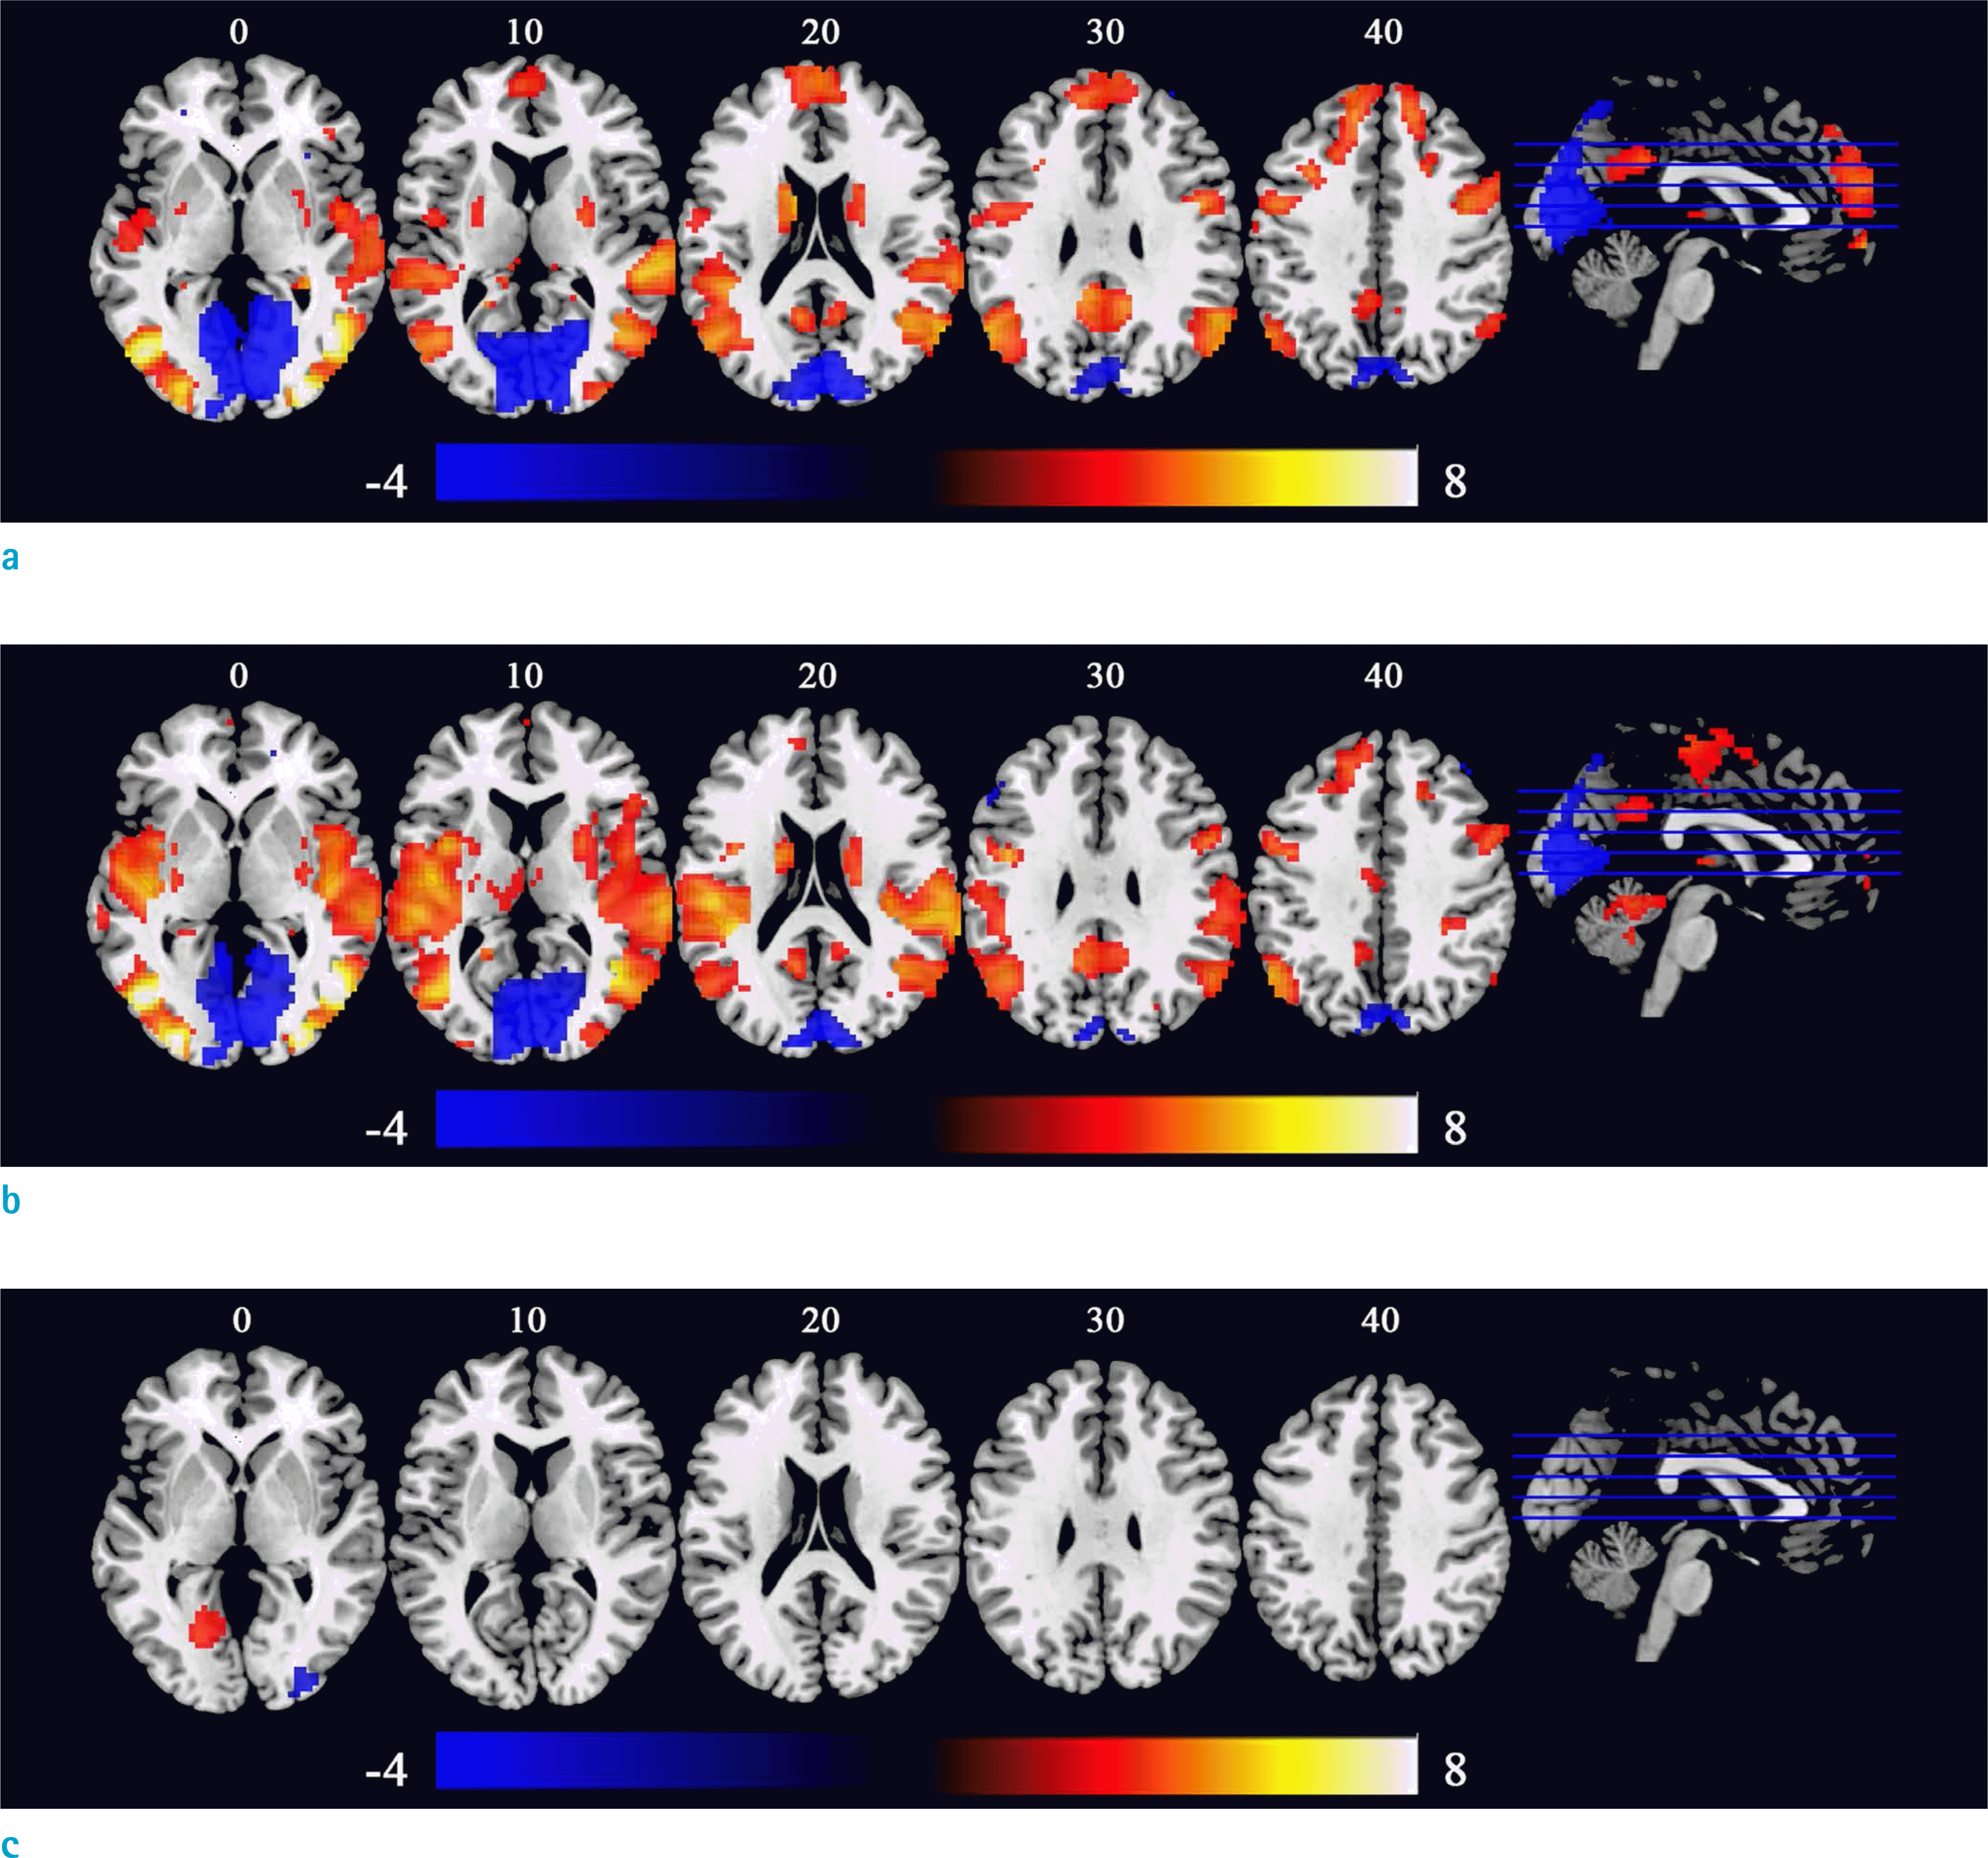 | Fig. 3.Low-load condition (attention task) versus baseline brain activation difference. (a) Group level activation difference before caffeine intake, (b) Group level activation difference after caffeine intake, (c) Caffeine-induced changes in low-load task activation versus baseline. Statistical significance level was defined at voxel-wise P < 0.005 and a cluster size of 46 (corrected for multiple comparison using AlphaSim, alpha < 0.05). Red means increased low-load task activation after caffeine intake. The number above each slice indicates slice location in the MNI space. Color bar indicates visualization window for t values. |
 | Fig. 4.High-load condition (sustained attention and working memory task) versus baseline brain activation difference. (a) Group level activation difference before caffeine intake, (b) Group level activation difference after caffeine intake, (c) Caffeine-induced changes to high-load task activation versus baseline. Statistical significance level was defined at voxel-wise P < 0.005 and a cluster size of 46 (corrected for multiple comparison using AlphaSim, alpha < 0.05). Red color means increased high-load task activation after caffeine intake. The number above each slice indicates slice location in the MNI space. Color bar indicates visualization window for t values. |
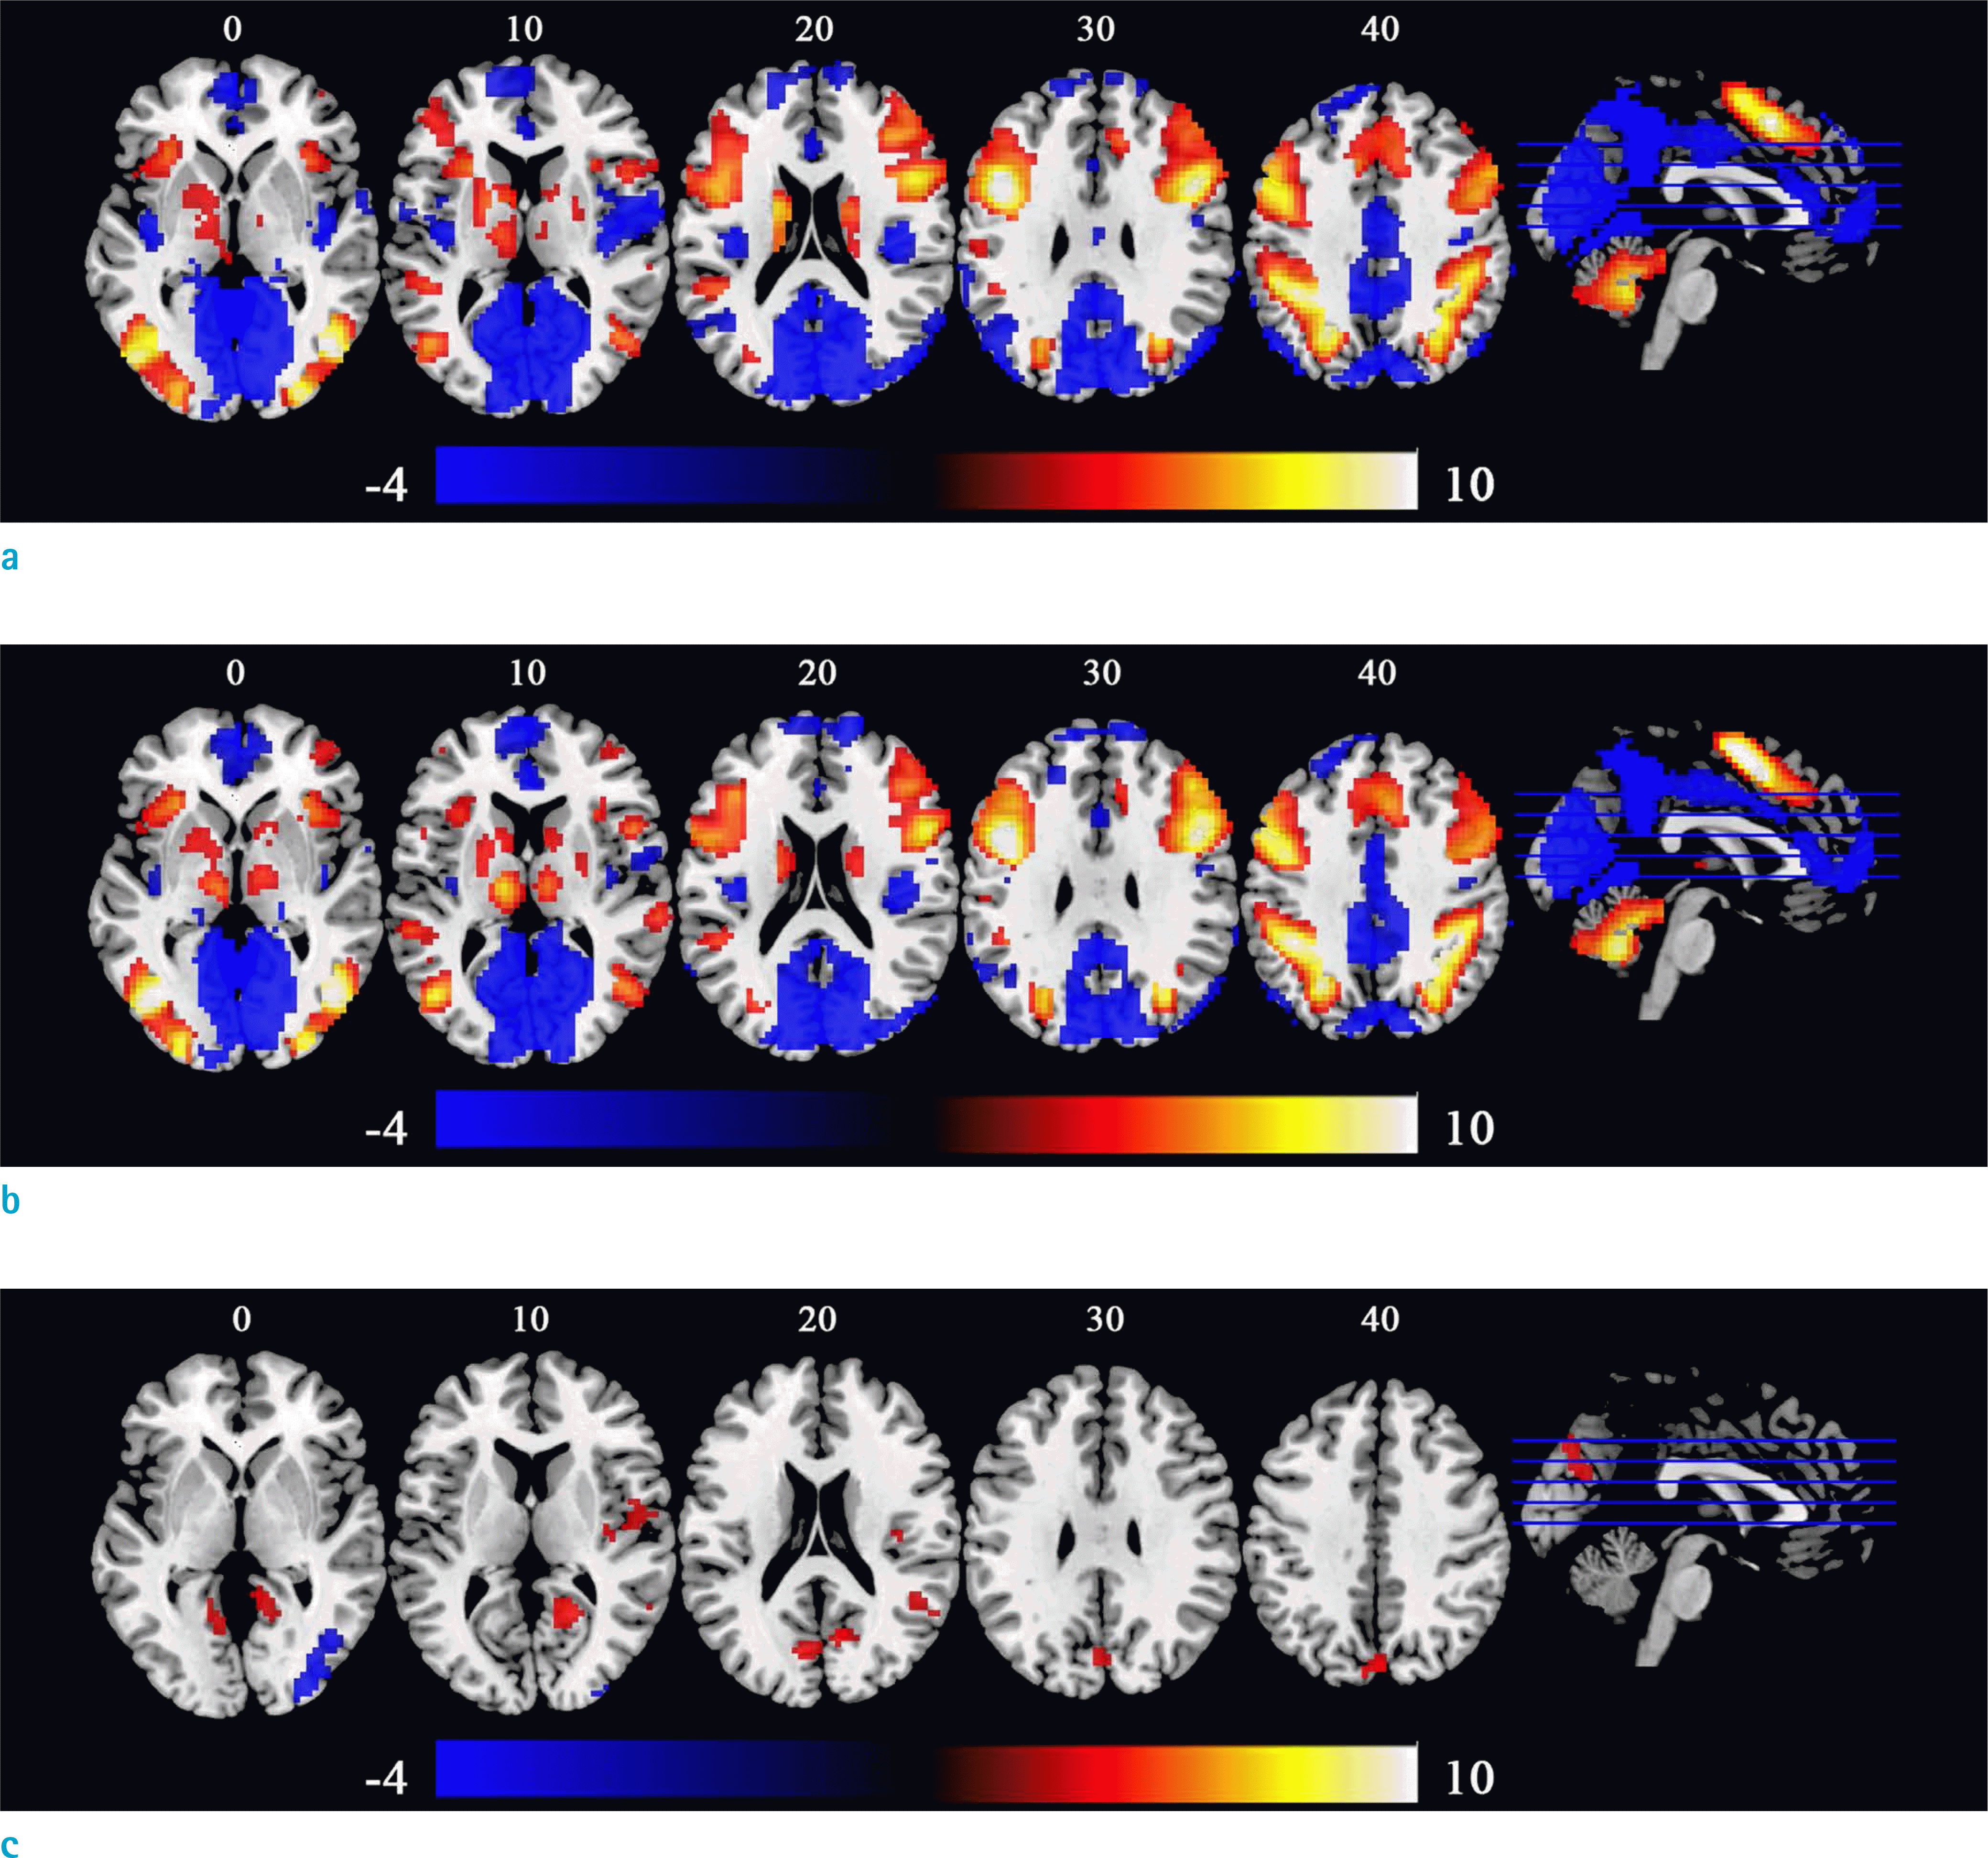
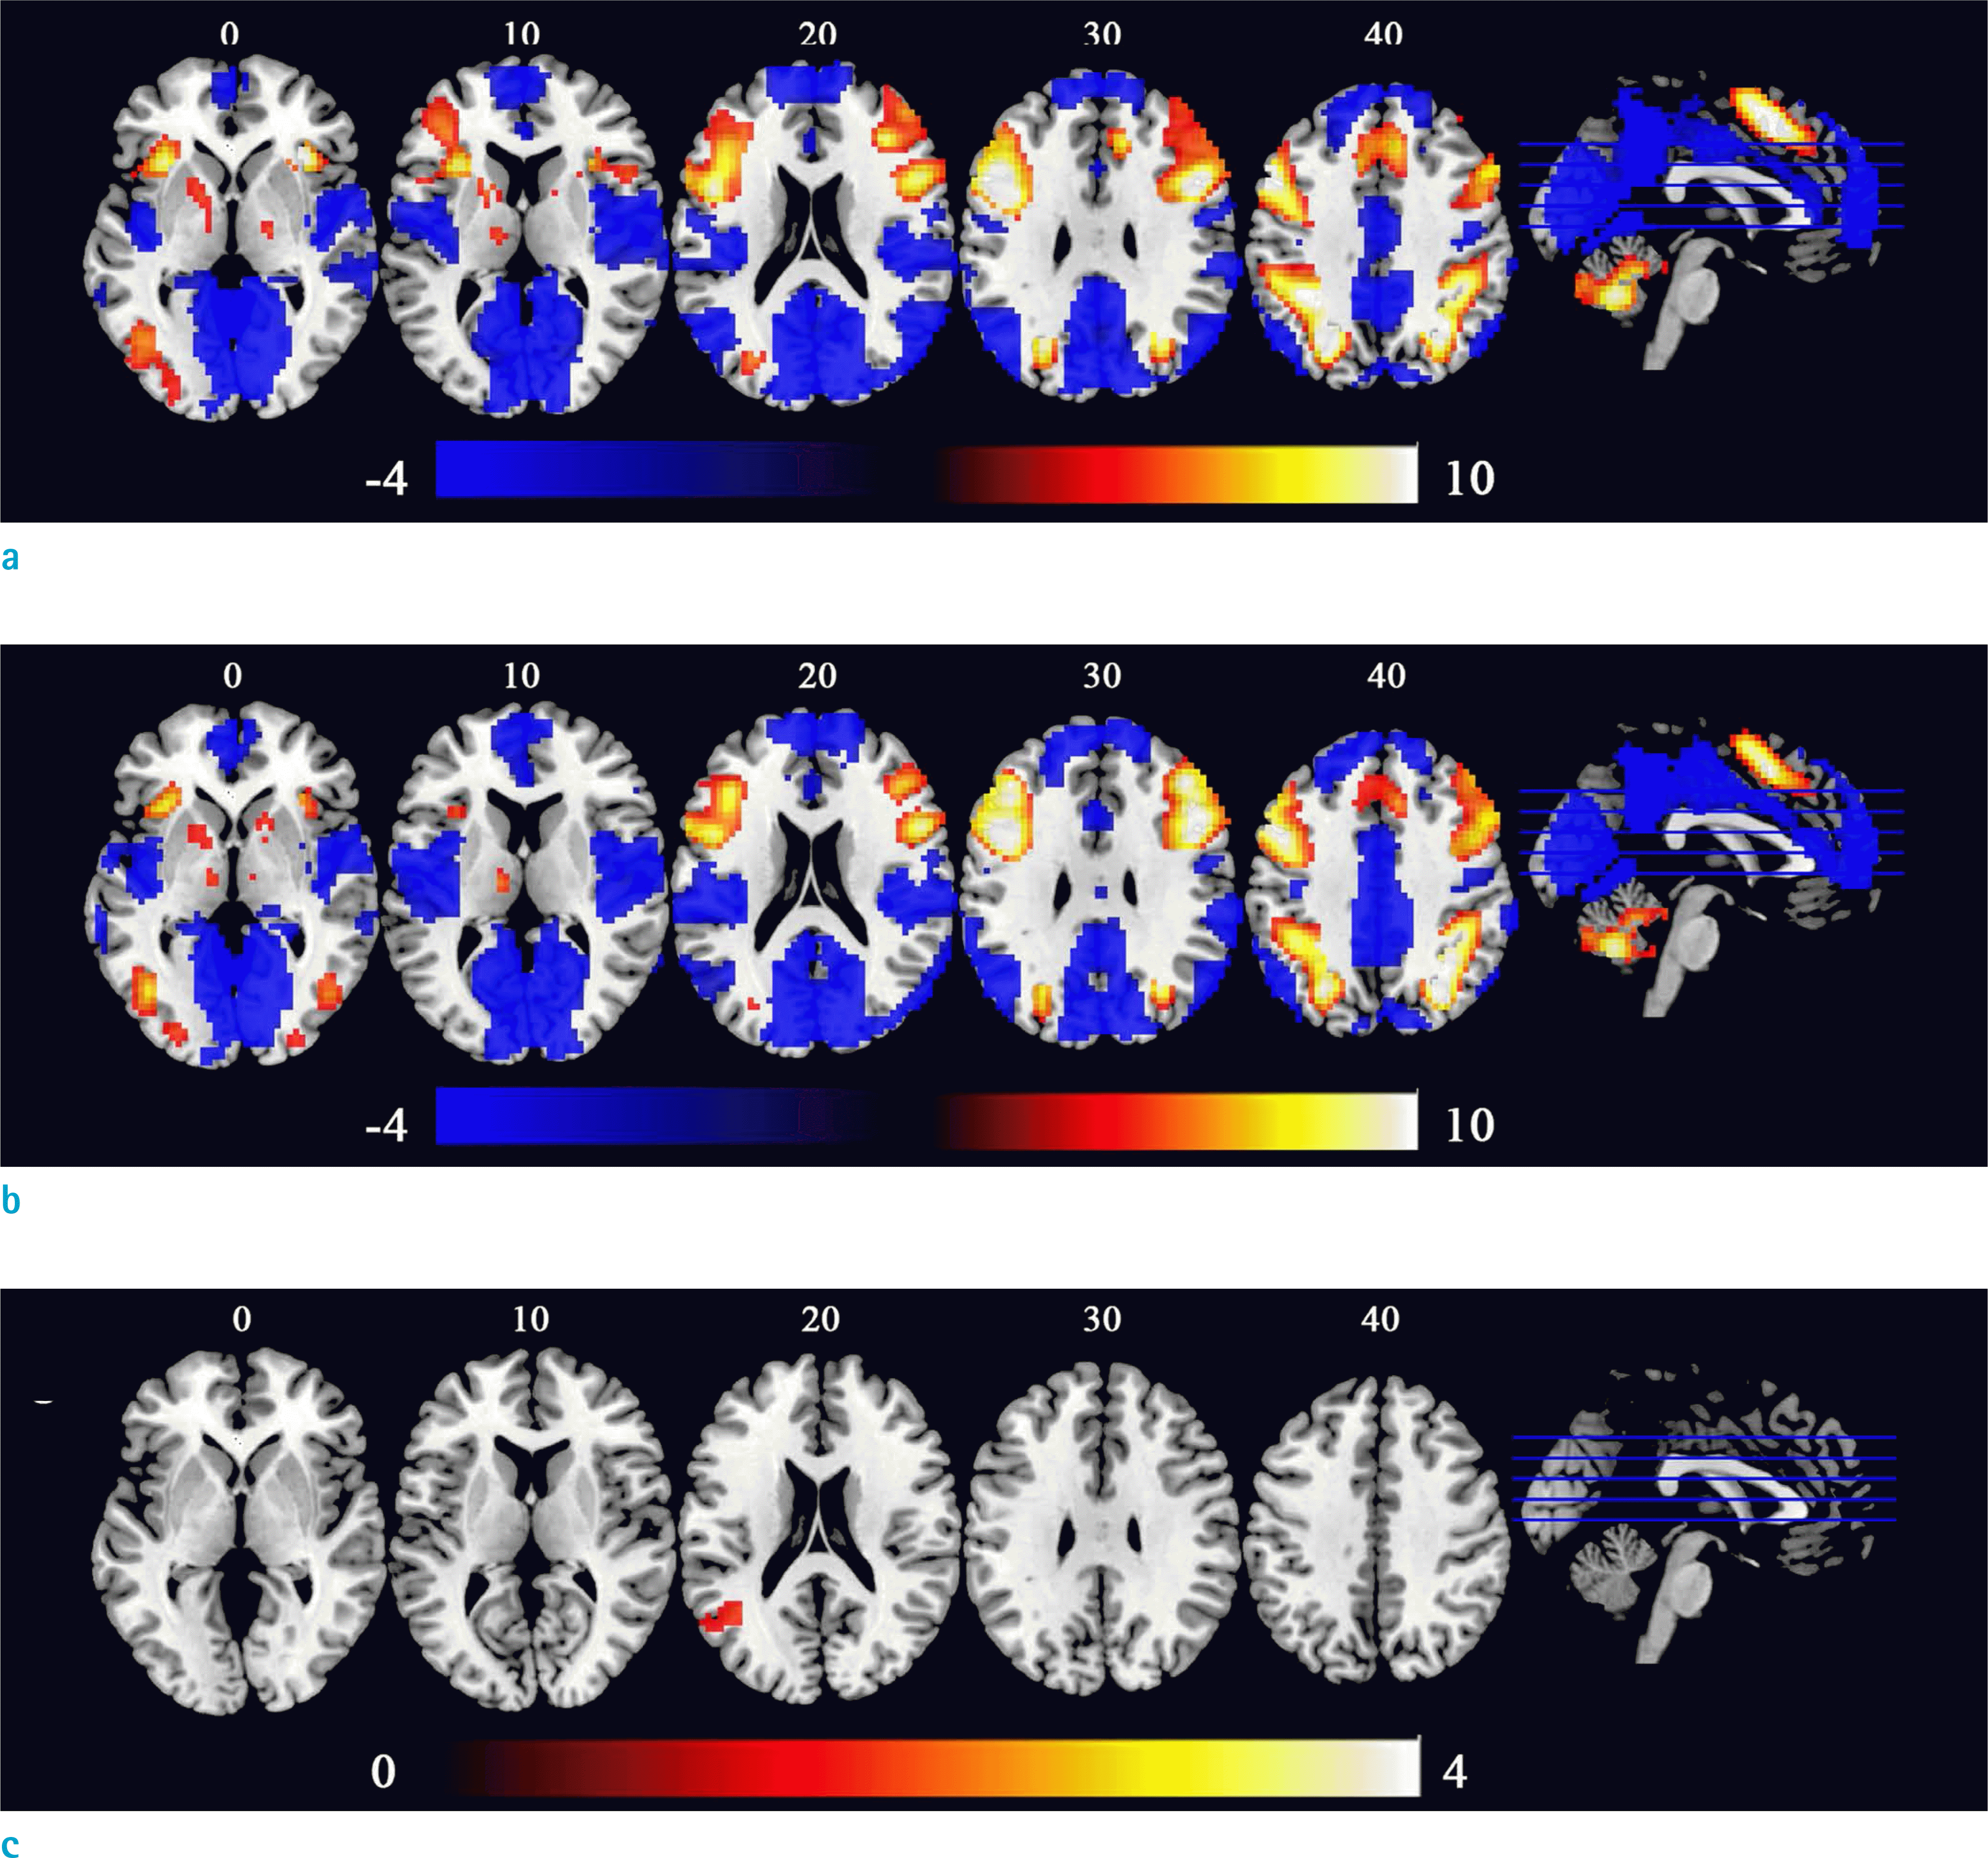 | Fig. 5.High-load condition (sustained attention and working memory task) versus low-load condition brain activation difference. (a) Group level activation difference before caffeine intake, (b) Group level activation difference after caffeine intake, (c) Caffeine-induced changes to high-load versus low-load activation difference. Statistical significance level was defined at voxel-wise P < 0.005 and a cluster size of 46 (corrected for multiple comparison using AlphaSim, alpha < 0.05). Red means greater high-load minus low-load task activation difference after caffeine intake. The number above each slice indicates slice location in the MNI space. Color bar indicates visualization window for t values. |
Table 1.
Behavioral Data (Mean and Standard Deviation) of Each Condition before and after Taking Caffeine
Table 2.
Whole Brain Analysis Local Maxima
 XML Download