

 PDF
PDF ePub
ePub Citation
 Print
Print


INTRODUCTION
Desmoid tumors, also known as aggressive fibromatosis, are rare and comprise only 0.03% of all neoplasms and 3% of all soft-tissue tumors. They usually occur sporadically, but approximately 5% of cases are associated with familial adenomatous polyposis (FAP) that occurs in Gardner syndrome (1234). Desmoid tumors are benign fibromatous tumors characterized by histopathologically abnormal fibroblastic/myofibroblastic proliferation and marked accumulation of intracellular collagen (567). They can arise from any part of the body and are classified into the intra-abdominal, abdominal wall, and extra-abdominal subtypes according to location (89). Although histologically benign, desmoid tumors are often locally invasive and associated with a high local recurrence rate after resection (310). They are generally asymptomatic; however, various symptoms occur as a result of the compressive or obstructive effects on other organs (2311).
Previously reported findings of the imaging of desmoid tumors demonstrated varying degrees of homogeneous enhancement on CT and MRI scans and may show a mass-forming or infiltrative growth pattern (2911). However, the imaging findings of desmoid tumors reported thus far are very diverse and often similar to those of malignant tumors in signal intensity (SI), tumor margination, and in the tendency to encase adjacent organs (121314). Therefore, the diagnosis of desmoid tumors is a challenge for both radiologists and clinicians. A diffusion-weighted image (DWI) is widely used for a variety of tumors or disease entities. Several previous studies have reported that DWI can distinguish malignant tumors from benign tumors (15); however, there was only one report regarding the DWI of primarily desmoid tumors in the extremities. In this study, we compared the imaging features and DWI findings of desmoid tumors that were primarily located in the abdomen of patients with intra-abdominal malignant tumors. We also tried to compare the PET-CT findings between desmoid tumors and intra-abdominal malignancies. The purpose of this study was to evaluate the imaging findings of desmoid tumors, using various imaging modalities including CT, MRI and PET-CT, and to evaluate whether DWI can help differentiate desmoid tumors from other intra-abdominal or abdominal wall malignancies.
MATERIALS AND METHODS
Patients
This study received a study-specific Institutional Review Board approval and waiver of informed consent. A total of 27 patients who were diagnosed with a pathologically confirmed desmoid tumor between 2005 and 2016 were enrolled in the study. Twenty-six patients were diagnosed with desmoids tumors by surgical resection and one patient by needle biopsy.
Four patients had a family history of FAP; 4 patients had a history of colorectal cancer; and, 13 patients had a history of surgery. Of 27 patients, 23 underwent CT, 12 underwent MRI including 9 with a DWI, and 8 patients underwent PET-CT before surgery.
Thirty-two patients, who were pathologically confirmed as having a malignant soft tissue tumor from 2009 to 2015, were also enrolled in order to compare their apparent diffusion coefficient (ADC) values with those of the desmoid tumors. The malignant soft tissue tumors included liposarcomas (n = 4), malignant peripheral nerve sheath tumors (n = 4), gastrointestinal stromal tumors (n = 4), endometrial stromal sarcomas (n = 3), rhabdomyosarcomas (n = 2), leiomyosarcomas (n = 2), lymphomas (n = 2), squamous cell carcinomas (n = 2), Ewing sarcoma (n = 1), malignant melanoma (n = 1), primitive neuroendocrine tumor (n = 1), dermatofibrosarcoma protuberans (n = 1), malignant solitary fibrous tumor (n = 1), synovial sarcoma (n = 1), myeloid sarcoma (n = 1), carcinosarcoma (n = 1), and malignant spindle cell tumor (n = 1).
Computed Tomography
All CT scans were performed using one of the following commercially available multi-detector CT scanners: Sensation 64 (Siemens Medical Solutions, Erlangen, Germany); LightSpeed VCT (GE Medical Systems, Milwaukee, WI, USA): or Volume Zoom (Siemens Medical Solutions, Erlangen, Germany). Every patient received 100–150 mL of an intravenous contrast agent (iopromide, Ultravist 300; Bayer Schering Healthcare, Berlin, Germany) at a rate of 3 mL/s. The scanning parameters were as follows: slice thickness, 0.625–1 mm; beam pitch, 1/1; gantry rotation time, 0.5/0.5 sec; and tube voltage, 100–120 kV(p). The data were reformatted in the axial and coronal planes with a 5-mm section thickness at 5-mm intervals. Readers reviewed all CT images with a picture archiving and communication system workstation (Marotech 5.4, Seoul, Korea).
Magnetic Resonance Imaging
Three patients underwent MRI using a 1.5-T MRI scanner (Magnetom Vision Plus; Siemens) and 9 patients underwent MRI using a 3-T MR scanner (Magnetom Verio; Siemens Medical Solutions, Erlangen, Germany) with a phased-array coil. MRI was performed with the following sequences: 1) a sagittal T2-weighted fast spin-echo sequence; 2) an axial T1-weighted fast spin-echo sequence (TR/TE 750/10; flip angle 120~150; field of view [FOV] 200 × 200–350 × 350 mm; matrix size 320 × 224; 2–4 NEX; slice thickness 5 mm with no gap); and, 3) an axial T2-weighted fast spin echo sequence (TR/TE 4000/118; flip angle 120–140; FOV 200 × 200–350 × 350 mm; matrix size 320 × 224; 2 NEX; slice thickness 5 mm with no gap). Diffusion-weighted MR images were performed in the axial plane using a single shot-echo planar imaging technique with a b factors of 0, 500, and 1000 sec/mm2, TR/TE 6100–9000/83, FOV 200–350 mm, matrix size 120 × 80, 2 NEX, and a slice thickness of 5 mm with no slice gap. The contrast-enhanced T1-weighted image with fat suppression on the axial plane with TR/TE 640/13, flip angle 150, and a slice thickness of 5 mm was obtained after an intravenous injection of 0.1 mmol/kg Gadobutrol (Gadovist, Schering, Berlin, Germany) or gadopentetate dimeglumine (Magnevist; Schering, Berlin, Germany) at a rate of 3 mL/s followed by a 30-mL saline flush.
Positron Emission Tomography - Computed Tomography
Each patient fasted for 6 hours before the PET/CT examination. Scanning started one hour after an intravenous injection of 18F-FDG (370-555 MBq) from the orbitomeatal line to the upper thigh. No intravenous contrast agent was administered. Studies were obtained via combined PET/CT in-line systems, specifically either the Biograph Duo or Biograph TruePoint (Siemens Medical Solutions, Knoxville, TN, USA). Six to eight bed positions were used and the acquisition time was 2 minutes per bed position. The CT scanned from the orbitomeatal line to the proximal thigh (120 kV, 50 mAs, and 5-mm slice thickness; 130 kV) and PET was performed over the same body region. The CT data were used for attenuation correction and image reconstruction was performed with a standard ordered-subset expectation maximization algorithm (OSEM; two iterations, eight subsets). The axial spatial resolution was approximately 6.5–4.5 mm. All PET/CT images were reviewed with fusion software (Syngo; Siemens Medical Solutions, Knoxville, TN, USA) that provided multiplanar reformatted images and displayed PET images with attenuation correction, CT images, and PET/CT fusion images.
Image Interpretation - Qualitative Analysis
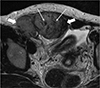
Two radiologists with 15 and 3 years of experience, respectively, reviewed 23 CT and 12 MR images of desmoid tumors in consensus and recorded data regarding the shape, multiplicity, size, location, degree of enhancement, presence or absence of calcification or hemorrhage and pattern of T2-weighted imaging on MRI. The shape of the mass was classified into mass-forming, infiltrative, and combined forms. The location of the mass was classified into abdominal wall, intra-abdominal and extra-abdominal groups. The degree of enhancement was classified as mild, moderate, or marked relative to the adjacent muscle's enhancement, and homogeneity of enhancement was visually assessed as homogeneous or heterogeneous by two radiologists in consensus on the CT or/and MR images. For the 12 patients who underwent MRI, the signal intensities of the masses on the T1- and T2-weighted imaging were classified as low, intermediate, and high as compared to the adjacent muscle's signal intensity. Whirling or band-like patterns were defined as elongated or stripe-like repeated low signal intensity lesions on the T2-weighted MRI (Fig. 1), and the presence or absence of whirling or band-like patterns was recorded for each mass. Furthermore, we compared the imaging features of the MRI scans between the desmoid tumors and 32 malignant soft tissue tumors arising from the abdominal cavity or wall, including the signal intensities on T1- and T2-weighted imaging, enhancement degree, homogeneity, and the presence or absence of dark SI whirling or bank-like patterns on the T2-weighted image.
Image Interpretation - Quantitative Analysis
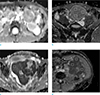
Nine patients underwent diffusion-weighted images. In eight patients, three regions of interest (ROIs) of approximately 1.0 cm × 1.0 cm were manually placed on the ADC map and ADC values were recorded by averaging the values for the three ROIs (Fig. 2a, b). Only one ROI was obtained for one patient who had a small lesion (maximum diameter was 2.0 cm).
In addition, we enrolled 32 patients with pathologically confirmed malignant soft tissue tumors arising from the abdominal cavity or wall in order to compare the ADC values between the desmoid tumors and malignant soft tissue tumors. Three ROIs were manually placed on the ADC map and the ADC values of the 3 ROIs were measured as above for each malignant tumor (Fig. 2c, d).
The maximum standardized uptake values (SUVmax) of the eight desmoid tumors and thirty-two malignant soft tissue tumors on the PET/CT images were measured with the Syngo fusion software. This step applied to the eight patients who had underwent a PET-CT.
A Mann-Whitney U test was used to determine whether the differences between the ADC values and SUVmax of the desmoid and malignant soft tissue tumors were statistically significant.
RESULTS
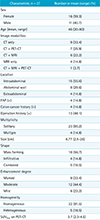
Table 1 summarizes the clinical data for the 27 patients who had desmoid tumors (age range, 20–80 years; mean age, 46 years; male:female = 11:16). The mean tumor size was 6.77 cm (range, 2.5–26 cm; standard deviation [SD], 5.21 cm). Intra-abdominal (n = 15), abdominal wall (n = 8) and extra-abdominal (n = 4) tumors were present.
The tumors were related to FAP in four patients. The remaining patients had sporadic desmoid tumors. Thirteen patients had a positive history for operations including colectomy, Cesarean section, and cholecystectomy. The qualitative imaging characteristics of the tumors are presented in Table 1. The most common tumor shape was mass forming (n = 18), followed by infiltrative (n = 4) and combined (n = 5). Most tumors were solitary, though four showed multiplicity (4/27). Most of the desmoid tumors showed moderate or marked enhancement (21/27) and homogeneous enhancement (22/27). The presence of calcification (n = 2) and hemorrhage (n = 1) were unusual findings in the desmoid tumors.
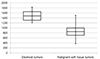
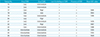
MR characteristics are presented in Table 2. Most of the desmoid tumors showed low to intermediate signal intensity on the T1-weighted images and intermediate to high signal intensity on the T2-weighted images. The whirling or band-like pattern was seen in 11 of the 12 desmoid tumors. The 32 malignant soft tissue tumors showed low to intermediate signal intensities on the T1-weighted image (24/32) and intermediate to high signal intensities on the T2-weighted image (14 high, 16 intermediate). Four of the 32 malignant tumors showed a whirling or band-like pattern on the T2-weighted image. The malignant tumors typically displayed moderate to marked contrast enhancements (26 marked, 3 moderate, 3 mild) with a heterogeneous enhancement (21/32). All desmoid tumors and malignant soft tissue tumors exhibited high signal intensities on the DWI scans. The mean ADC value of the desmoid tumors was 1493 × 10−6 (min: 1204 × 10−6 mm2/s, max: 1828 × 10−6 mm2/s, SD: 221 × 10−6 mm2/s), which was significantly higher than that of the malignant soft tissue tumors (mean: 873 × 10−6 mm2/s, min: 370 × 10−6 mm2/s, max: 1503 × 10−6 mm2/s, SD: 273 × 10−6 mm2/s, P < 0.001; Fig. 3).
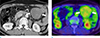
On the PET-CT images, the mean SUVmax of the desmoid tumors (mean, 3.7; 2.3–4.5 ± 0.72; Fig. 4) was significantly lower than that of the malignant soft tissue tumors (mean, 10.9; 3.3–33.7 ± 7.39, P < 0.001).
DISCUSSION
Fibromatosis is a rare mesenchymal tumor characterized histologically by the proliferation of fibroblasts and myofibroblasts with the production of intracellular collagen (25). Fibromatosis can be classified according to its anatomical location into superficial and deep fibromatosis, which show different genetic backgrounds and clinical behavior (91617). Superficial fibromatosis arises from fascia or aponeuroses in the extremities including palmar, plantar, penile and knuckle pad locations and usually exhibits less symptomatic and slow-growing features compared to deep fibromatosis. Deep fibromatosis usually originates from the connective tissue in the muscles, fascia, or aponeurosis, and can be further classified into three subgroups: intra-abdominal, abdominal wall or extra-abdominal location. Deep fibromatosis is often known to be more aggressive and related to genetic differences. The imaging findings and symptoms of deep fibromatosis varied according to the location of the mass (5). In our study, all cases are classified as deep fibromatosis and the majority of cases (85%, n=23/27) were located at the intra-abdominal or abdominal wall. Because of the aggressive growth pattern of deep fibromatoses, the differentiation of intra-abdominal malignant soft tissue tumor is usually challenging.
In our study, most desmoid tumors showed a mass forming or infiltrative shape with moderate or marked homogeneous enhancement and rarely seen calcification or necrosis in the masses. These findings were similar and consistent with previous reports (101118). Recently, several MRI features of desmoid tumors have been reported and some researchers have correlated the various signal intensities of the mass on the T2-weighted images with histopathologic findings such as cellular, collagen, and myxoid components through the excellent soft tissue contrast resolution of MRI (61419). Consistent with previous reports (20), most of the desmoid tumors in our study also showed T2 low signal intensity band-like lesions (so called band sign) that corresponded with pathologically dense collagenous stroma. Because this finding is characteristic but not necessarily specific to desmoid tumors, the same may be seen in other benign and malignant soft tissue tumors (20). Some malignant tumors in our cases also showed T2 low signal intensity band or nodular areas less frequently (12.5%, n = 4/32) than the desmoid tumors did (91.7%, n = 11/12). In addition to the frequency, the morphological characteristics of a low signal intensity band in the malignant tumors were somewhat different to those of the desmoid tumors. The T2 low signal intensity band seen in the desmoid tumors were regular and small; whereas, those seen in malignant tumors appeared irregular and ugly. Further studies with a radiologic-pathologic correlation will be needed for a pathologic explanation of T2 low SI in malignant tumors.
It is still challenging for radiologists to distinguish desmoid tumors from malignant masses solely by qualitative imaging characteristics. The recent widespread use of DWI has allowed quantitative assessment of water diffusion in the tissue, which is expressed by the ADC. Several previous studies have reported that DWI can distinguish malignant tumors from benign tumors in a variety of locations (1521); however, few studies have reported the features of the desmoid tumors on DWI. Oka et al. (15) compared ADC values of 8 desmoid tumors with those of 74 malignant tumors. They found a significant difference in the ADC values between the desmoid and malignant soft tissue tumors. In their report, the mean ADC value of the desmoid tumors was 1.36 ± 0.48 × 10⁻³ mm2/s (mean ± SD), which is similar to the ADC value of the desmoid tumors of our study (1.47 ± 0.80 × 10⁻³ mm2/s). The higher ADC value of the desmoid tumors compared with malignant tumors may be due to low cellularity caused by the marked production of intercellular collagen in the desmoid tumors (1522). Oka et al. (15) reported the usefulness of DWI for differentiating between desmoid and malignant soft tissue tumors, but most of the masses were extra-abdominal and mainly located at the extremity; therefore, only 3 abdominal tumors were included. Extra-abdominal desmoid tumors displayed a somewhat different growth pattern than found in the abdominal wall or intra-abdominal desmoid tumors (816). In our series, among the 9 patients with DWI, 7 lesions were located in the abdominal cavity or abdominal wall. Therefore, we compared the desmoid tumors with malignant tumors arising from the abdominal cavity or abdominal wall and found a significant difference in ADC values. This result may be useful for distinguishing desmoid tumors from malignant tumors that are specifically arising from the intra-abdominal cavity or abdominal wall. In particular, intra-abdominal or abdominal wall desmoid tumors found during the postoperative follow-up examination of abdominal malignancies are difficult to differentiate from the recurrence or seeding metastasis of malignancy. We believe that DWI would be a useful diagnostic tool in these cases.
The imaging findings of desmoid tumors on PET-CT, which is usually performed for the evaluation of malignancy, are not well known. In a previous study (9), the maximum standardized uptake values (SUVmax) of the desmoid tumors ranged from 3.4 to 5.4, which is similar to the values found in our study (mean 3.7, 2.4–4.5). Our study demonstrated that the mean SUVmax of the desmoid tumors was significantly lower than that of the malignant tumors. Thus, the SUVmax value of the PET-CT scans might also be useful for the differentiation of desmoid tumors from malignancy.
Our study has some limitations. First, the number of patients with a desmoid tumor was small and imaging modalities used for tumor assessment were not uniform, but included CT, MRI and PET-CT. This is because desmoid tumors are very rare and the duration of patient collection for our study was long (12 years). Future investigations need to include a larger sample size and a standard imaging modality. Second, we could not correlate the MR image findings of the desmoid tumors with their pathologic findings on a case-by-case basis.
In conclusion, desmoid tumors usually displayed relatively homogeneous enhancement on the CT and MRI scans and a characteristic whirling or band-like pattern on T2-weighted imaging. The desmoid tumors also showed higher ADC values on DWI and intermediate SUVmax values on PET-CT compared with malignant soft tissue tumors. Because the findings of the qualitative assessment on the CT and MRI scans may overlap with those of malignant tumors, the quantitative assessment including DWI can be useful for the diagnosis of desmoid tumors and differentiation them from malignant tumors.
 XML Download