

 PDF
PDF ePub
ePub Citation
 Print
Print


INTRODUCTION
Life expectancy is increasing. Diseases associated with aging, such as osteoporosis or secondary fractures caused by osteoporosis, are becoming more prevalent. Although osteoporotic fractures can be treated conservatively, they can cause back pain and require more time to spontaneously resolve. Also, this pain is often severe enough to prevent patients from engaging in normal activities and achieving unencumbered mobility. So, when treating osteoporotic fractures, the primary goal is to relieve pain so patients can return to their normal daily lives.
Vertebroplasty has been the primary treatment for osteoporotic fractures for many years (1). It can be performed immediately after a fracture without general anesthesia for patients with problematic pain. Furthermore, it can provide pain relief shortly after the procedure and a better stability of vertebral bodies than other treatments (2). Synthetic resin produced from the polymerization of methyl methacrylate (Polymethylmethacrylate, PMMA), which is commercially available as CMW3 bone cement (DePuy international Ltd, Blackpool, England), has been widely used for percutaneous vertebroplasty procedures (3).
Although percutaneous vertebroplasty is a safe procedure with minimal risks for side effects, common complications include pain, hemorrhages, or infections. Rare complications include pulmonary embolisms due to cement embolization in the lungs via the paravertebral venous plexus, nerve injuries, or irritation. Almost all severe complications are caused by a leakage of the PMMA cement from the vertebral body during a procedure. Operators should cautiously perform vertebroplasty procedures using fluoroscopic visualization during the injection of PMMA cement into the vertebral body to prevent severe complications (4).
It has been assumed that the different enhancement patterns of pre-procedure contrast-enhanced magnetic resonance imaging (MRI) reflect differences in the amount of cement injected during vertebroplasty procedures. The objective of this study was to identify the difference between the injected cement volumes during vertebroplasty procedures according to the enhancement patterns shown by pre-procedure MRI. The goal is to help operators predict the injected cement volume and prevent severe complications caused by cement leakage.
MATERIALS AND METHODS
This study was approved by the hospital's Institutional Review Board. A total of 35 patients who underwent vertebroplasty procedures for the treatment of osteoporotic compression fractures and pre-procedure enhanced spine MRI between August 2003 and November 2008 were included. A total of 42 vertebral bodies and 52 procedures from 35 patients (29 female, 6 male) were included. The mean age was 71.7 years, with a range from 64 to 77 years. Among the 42 vertebral bodies, 32 underwent unilateral procedures and 10 underwent bilateral procedures. The procedures were performed for various levels of vertebral bodies, which ranged from T7 to L5: T7 (n = 1), T8 (n = 1), T9 (n = 2), T10 (n = 4), T11 (n = 5), T12 (n = 2), L1 (n = 11), L2 (n = 4), L3 (n = 6), L4 (n = 4), and L5 (n = 2).
MRI and Imaging Analysis
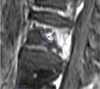
All patients underwent pre-procedure enhanced 1.5T MRI scans (Signa Excite; GE Medical Systems, New York, NY, USA) with a field of view 24 cm, resolution 320 × 235, repetition time 400 msec, echo time 20–30 msec. MR scans with T1- and T2-weighted imaging and T1-weighted fat suppressed contrast-enhanced imaging were examined. All imaging patterns were analyzed by three radiologists (a final-year resident and two attending radiologists). The 52 procedures were divided into two subgroups. Group E(−) was classified as vertebral bodies where the fracture lines and surrounding abnormal intensity lesions appeared as non-enhanced areas on T1-weighted fat suppressed contrast-enhanced MRI. Group E(+) was classified as vertebral bodies where the abnormal signal intensity lesions appeared as an enhanced area on T1-weighted fat suppressed contrast-enhanced MRI. The range of interest (ROI) of the enhanced area in Group E(+) and the non-enhanced area in Group (−) on the sagittal T1-weighted fat suppressed contrast enhanced images were measured for each group using a PACS work station (TechHeim, Seoul, Korea). The volume was calculated as the sum of each value obtained by multiplying the ROI area of the cross-sections by the slice thickness (Fig. 1). This volume calculation was used for comparison with the actual amount of injected bone cement during vertebroplasty procedures.
Procedure Technique
The vertebroplasty procedures were performed by operators in an angioroom using fluoroscopic X-ray guidance equipment (Integris V-3000; Koninklijke Philips Electronics N.V., Amsterdam, The Netherlands) and digital subtraction angiography (DSA). The procedures were performed with patients in the prone position under local anesthesia using 11G or 13G bone marrow biopsy needles (J type bone marrow needle; Manan Medical Products, Gainesville, FL, USA). Unilateral and bilateral transpedicular approaches were used for percutaneous vertebroplasty procedures. PMMA cement was injected when the needles reached the anterior one-third potion of the vertebral body using fluoroscopy guidance. The injections were continued until the cement reached the dorsal quarter of the vertebral body and the operator could feel resistance under continuous, lateral-view fluoroscopic monitoring. All patients were confirmed to have no leakage based on the fluoroscopy performed by the operator at the end of the procedures.
Statistical Analysis
SPSS software version 20.0 (SPSS, Inc., Chicago, IL, USA) was used for the analysis. The ratio of the actual volume of injected cement to the volume of non-enhanced or enhanced areas in the E(+) and E(−) groups shown by MRI were compared. Significant differences (P < 0.001) were found by the statistical analysis between the E(+) and E(−) groups.
RESULTS
Pre-procedure MRI and fluoroscopic imaging used during the procedures were reviewed retrospectively. All vertebral bodies with osteoporotic fractures showed low signal intensity on T1-weighted MRI. Among the 52 cases, 39 vertebral bodies (75%) showed a low signal intensity on the T2-weighted images. Thirteen vertebral bodies (25%) showed increased signal intensity on the T2-weighted images.
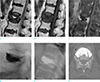
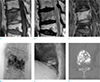
The 52 injections during vertebroplasty procedures included 28 (56%), Group E(+) and 24 (44%) Group E(−) according to the pre-procedure contrast-enhanced MRI. Group E(−) showed a solid pattern in all but three vertebral bodies (Fig. 2). Group E(+) showed trabecular patterns during cement injection in all vertebral bodies except one (Fig. 3).
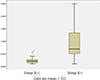
The actual volume ratio of injected cement to the volume of the non-enhanced or enhanced regions calculated based on the contrast-enhanced MRI was 0.22 ± 0.11 cc/cm3 in the E(+) group and 0.93 ± 0.62 cc/cm3 in the E(−) group. In Group E(+), the ratio of actual cement doses to the measured volume on the enhanced MRI was less than 0.3 cc/cm3 (92%) for all injections except one. On the other hand, Group E(−) had more than 0.5 cc/cm3 (86.4%) in 19 of 28 total injections. The average amount of injected cement was significantly different between Group E(+) and Group E(−) (P < 0.01, independent T-test). In addition, the ratio of the actual volume of injected cement to the volume of the non-enhanced area that was calculated based on the sagittal T1-weighted fat suppressed contrast-enhanced image in Group E(−) was significantly higher than the ratio of the volume of the injected cement to the volume of the enhanced area in Group E(+) (P < 0.001) (Fig. 4).
DISCUSSION
Vertebroplasty procedures are important in the treatment of compression fractures. They improve the stability of the vertebrae, prevent additional fractures, and relieve pain. However, at the same time, vertebroplasty is a precise and delicate techniques that requires a skilled operator. In particular, operators must be cautious regarding complications of vertebroplasty. Infections and pain are relatively common and can be resolved. Rare but serious complications include pulmonary embolisms. This complication is largely caused by a failure to control the volume of injected cement and the occurrence of leakage in the process of PMMA injection into a fractured vertebra. To prevent such complications, real-time fluoroscopy is used when performing injection. However, it is difficult to predict the appropriate amount of cement for each patient. The amount may vary for each patient or for each fractured vertebra in the same patient.
Several studies have investigated the relationship between the amount of cement injected and the prognosis of patients despite its unpredictability. Kaufmann et al. concluded that there was no significant association between the volume of cement injected during vertebroplasty procedures and the clinical outcomes of pain and medication used at any time during follow-up (5). In contrast, Molloy et al. concluded that the strength and stiffness of the augmented vertebral body are weakly correlated with the cement volume during vertebroplasty procedures (6). Another study by Ryu et al. (7) investigated complications, and found that larger volumes of cement may also increase the risk for complications related to leakage, such as disk-space injections, an epidural or neural foraminal extension of cement, and pulmonary embolisms.
Currently, the most common available method to prevent the leakage of bone cement is the termination of cement injections when leakage is noted by operators. Although the procedure is often successfully terminated by the operator's precise technique, this method is always accompanied by the risk of poor prognosis for the patient due to an inappropriate amount of volume control, such as leakage. To reduce the risk, many researchers have attempted to identify factors that affect the dosage or pattern of cement. For instance, Tanigawa et al. (8) classified patterns of bone cement distribution based on post-procedure fluoroscopy for cleft patterns, compact and solid cement filling patterns in vertebrae, and trabecular or sponge-like filling patterns. They concluded that the volume of cement injected was greater for compact and solid cement filling patterns than for trabecular or sponge-like filling patterns, and the incidence of new compression fractures was higher for compact and solid cement filling pattern groups. Oka et al. (9) also suggested that a fat-suppressed contrast-enhanced MR is useful for predicting a solid pattern distribution of injected cement prior to vertebroplasty procedures.
Until now, no study has correlated the enhancement patterns in pre-procedure contrast-enhanced MRI with the actual injection patterns or that has compared the virtual volume measurements and actual cement injection amounts. The patients in this study who underwent vertebroplasty procedures were divided into two groups, the E(−) group and E(+) group, according to the enhancement patterns of fractured vertebral bodies shown by pre-procedure contrast-enhanced MRI.
It was hypothesized that the differences between these enhancement patterns would reflect the differences between cement injection patterns and the amount actually injected. The E(−) group showed a solid injection pattern during the actual operations, which is different from the trabecular patterns observed in the E(+) group. In addition, the average amount of cement actually injected was higher in the E(−) group than in the E(+) group. The ratio of the actual volume of cement injected was also compared to the volume measured by the virtual ROI for the pre-procedure contrast-enhanced MRIs of both groups. The ratio of the amount of cement actually injected was higher in the E(−) group than in the E(+) group in comparison with the virtual ROI volume.
This study has some limitations. First, it was limited to a small number of patients. A larger number of patients should be included in future studies for these results to be accepted as reliable. Second, there may be variations in the measured volume for one patient or between individuals because the non-enhanced or enhanced area volumes used in this study were obtained by drawing the ROI directly from the MRI, rather than using the automated program in PACS.
In conclusion, the study suggests that preoperative contrast-enhanced MRI can significantly reflect the pattern and volume differences of cement injections during vertebroplasty procedures.
 XML Download