

 PDF
PDF ePub
ePub Citation
 Print
Print


INTRODUCTION
Magnetic resonance imaging (MRI) is a versatile tool widely used for diagnosing disease. It provides high resolution anatomical information of the human with excellent soft tissue contrast, obtained in a non-invasive manner, and can be used to guide treatments and surgeries through monitoring of temperature and visualization of tumors (12345). More recent applications related to hyperthermic therapy include magnetic resonance-guided laser-induced thermal therapy (3) and MR-guided focused ultrasound surgery (2), which demonstrated the possibility for application of MRI as a valuable tool in managing the ablation region.
Hyperthermic ablation is a widely used therapeutic tool for cardiac arrhythmias and cancers of the liver, lung, kidney, and bone (6789). RF and microwave ablation utilize the thermal sensitivity differences between tumor and normal tissue, which are primarily determined by the electrical properties (i.e., permittivity and conductivity). The actual distribution of heat, however, is complex, but can be described using bio-heat transfer models, such as the Pennes bio-heat equation (10), which takes into the account heat conduction with internal heat generation, as well as bio-heat mechanisms like blood perfusion and metabolism. A means of projecting the thermal distribution can be useful planning purposes.
In the process of converting electromagnetic (EM) RF energy to thermal energy, the dominant source of heat is the electrical current density (Jc) due to ohmic loss. The quantity of energy absorbed into the body, as calculated by the specific absorption rate (SAR), is estimated using the electrical conductivity of the tissue. As the frequency of the RF wave increases, the heating process is also influenced by displacement current (Jd) due to polarization. Therefore, permittivity should also be considered for predicting temperature elevation (11). The effects of both conductivity and permittivity can be observed simultaneously using the dielectric loss tangent, which is a characteristic of materials.
Loss tangent (tan δ) is defined as the ratio of electric
current density to displacement current density.
where σ is the conductivity, ω is the angular frequency, εο is the dielectric constant in a vacuum (εο = 8.854 × 10⁻¹² F/m), and (εr is the relative permittivity. It is also equal to the ratio of the dissipated power to the stored power. This definition opens the possibility of using loss tangent as a parameter to conjecture the conversion efficiency of electromagnetic energy to thermal energy without measuring the actual RF distribution. Predicting temperature elevation and measuring the quantity of energy transformation are important factors in controlling hyperthermic ablation. Monitoring and controlling the ablation volume are still challenging tasks, and exploring the effect of the loss tangent in human tissue during these processes can provide valuable insights. In addition, mapping the loss tangent property of biological tissue in a non-invasive technique, which has yet to be performed, could lead to increased diagnosis and treatment.
Recently, a novel non-invasive technique called MREPT (Magnetic resonance electric properties tomography) was introduced for the measurement of electrical properties (121314). MREPT yields quantitative values for conductivity and permittivity, determined at the MR Larmor frequency. Conductivity and permittivity can be measured from RF field maps (generally termed B1+ maps) using the Helmholtz equations. Therefore, loss tangent imaging can be performed using the MREPT technique.
In the present study, a nondestructive loss tangent imaging method is proposed as an application of the MREPT technique. A complex valued B1+ map, which is necessary for calculation of the electrical properties, was estimated using a double-angle multi-echo actual flip angle imaging (AFI) method, which can measure both the magnitude and phase of B1+ (15). The loss tangent was visualized non-invasively via 3T MRI. In addition, to illustrate the potential of using loss tangent as a tool for thermal sensitivity mapping, numerical RF ablation EM simulations were performed. In particular, the influence of loss tangent when RF ablation was performed at high frequencies (over 900 MHz) was analyzed.
MATERIALS AND METHODS
Simulations - Effect of Loss Tangent
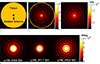
EM simulations, demonstrating the effect of loss tangent as a predictable monitoring parameter, were performed using a simple cylindrical model and a liver model. In the first model, the Bessel boundary matching (BBM) method (16), which can rapidly compute analytic solutions of EM field distributions, was employed. A single tissue phantom was designed as a cylinder model with a diameter of 10 cm and infinite height (Fig. 1a). An ablation antenna was assumed to be positioned at the center. The magnitudes of B1+ and Ez (z-component of the electric field calculated by BBM method) were estimated from simulations, after which SAR was calculated using Ez and the dielectric property information (SAR = σ·Ez2/mass, and Ex = Ey = 0). Temperature elevation around the antenna was determined by measuring the peak value of local SAR (over eight voxels located in the antenna boundary). The temperature variation, with respect to ablation frequency, was observed by varying the conductivity and permittivity at four different frequencies (σ: 0.1~2.9 S/m; εr: 40~80; frequency: 460 kHz, 128 MHz (Larmor frequency), 915 MHz, 2.45 GHz). The method was implemented using Matlab R2012a (Mathworks, Natick, MA, USA).
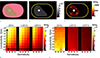
In the second model, a liver-mimicking simulation phantom was designed with three tissues: muscle (σ: 0.2 S/m, εr: 54), liver (σ: 0.4 S/m, εr: 43) (17), and cancer (σ: 0.4~2.0 S/m, εr: 40~70), in order to observe the SAR distribution with respect to loss tangent (Fig. 4a). The simulation frequencies were chosen as 1 GHz, 1.4 GHz and 1.8 GHz. The electric fields were calculated using finite-difference time domain (FDTD) numerical simulations, performed with REMCOM (REMCOM, State College, PA, USA). Temperature variations were also observed.
Tissue Loss Tangent Imaging - MREPT
The electrical properties were estimated by analyzing the complex B1+ map using the Helmholtz equations, [2] and [3] (12):
where µ is the permeability. In reality, conductivity can be calculated to a reasonable accuracy using only the phase of B1+, while permittivity can be determined from the magnitude of B1+ alone (12). Therefore, both the magnitude and phase of B1+ should be acquired. According to the above equations, the calculation of electrical properties is very sensitive to noise of the B1+ map due to the Laplacian operation. Thus, a smoothing operator was applied to the B1+ map for noise reduction. The kernel size and type of filter can be adjusted with image signal-to-noise ratio (SNR) and the geometry of the phantom or tissues. In the phantom study, a Gaussian filter with a kernel size of 3 and standard deviation of 1 was employed. In addition, a weighted second-order fitting algorithm was used for exvivo data to reduce the boundary artifact (18). The tissue loss tangent image was then determined from the estimated conductivity and permittivity maps (Eq. 1). The electrical properties of each tissue were measured in the region of interest (ROI), excluding boundary artifacts.
Sequence - Image Acquisition
A double-angle AFI method was used to acquire the complex B1+ map, including both magnitude and phase (15). The double-angle AFI measures the distribution of flip angles by acquiring data at two different TRs (repetition times, TR1 and TR2). A multi-echo gradient echo sequence was integrated into every TR2 of the AFI. The flip-angle of the RF pulses was set to α at TR1 and 2α at TR2 in order to obtain high SNR suitable for B1+ magnitude and phase mapping. The initial gradient echoes (S1, S2) were acquired at both TRs for calculation of the magnitude of B1+. The magnitude can be reconstructed through the following equation: Echoes acquired at TR2 (S2, S3, ...) were used to estimate the B1+ phase. The multi-echo readout scheme removed the effect of B0 inhomogeneity, allowing the B1+ phase (TE = 0 phase) to be retrieved through linear least squares fitting of the phase values. The approximation that the B1+ phase is half the value of the transceive phase value was used herein (131920).
Experiments
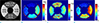
A phantom with different loss tangent values was built and used to demonstrate the performance of the proposed method. The phantom was made as shown in Figure 5a. Four regions were filled with varying concentrations of copper sulphate (CuSO4) as a permittivity modifier and sodium chloride (NaCl) as a conductivity modifier to generate different permittivity and conductivity. To prevent water fluctuation inside the phantom, the aqueous solutions were solidified using agar powder. Axial images of the phantom were acquired on a 3.0T MRI scanner (Siemens Tim Trio) using a transmit-receive head coil. Through application of double angle AFI, fourteen slices were obtained in 3D with resolution = 2.0 × 2.0 × 4.0 mm3, TR1/TR2 = 20/100 ms, first echo time = 3.55 ms, echo spacing = 3.55 ms, FA1/FA2 = 40/80°, FOV = 256 × 256 mm2, number of echoes = 3, and averages = 3, which required a total scan time of 10 minutes 45 seconds.
An ex-vivo porcine shoulder imaging experiment was also performed. The sample was first soaked in water, and then a double-angle AFI pulse sequence was used to obtain the complex B1+ map. Eighteen slices were obtained in 3D with resolution = 2.0 × 2.0 × 4.0 mm3, TR1/TR2 = 30/150 ms, first echo time = 3.55 ms, echo spacing = 3.55 ms, FA1/FA2 = 40/80°, FOV = 204 × 256 mm2, number of echoes = 4, and averages = 3, requiring a total scan time of 16 minutes 33 seconds.
RESULTS
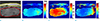
Typical simulation results obtained for the 915 MHz RF ablation are shown in Figure 1. The B1+ map and Ez map patterns were dependent on the conductivity and permittivity. The SAR patterns also changed with the dielectric properties (Fig. 1d). A wave pattern was revealed due to resonance. Resonance occurred when the oscillation frequency matched the natural vibration frequency of the material. At these resonance frequencies, which occurred at half the wavelength, the material absorbed more energy than at other frequencies. Therefore, the pattern became denser according to the increase of ablation frequency and tissue permittivity.
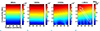
The peak local SAR, with respect to conductivity and permittivity, is displayed in Figure 2. The 4 figures in the figure show the tendency of temperature variation with respect to ablation frequency. The peak local SAR values were directly proportional to the conductivity at lower frequencies (Fig. 2a, b). At higher frequencies, however, they were more proportional to the loss tangent (Fig. 2c, d) indicating that the loss tangent can be a dominant parameter in predicting temperature elevation in the high frequency ranges used in microwave ablation (> ~1 GHz) near the ablation region.
Figure 3 shows the simulation results for the liver model. Figure 3b and c represent the loss tangent and SAR map. The SAR map showed clear correlation with the loss tangent map. The average SAR from the cancer and liver simulations are shown in Figure 3d and e, respectively. The average SAR of the cancer increased according to the loss tangent, while that of the liver did not show a clear pattern in relation to the loss tangent. The SAR was intensively packed in the cancer, which had a bigger loss tangent (note the dimension difference). These results were similar to the simple circular model simulations performed with the BBM method. In addition, the observations demonstrate that not only conductivity, but also permittivity, should be considered to monitor the temperature change during high frequency ablation.
The phantom loss tangent imaging results are shown in Figure 4. As expected, the conductivity and permittivity images (Fig. 4b, c) displayed strong correlations with the ion concentrations. However, differences between the CuSO4 and NaCl concentrations were not clearly observed in Figure 4b and c. The loss tangent image provides a distinct contrast between each specific region. Table 1 gives the estimated electrical properties and the loss tangent values of the phantom. The literature values of conductivity and permittivity, with respect to each concentration of NaCl and aqueous CuSO4 employed, are provided in Table 2 (21222324). The quantitative electrical property values matched well with the concentrations of NaCl and CuSO4. Decrease in ε and increase in σ with respect to the NaCl and CuSO4 concentrations could also be observed.
Figure 5 shows the results of the ex-vivo study. The images were masked to remove background regions. The fat regions showed lower conductivity and permittivity compared to the non-fatty regions. The loss tangent image, however, showed a different contrast with similar intensity values. The estimated values are provided in Table 3. Artifacts (yellow arrow) appeared due to the complex structure of the tissues which is a limitation of MREPT since is assumes that the tissues are homogeneous (18). Insufficient SNR and number of voxels for estimation of the dielectric properties are also sources of artifacts at the fat boundary. The right arrow indicates artifacts that may come from the regional sources, e.g., the B1+ map would be hampered due to the B0 inhomogeneity, since this region is adjacent to the edge of the coil.
DISCUSSION
In this study, an MR-based loss tangent imaging method was introduced. A complex valued B1+ mapping method was used to determine both electrical properties. The loss tangent image can be a tool for predicting the thermal sensitivity of the tissues in the context of hyperthermia. Therefore, loss tangent imaging provides the advantage of having a new contrast by which the thermal sensitivity of human tissues can be represented.
The effect of the loss tangent was investigated through simulations, and a relationship with thermal sensitivity was observed. Especially, in high frequency ranges such as those used in microwave ablation, loss tangent became a major predictor for determining thermal sensitivity. It could therefore be a good complement for predicting the temperature change without explicitly measuring the electric fields. Hence, loss tangent can provide the initial state of the thermal distribution before considering the full energy movement.
Herein, loss tangent was measured non-invasively from the complex B1+ map using the MREPT algorithm. The MREPT process is sensitive to noise due to the Laplacian operator. Recently, various post-processing methods, such as weighted polynomial fitting, median fitting, and bilateral filtering, have been developed to obtain more accurate electrical property maps (1225). Smoothing filters such as the Gaussian filter have also frequently been used to reduce the noise from acquired data. In addition, the weighted polynomial fitting method can improve the quality of the electrical property maps, reducing the boundary artifacts. Insufficient SNR is also a limitation for application to biological tissues.
In this study, we used a double-angle AFI method to obtain the 3D complex B1+ map simultaneously. The double-angle AFI provides an accurate B1+ map due to the broad dynamic range and optimized image SNR. The optimization of the image SNR is performed by adjusting the parameters, including flip angle, ratio of TRs, number of echoes, etc. (15). However, this method is implemented based on a gradient echo, so intrinsic limitations appear in regions of high B0 inhomogeneity, such as air-tissue interfaces. Alternatively, spin echo based B1 mapping can also be used to reduce the B0 inhomogeneity, though this would require multiple scans and long scan times (26).
The dielectric properties of tissues are frequency dependent. Typically, permittivity continuously decreases while conductivity increases with frequency for soft tissues (527). Most electromagnetic dosimetry studies measure a broad frequency range spectrum, from several Hz to GHz. The proposed method, however, measures the loss tangent only at the Larmor frequency. The difference of values between the Larmor frequency and the frequency of RF ablation mentioned here is unknown. This shortage might be overcome using multiple Cole-Cole expression (28), which can be used to interpolate the spectrum of the loss tangent (29).
In actual hyperthermia, the electrical properties of the background tissue also affect RF heating (30). The electrical conductivity of each tissue determines the pathway and density of the current. In this study, although a liver-mimicking phantom composed of three homogeneous tissues was designed to observe the effects of the loss tangent, additional research should be performed for many situations to determine the ablation efficiency and temperature elevation.


 XML Download