

 PDF
PDF ePub
ePub Citation
 Print
Print


INTRODUCTION
Hepatocellular carcinoma (HCC) is the sixth most common tumor worldwide, and often occurs in the background of cirrhotic liver (1). Surgical resection, liver transplantation, and radiofrequency ablation (RFA) are therapeutic options with curative intention, and the choice of treatment modality depends on the stage of tumor, performance status, and liver function of the patient (2). RFA has been recommended for early stage HCC (≤ 3 cm in diameter) in patients with liver cirrhosis and portal hypertension by several guidelines, showing an acceptable 5-year survival rate ranging from 50% to 75% (345). A recent simulation study showed that primary RFA was as effective as surgical resection for very early stage HCC (≤ 2 cm in diameter) in terms of overall survival (6). Given the accumulated evidence of the therapeutic efficacy of RFA in patients with HCC provided by the aforementioned studies, the Barcelona Clinic Liver Cancer staging system has also proposed RFA as the firstline treatment in patients with very early stage HCC who are not candidates for liver transplantation (57).
When RFA is performed for HCC, ideally, the ablation volume created by RFA should be predictable and reproducible according to the device used for RFA (i.e., number and active tip length of electrodes) and other RFA input variables (i.e., radiofrequency [RF] current and ablation time) (89). However, in real practice, as increased hepatic perfusion reduces both RF coagulation and the time to achieve thermal equilibrium, the size and shape of the ablation zone is highly variable (101112). This is referred to as the heat-sink effect, which makes it difficult to accurately predict the ablation volume. This unpredictability can lead to negative outcomes after RFA, such as high local tumor progression (LTP) rate, which can occur when the ablation volume is not sufficient, or liver function deterioration, which can occur when the ablation volume is larger than necessary (1213). Theoretically, because portal venous blood flow is reduced in liver cirrhosis, it could be assumed that patients with more severe liver cirrhosis may have increased ablation volume and improved LTP rate after RFA, and could be more prone to hepatic functional deterioration (1415).
Recent studies have demonstrated that liver stiffness (LS) values measured by ultrasound-based elastography or magnetic resonance elastography (MRE) have excellent diagnostic performance for the staging of hepatic fibrosis and liver cirrhosis, as well as portal hypertension (16171820). In addition, MRE requires approximately 3-5 minutes, and therefore can be easily added to routine liver magnetic resonance imaging (MRI), which is a commonly used diagnostic test for HCC (212223). Therefore, considering that measuring LS with MRE is currently the most accurate noninvasive technique for the detection and staging of hepatic fibrosis and possibly of portal hypertension (23), we hypothesized that MRE may provide some prognostic information regarding the technical and clinical outcomes of RFA, such as the ablation volume created by RFA, tumor recurrence rate, and liver function deterioration after RFA. The purpose of this study was to determine whether the LS value measured by MRE could be predictive of these technical and clinical outcomes in patients receiving RFA for HCC.
MATERIALS AND METHODS
Patient Selection
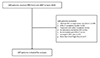
This retrospective study was approved by the Institutional Review Board of our institution, and the requirement for informed consent was waived. From July 2007 to June 2014, 325 patients with HCC who underwent MRE within 6 months before RFA were screened for eligibility for this study. The detailed inclusion criteria for the patients in this study were as follows: (a) a single HCC less than 5 cm in diameter diagnosed by radiologic imaging findings or biopsy; (b) MRE of optimal image quality; (c) not treated with other modalities between MRE and RFA; (d) underwent laboratory tests within 1 month before RFA; (e) underwent computed tomography (CT) immediately after RFA to assess ablation volume; (f) complete RFA procedural data; and (g) classified as Child-Pugh class A. We only included patients with Child-Pugh class A for homogeneity regarding baseline liver function. Patients with Child-Pugh class B were excluded because baseline poor liver function could be a confounding factor in predicting liver function deterioration after RFA. Among the 325 patients screened, 218 patients were not eligible due to the following reasons: (a) multiple HCC or large tumor size (≥ 5 cm in diameter) (n = 96); (b) MRE of suboptimal image quality (n = 18); (c) treated with other modalities such as trans-arterial chemoembolization (TACE), percutaneous ethanol injection, or surgical resection between MRE and RFA (n = 33); (d) no laboratory tests within 1 month before RFA (n = 31); (e) did not undergo CT immediately after RFA (n = 12); (f) incomplete or missing data regarding the RFA procedure such as tube current, tube voltage, ablation time, or number of electrodes (n = 21); and (g) classified as Child-Pugh class B (n = 7). The remaining 107 patients were included and analyzed in the present study (Fig. 1).
Diagnosis of HCC
HCC was diagnosed by liver biopsy or imaging findings of multiphasic liver protocol CT or dynamic MRI. Among the 107 patients included in this study, 105 patients met the noninvasive diagnostic criteria of the American Association for the Study of Liver Disease (AASLD) guidelines (4) or the Liver Imaging-Reporting and Data System (LI-RADS) (24): arterial hyper-enhancement and washout on portal/delayed phase or LR-5 category. For the remaining two patients who showed equivocal imaging finding, HCC was histopathologically confirmed by liver biopsy.
Image Acquisition of MRE
Magnetic resonance (MR) images including elastography were obtained with a 1.5-T whole-body MR unit (Signa HDx; GE Healthcare, Milwaukee, WI, USA) using an 8-channel torso phased-array coil. MRE was performed during the examination of standard liver MRI, which consisted of a respiratory-triggered T2-weighted fast spin-echo (FSE) sequence, a T2-weighted single-shot FSE sequence, a breath-hold T1-weighted dual echo spoiled gradient-recalled echo (GRE) sequence, and a T2*-weighted GRE sequence.
MRE was performed between 3 and 10 minutes after the injection of a standard dose (1 mL/10 kg body weight, 0.025 mmol/kg) of contrast medium (Gadoxetic acid, Primovist, Bayer Healthcare, Berlin, Germany) in the interest of time, as LS values measured by MRE do not differ before and after the administration of contrast medium (25). The MRE study was conducted with the patient in a supine position, and with a cylindrical passive longitudinal pneumatic driver (MR-Touch; GE Healthcare) placed against the right anterior body wall adjacent to the liver. Vibrations of 60 Hz were transmitted into the right lobe of the liver by a passive driver, synchronized with the imaging sequence (26), using a two-dimensional gradient-echo MRE sequence. The elastogram and a 90% confidence threshold mask for each MRE slice was automatically generated by processing the shear-wave images and using an inversion algorithm (2728). Four axial images of the stiffness map were acquired in each patient. The imaging parameters were as follows: repetition time/echo time, 100/26.8 msec; flip angle, 30°; field of view, 32-37 cm; 256×64 matrix; and section thickness, 10 mm, with a 5 mm intersection gap.
Measurement of LS Value on MRE
Before measuring mean shear stiffness, an attending radiologist (with 22 years of clinical experience in abdominal imaging) with experience in MRE evaluated the image quality of the elastograms by referencing the anatomic images. Anatomic images with severe motion artifact, wave images with poor wave propagation, or substantial signal loss in hepatic parenchyma due to increased iron deposition were regarded as inadequate examinations.
The LS values in lesion-free hepatic parenchyma were obtained by placing multiple regions of interest (ROIs) on the MRE images referencing the 90% confidence threshold mask (28). First, ROIs were placed on the anatomic images, taking care to avoid tumors, large vessels, liver edges, and motion artifacts, by one attending radiologist (with 2 years of clinical experience) who was blinded to the patients' clinical and biochemical data (29). Five ROIs were selected in each patient at the right lobe and left medial segment of the liver. Subsequently, these ROIs were copied to the corresponding location on the stiffness maps, providing five LS values in kPa. The minimum and maximum LS values were excluded, and the average of the remaining three LS values was calculated as the representative LS value for each patient.
RFA Procedure and Evaluation of Ablation Volume
RFA Procedure
All patients underwent imaging studies including contrast-enhanced dynamic CT and/or MRI before RFA, and ultrasonography was performed for planning RFA. All of the RFA procedures were performed using local anesthesia and moderate sedation (combination of fentanyl citrate [Hana Pharm, Seoul, Korea], midazolam [Hana Pharm], and ketamine [Huons, Hwaseong, Kyunggi, Korea] by one of the four radiologists who had 7-14 years of clinical experience of RFA. Real-time ultrasonography with a 3.5 MHz probe (IU22; Philips, Cleveland, OH, USA) was chosen as a guidance modality. The RFA system used in this study was a three-channel multi-generator RFA unit (VIVA Multi; STARmed, Goyang, Korea). RF energy was delivered in a switching monopolar mode (30). We used a single internally cooled electrode (Well-point electrode™; STARmed) or separable clustered electrodes (Octopus® electrode; STARmed) with 2-3 cm active tip depending on the location and size of the target tumor. Under ultrasonographic guidance, the electrodes were placed in the target tumors using an intercostal, subcostal, or epigastric approach. The inter-electrode distance was kept to be 2 cm or less to prevent the coagulation zones from being separated (31). When the electrodes were placed in the adequate location, they were activated for at least 8 minutes. The operators were able to adjust the RF current and ablation time during the procedure depending on the extent of the ablation volume, and additional ablations were performed as needed. When the location of electrodes was inappropriate to create a sufficient ablation volume, the electrodes were allowed to be repositioned (30). In cases of peripheral tumors close to critical organs such as the bowel, diaphragm, or abdominal wall, artificial ascites (5% dextrose in water solution) was infused.
Evaluation of Ablation Volume
After RFA, dynamic liver CT was taken immediately on the same day to evaluate ablation volume and procedure-related complications. When the lesion created by RFA included the entire tumor without a residual enhancing portion, it was considered as a complete ablation (32). In all of the 107 patients included in this study, the ablation volume created by RFA was assessed on immediate dynamic liver CT by one radiologist (with 2 years of clinical experience). The following equation was used for volume calculation: a × b × c × π × 1/6, where a, b, and c were the maximal X axis diameter, perpendicularly obtained maximal Y axis diameter, and maximal Z axis height, respectively (33).
Follow-up Evaluation after RFA
One-month follow-up examination included contrast-enhanced dynamic CT or MRI, and laboratory tests to assess the technical effectiveness of the procedure according to the standardized terminology of the Interventional Working Group on Image-Guided Tumor Ablation (32). Complete ablation observed on one-month follow-up images was defined as a treatment success. Visualization of foci showing arterial enhancement and washout on portal/delayed phase, at or along the ablation lesion, was regarded as a residual viable tumor and defined as a treatment failure (32). In patients with treatment failure, other possible treatment options including repeated RFA, TACE, surgical resection, or liver transplantation were considered. In cases of treatment success, dynamic liver CT or MRI, and laboratory tests including serum alpha-fetoprotein (AFP) were followed-up every three months. Occurrence of LTP or intrahepatic distant recurrence (IDR) was monitored during follow-up evaluations after RFA. One radiologist (with 2 years of clinical experience) blinded to the clinical information reviewed the follow-up CT and MRI to detect LTP or IDR. LTP was defined as the development of enhancing solid nodule on the arterial phase in continuity with the previously treated necrotic area (32). IDR was defined as the development of enhancing solid nodule on the arterial phase with wash-out on the portal venous or delayed phase apart from the treated area. Patients who received liver transplantation before LTP or IDR were censored for the analysis (32).
For evaluation of liver function deterioration after RFA, we used the results of a liver function test performed 1 year after RFA. We excluded patients who had initial treatment failure after RFA and received other treatment modalities. Patients who experienced LTP or IDR within 1 year were also excluded in order to evaluate the effect of the first RFA procedure on liver function. We included patients who received antiviral agents, but excluded those in whom albumin was administrated during follow-up (34). Finally, of the 107 patients, 66 patients who had complete ablation without having recurrence in 1 year were analyzed regarding RFA-related liver function deterioration. RFA-related liver function deterioration was defined as an increase of Child-Pugh score (CPS) by one point or more at 1 year after RFA (35).
Statistical Analysis
Data were expressed as medians with interquartile range (IQR) or number (%), as appropriate. Categorical variables were compared using the chi-square test or Fisher's exact test, and continuous variables were analyzed using the Mann-Whitney test. Linear regression analyses were performed to not only examine whether the LS values obtained by MRE had an association with ablation volumes, but also to elucidate other predictive factors of ablation volume. Variables found to be significant in the univariable analyses with P value less than 0.05 were included in the multivariable model. To assess the relationship between LS values and time to LTP or IDR, Cox proportional hazard analyses were performed. P values less than 0.05 were considered statistically significant.
In order to evaluate the value of LS measurement in predicting liver function deterioration after RFA, we used receiver operating characteristic (ROC) curve analysis. We calculated the area under the curve (AUC) to assess discrimination. The y-axis and x-axis of the ROC curve represent the sensitivity and 1-specificity, respectively. All statistical analysis was conducted using SPSS software version 22.0 (IBM SPSS, version 22, SPSS Inc., IBM Company, Armonk, NY, USA) and MedCalc statistical software version 14.8.1 (MedCalc Software bvba, Ostend, Belgium; http://www.medcalc.org; 2014).
RESULTS
Patient Characteristics
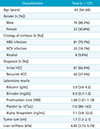
The baseline characteristics of the 107 patients are summarized in Table 1. The median age was 63 years, and there were 74 male and 33 female patients. The 67 patients (62.6%) were firstly diagnosed with HCC and the remaining 40 patients (37.4%) had a previous treatment history for HCC. The median interval between MRE and RFA was 4 (IQR 1-15) days. On MRI evaluation, the median tumor size was 1.7 (IQR 1.3-2.1) cm and the median LS value was 4.85 (IQR 3.73-5.79) kPa.
Evaluation of Treatment Effectiveness of RFA
In this study, there was no procedure related mortality. A total of 114 RFA sessions were performed in 107 patients (one session in 100 patients and two sessions in seven patients). Treatment success with complete ablation was achieved in 105 of 107 patients (98.1%) when assessed by one-month follow-up CT or MR images after RFA. Treatment failure was noted in two patients, and they were treated by subsequent TACE.
Effect of LS Value on Ablation Volume and Rate of Recurrence
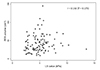
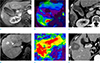
There was no significant correlation between the LS value and the ablation volume by themselves (P = 0.175) (Fig. 2). A comparison of ablation volumes for tumors of similar size but different LS value is shown in Figure 3 as an example. Ablation energy and tumor size were associated with ablation volume in both univariable and multivariable analyses (Table 2). A larger ablation volume was associated with higher ablation energy and larger tumor size. Ablation time and bilirubin level showed a significant association in the univariable analyses, but not in the multivariable analyses. Among the patients included in this study, 24 (22.4%) had LTP and 46 (43.0%) had IDR. In the Cox proportional hazard analyses, neither time to LTP nor time to IDR were associated with the LS value (P = 0.557 and P = 0.775, respectively).
RFA-related Liver Function Deterioration
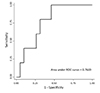
Liver function deterioration was assessed in 66 patients after 1 year of RFA. Two patients who experienced treatment failure, 4 patients who developed LTP within 1 year after RFA, 28 patients who developed IDR within 1 year after RFA, and 7 patients without laboratory results after 1 year of RFA were excluded. Among the 66 patients, 5 patients (7.6%) had RFA-related liver function aggravation; CPS increased by 1 in 2 patients, by 2 in 2 patients and by 3 in 1 patient. Patients who experienced liver function deterioration tended to have a higher median LS value before RFA compared with those who did not (5.63 kPa vs. 4.79 kPa, P = 0.051). The ROC curve for predicting liver function deterioration after RFA using LS value is presented in Figure 4. In ROC curve analysis, the AUC was 0.764 (95% CI 0.598-0.929, P = 0.003). Neither tumor size nor ablation volume had significant association with liver function deterioration.
DISCUSSION
In our study, the LS value measured by MRE was significantly associated with the development of liver function deterioration after RFA, although it did not show any significant association with ablation volume. The AUC of ROC curve in predicting liver function deterioration after RFA was 0.764 (P = 0.003). Considering that presence of cirrhosis or advanced hepatic fibrosis are well-known negative predictive factors of liver regeneration (3637), these results showing the relationship between high LS values and liver function deterioration indicate that high LS values can represent advanced hepatic fibrosis. In addition, several previous studies have demonstrated an excellent diagnostic performance of MRE for the staging of hepatic fibrosis, as well as the detection of portal hypertension (1617181921293839). Based on the results of our study, when RFA is used for treating HCC patients, adding MRE measurements of LS to routine liver MRI could be valuable for planning the RFA procedure because it helps predict liver function deterioration after RFA. With the LS value obtained by MRE, physicians and ablationists may recognize high-risk patients who are more susceptible to liver function deterioration after RFA. In these patients, more caution and effort to optimize ablation volume avoiding overtreatment should be made to prevent liver function deterioration after RFA.
Notable was the finding that there was no significant association between ablation volume and LS value measured by MRE in this study. Complete and adequate destruction by RFA requires that the entire tumor and a sufficient ablative margin should be subjected to cytotoxic temperatures during the procedure (12). It is a well-known fact that the extent of coagulation necrosis induced in a given lesion is equal to the energy deposited, multiplied by local tissue interactions, minus the heat lost before inducing thermal damage (bioheat equation) (40). Therefore, when we designed this study, we hypothesized that the higher LS value of the liver measured by MRE could be predictive of a greater ablation volume after RFA at a given RF energy because hepatic perfusion would be compromised substantially and heat loss would be reduced (41). However, the results of our study contradicted this hypothesis. Based on these results, it can be assumed that the in vivo tissue response of human liver to RF energy may be more complex than a simple linear estimation of heat loss according to tissue perfusion. In real practice, heterogeneity of heating throughout the target volume is more often the rule than the exception (12). That is, the relationship between ablation volume and hepatic blood flow can be nonlinear because several factors such as device dependent parameters (i.e., number of electrodes and length of active tip) and tissue characteristics (i.e., necrosis, fibrotic component, or tissue heterogeneity) may have an influence on electric conductance as well as heat conductance, affecting the amount of heat production (42).
Moreover, LS values measured by MRE were not able to predict tumor recurrence, including LTP and IDR, after RFA in our study. Previously, several studies reported that hepatic fibrosis was not a significant risk factor for recurrence of HCC after surgical resection because the influence of fibrosis was attenuated by other risk factors such as vascular invasion, intratumoral inflammatory infiltrates, or advanced tumor stage (4344). However, there have been other studies reporting the opposite results regarding the influence of hepatic fibrosis on tumor recurrence (4546). As for RFA, the relationship between hepatic fibrosis and tumor recurrence rate is not well studied.
In addition to MRE, ultrasound-based elastography, such as transient elastography or shear-wave elastography, could be another option for measuring LS value (4748). Ultrasound-based elastography can be performed with superior accessibility and in less time, compared to MRE. However, several previous studies have demonstrated that MRE could provide more precise and reproducible LS values than ultrasound-based elastography (4950). In addition, because an MRE can be obtained in only five minutes, it can easily be combined with conventional liver MRI, which is currently widely used in HCC due to its excellent diagnostic performance. Therefore, MRE has an advantage over ultrasound-based elastography in that patients do not have to undergo an additional test beyond one MRI exam.
There are several limitations in our study. First, as our study design was retrospective, there is a possibility of selection bias. Second, MRE was performed with only one MR imaging unit, so compatibility with other MR imaging units was not identified. Third, our study population was relatively small, and this could limit the statistical power. Further studies of larger size is needed to verify the role of MRE in RFA. Last, the most common etiology of liver cirrhosis in our study was hepatitis B virus, the most common cause of liver cirrhosis in Asia and Africa. The pattern of fibrosis might differ according to the etiology of cirrhosis and several studies suggested a lesser fibrotic component in chronic hepatitis B patients than in chronic hepatitis C patients (5152). As the hepatitis C virus and alcoholic liver disease are the most common causes of liver cirrhosis in the Western world, further studies in different populations are needed for the generalization of our study results.
In conclusion, the LS value was significantly associated with the development of liver function deterioration after RFA, although it had no significant influence on the volume of ablation lesion or tumor recurrence. Therefore, more caution is needed to optimize ablation volume for those patients with high LS values to prevent liver function deterioration after RFA.

 XML Download