

 PDF
PDF ePub
ePub Citation
 Print
Print


INTRODUCTION
In the clinical setting, a wide variety of exercises are used for the rehabilitation of injured muscles and as a component of training programs to enhance athletic performance. For sport and rehabilitation medicine, the quantitative evaluation of exercised muscle activity is essential for facilitating optimal exercise selection and designing effective exercise programs.
Magnetic resonance imaging (MRI) allows the simultaneous noninvasive investigation of superficial and deep muscle activity during exercise. In addition, evaluation of isolated muscle activity over an entire area, without the influence of surrounding tissues, can be conducted at arbitrary slice planes. With regard to T2-weighted MRI, the first attempt to identify exercise-induced muscle activity was made by Fleckenstein et al. (1) in 1988. It was found that exercise selectively increased the signal intensity (SI) of active muscles on T2-weighted images. T2-weighted images are formed using the transverse relaxation time (T2), which varies according to water content in a tissue-specific manner, facilitating quantitative and qualitative evaluation. Therefore, T2 has been used to evaluate the muscle recruitment pattern during various exercises in the upper (234) and lower extremities (56789101112). In 2004, Akima et al. (13) used T2 to visualize muscle recruitment during exercise. Since then, such techniques have been grouped under the term “muscle functional magnetic resonance imaging” (mfMRI), which have been widely used to study exercise-induced muscle activity (14151617).
However, T2 is an MRI parameter that is not determined directly and must be calculated by regression analysis using MRI signals of a representative echo time (TE).
Although accurate measurements of muscle T2 or the transverse relaxation rate (R2) of signals can affect many MRI applications, previous studies concerning mfMRI in rehabilitation and sports medicine have used different image acquisition conditions (for example, repetition time, TE, the number of measurement points, and receiving coil selection). In particular, the number of measurement points had a great effect on the precision of T2 calculated by regression analysis. In regression analysis, “goodness-of-fit” represents the accuracy of a calculated result. Goodness-of-fit is commonly assessed using the coefficient of determination, R2, but this approach is only accurate for linear functions because, for non-linear functions, the total sum-of-squares (TSS) is not equal to the regression sum-of-squares (REGSS) plus the residual sum-of-squares (RSS), as is the case in linear regression (18). Hence, even though a deformed linear function is produced in the process of calculating the nonlinear function, R2 cannot be used as a measure of the goodness-of-fit of these nonlinear functions. T2 relaxation in MRI is an exponential function, not a linear function; therefore, we used the probability Q as an alternative measure to evaluate the precision of the calculated T2 (19). Furthermore, the T2 effective signal ratio (T2SR) has been proposed as a means to evaluate the influence of noise in the MRI signal on T2 measurements (20).
The purpose of this study was to investigate the effect of the number of measurement points on T2 measurements with a focus on muscle T2.
MATERIALS AND METHODS
Phantoms and Subjects
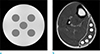
This study assumed that human muscle T2 was comprised of a single component with a mono-exponential form. Two phantoms types were measured, 1 each for the long and short T2. A cylindrical quality-of-image phantom 160 mm in diameter, termed “phantom”, was used for the long T2 (1000 g H2O + 1.25 g NiSO4 + 5 NaCl; T2, 250 ms), and a 90-401 type phantom of entrapped polyvinyl alcohol gel, termed “PVA-gel” was used for the short T2 (T2 range, 80-100 ms). Measurements were made on the right calf muscle in 9 healthy male volunteers (mean age, 20.6 ± 1.4 years; mean height, 174.0 ± 6.5 cm; mean weight, 64.0 ± 6.7 kg). The procedures, purpose, and risks associated with the study were explained and written consent was obtained. The Institutional Review Board of the Japan Institute of Sports Sciences approved the study protocol. For the phantom and PVA-gel, 5 regions of interest (ROIs) were selected (Fig. 1). For the skeletal muscle measurements, 5 ROIs were selected in the medial gastrocnemius. All ROI measurements were expressed as mean ± standard deviation (SD).
MRI and Image Analysis
Transverse MRI scans were acquired using a 1.5-T whole body scanner (MAGNETOM Symphony; Siemens AG, Germany). The receiver coil used for phantom and PVA-gel image acquisition was a head coil, and that used for muscle image acquisition was an extremity knee coil. T2 measurements were conducted using multiple-spin-echo (MSE) with the following parameters: repetition time, 2000 ms; phantom TE, 30-300 ms (19 echoes); muscle TE, 30-150 ms (9 echoes); slice thickness, 10 mm; matrix, 256 × 256; FA, 90; BW, 1392 Hz/Px; field of view, 240 × 240 mm; NEX 1; and acquisition time, 4 minutes and 20 seconds for 1 slice. The images were stored and analyzed on a PC running an IDL platform (Interactive Data Language, Exelis Visual Information Solutions K.K., Boulder, CO, USA).
T2 Calculation and Statistical Analyses
Magnitude images and T2 were calculated using a nonlinear least-square curve fitting as a mono-exponential function. The Y (TE) of T2-weighted images was modeled on an exponential decay with respect to increasing TE as follows:
Where, YTE = 0 is the SI at TE = 0.
MRI noise was evaluated using the T2SR, proposed by a previous study (20) as follows:
Where Sm is the mean SI in a given ROI, and “m” is the mean background noise of the image. T2SR characteristics were used as the index to evaluate the quality of the T2-weighted images used to calculate T2. If the T2SR was < 0.9, the calculated T2 was deemed affected by noise. The number of measurement points was increased step-wise from the shortest TE. The probability Q (19) was used to determine the goodness-of-fit in regression analysis, as follows (21):
where Γ is the incomplete gamma function and ν is the number of degrees of freedom. The number of degrees of freedom is defined as N-M, where N is the number of measurement points, and M the number of varied parameters. The probability Q was generally defined between 0 and 1, and a good fit is indicated by a probability Q close to 1. In this study, a good fit was designated as > 0.9 (19).
T2 accuracy evaluation was used to determine the T2 reproducibility and the goodness-of-fit from the probability Q. Even when we acquired images of the same material under the same conditions, there was usually a 10% variation in measurements within the same subject, despite using the same measurement procedures (22). Therefore, a variation of > 10% was considered as a significant change. In addition, because in Eq. [1] there are 2 unknown quantities (YTE = 0 and T2), the probability Q in the case of 2 measurement points was, in theory, 0.
RESULTS
Figure 2a shows the T2 decay curves of the phantom, PVA-gel, and human muscle. The T2 decay curve gradient was greater in the material with the shorter T2, which in this case was muscle. Figure 2b shows the T2SR accompanying the TE change. In the phantom and PVA-gel, the SD of the MRI signal for each TE was narrow and mono-exponential. MRI signals with a TE < 300 ms were not affected by noise. However, though muscle MRI signals with a TE < 150 ms were not affected by image noise, the SD of the MRI signal in muscle was accompanied by wide changes in the TE. Assuming a mono-exponential form, the muscle T2 decay curve showed large variation. In addition, the T2SR change varied according to T2, in that the decrease in T2SR was greater when T2 was short.
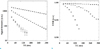
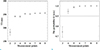
Figure 3a shows the relationship between the phantom T2 changes and the number of measurement points, and Figure 3b shows the probability Q associated with the phantom T2 changes. There were no significant differences in T2 stability for > 3 measurement points. For the goodness-of-fit, if > 4 measurement points were used, the probability Q was > 0.9. There was no significant differences in goodness-of-fit if > 6 measurement points were used.
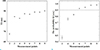
For the PVA-gel, Figure 4a shows the relationship between T2 changes and the number of measurement points, and Figure 4b shows the probability Q associated with the PVA-gel T2 changes. The PVA-gel T2 increased as the number of measurement points increased, and neared 90 ms, which was the value indicated by the gel manufacturer. If > 6 measurement points were used, the probability Q was > 0.9.
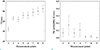
Though the muscle T2 stability did not differ significantly according to the number of measurement points used, Figure 5a shows that the variance in calculated T2 was greater for muscle compared with that in the phantom or PVA-gel. In addition, although Figure 5b shows that the probability Q was high when 4 measurement points were used, the value was lower than that for the phantom and PVA-gel, and it did not improve when the number of measurement points was increased.
DISCUSSION
Because measuring exercised-induced changes in muscle T2 is the most effective way to noninvasively assess muscle activity, the calculated T2 accuracy needs to be high. However, short T2 materials such as muscle are susceptible to MRI noise, which can significantly reduce the accuracy of regression analysis for T2 calculations. Therefore, the relationship between the calculation accuracy of T2 and MRI noise must be considered. With regard to this relationship as assessed using the T2SR, in the present study, the data implied that MRI noise did not affect the quality of T2 calculations, although in short T2 materials, the T2SR decreased as TE increased. In the present study, a T2SR evaluation confirmed that the image quality obtained was suitable for accurate calculation of T2 values.
On the other hand, T2 was shorter in muscle compared with the PVA-gel; therefore, for short TE values, the muscle MRI signal was considered to be decaying. In muscle, though the T2SR data indicated that the MRI signal was not affected by the noise for TE values < 150 ms, the decrease in T2SR became more pronounced as TE increased. In addition, in muscle, the MRI signal variance increased as TE increased. Therefore, to reduce the effect of variance, a shorter TE would be preferable when calculating muscle T2.
In the phantom and PVA-gel, the MRI signal variance was small, and the T2 decay curve was mono-exponential. For the phantom, if > 4 measurement points were used, a long T2 gave good stability and goodness-of-fit, whereas for the PVA-gel, short T2 stability was proportional to the number of measurement points used, with the probability Q being > 0.9 if > 6 measurement points were used. This suggests that the accuracy differed according to the T2 duration even for the same image acquisition conditions. Because the T2SR data demonstrated that image acquisition was not affected by noise, we concluded that the T2 accuracy was mostly dependent on the T2 magnitude, which was related to the decay of the MRI signal.
Compared with the phantom and PVA-gel, in muscle the interval between the measurement points was very short, and the number of the measurement points was lower. Therefore, the goodness-of-fit model was used to evaluate the relationship between T2 calculation error and the number of measurement points. The data implied empirically that there was a large T2 calculation error. However, for materials with mono-exponential T2 decay, the data suggested that the number of measurement points did not affect T2 if > 6 points were used. Previously, NMR has been used to measure T2 in vitro (Higaki T. unpublished data); the findings of the present study using MRI to measure T2 in vivo were consistent with those observed when using NMR.
With regard to calculating muscle T2, because 2 unknown factors were used (Eq. 1), there is a high probability of divergence between 2 measurement points for calculating T2; therefore, the accuracy and stability would likely be very low. Although the T2 measurement reproducibility improved when more than 3 measurement points were used, calculating T2 using 4 measurement points provided the highest accuracy according to the goodness-of-fit model. This is concordant with the findings of previous studies (568913). However, even when the number of measurement points was increased, there was little improvement probability Q. Since the MRI signal noise had no effect on T2 calculations, the hypothesis that muscle T2 was mono-exponential needs to be revised. These results suggested that the improvement of T2 accuracy may be affected by factors other than the number of measurement points.
Many previous studies have assumed that muscle T2 was mono-exponential as a matter of convenience. However, other studies have suggested that muscle T2 was multi-exponential (319232425). Therefore, for further improvement of muscle T2 measurements, it might be best to adopt a multi-exponential model. However, the present study had limitations. A detailed discussion of imperfect RF pulses is beyond the scope of this paper. Therefore, further research would be needed to address these issues.
CONCLUSION
We focused on the effect of the number of the measurement points on the calculation of muscle T2. In addition, we evaluated the stability and the goodness-of-fit for assessing the accuracy of the regression analysis for the calculation of T2. T2 calculations were stable if > 6 measurement points were used. In addition, excellent goodness-of-fit for muscle T2 was obtained if 4 measurement points were used. However, we found that the improvement of the goodness of fit may be associated with factors other than the number of measurement points.
In conclusion, if muscle T2 is assumed to be mono-exponential, 4 measurement points can be used to calculate T2 with good reproducibility and goodness-of-fit.
 XML Download