

 PDF
PDF ePub
ePub Citation
 Print
Print


INTRODUCTION
Meningiomas are common brain tumors that account for approximately 25% of intracranial tumors in adults (1). The majority of meningiomas are considered World Health Organization (WHO) grade I meningiomas; however, atypical (WHO grade II) and anaplastic (WHO grade III) meningiomas account for 5-7% and 1-3% of meningiomas, respectively (2). Despite the small proportion of high-grade meningiomas, preoperatively predicting the histological grade of meningiomas has important clinical significance because high-grade meningiomas have a poorer prognosis, and they frequently require additional treatment, including postoperative adjuvant radiotherapy (3). In this context, the WHO classification, which is based on the statistically significant clinicopathological correlations, should be a good grading method for predicting the various clinical characteristics of meningiomas.
Many imaging modalities have been suggested to predict the preoperative histological grade of meningiomas, including diffusion weighted imaging (DWI), diffusion tensor imaging (DTI) and magnetic resonance spectroscopy (MRS). The images from some of these modalities show distinctions between typical and atypical or anaplastic meningiomas; however, the provided data were inconsistent (45).
Recently, an irregular interface between the tumor and brain parenchyma in conventional MRI was suggested as a predictive factor of the histological grade of meningiomas. In other words, a more irregular interface between the tumor and brain parenchyma is correlated with a higher grade meningioma (678).
The purpose of this study is to define the interface irregularity between the meningioma and adjacent brain parenchyma using conventional MRI as well as to understand its significance in predicting the tumor histological grade, focusing on the correlation with brain parenchymal invasion in postoperative pathological reports.
MATERIALS AND METHODS
Patients
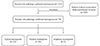
This retrospective study was approved by the Institutional Review Board, which waived the requirement for informed consent. We enrolled a total of 323 patients who underwent surgery and were pathologically confirmed to have meningioma of any histological grade at our institution from January 2010 to November 2014. We excluded 244 patients who lacked description about brain parenchymal invasion in pathologic report. As a result, there were 33 cases of typical meningioma (grade I), 43 cases of atypical meningioma (grade II) and 3 cases of anaplastic meningioma (grade III). All patients underwent preoperative MRI, including contrast-enhanced T1-weighted imaging and preoperative navigation MRI, and we retrospectively reviewed all preoperative MRI scans of the included patients (Table 1, Fig. 1).
MRI Protocols
All conventional MR imaging studies were done on a 3.0 Tesla scanner (MAGNETOM® Verio 3T; Siemens Medical Solutions, Erlangen, Germany) or 1.5 Tesla scanner (Signa HDxt, GE Healthcare, Milwaukee, WI, USA) using 8-channel head coils. The imaging sequences of 3.0 Tesla scanner (MAGNETOM® Verio; Siemens Medical Solutions) included, axial gradient-echo T1-weighted (TR/TE, 250 ms/3.0 ms; NEX, 2; matrix size, 448 × 269; FOV, 210 × 210), turbo spin-echo T2-weighted (TR/TE, 3300 ms/91 ms; NEX, 1; matrix size, 256 × 256; FOV, 250 × 250), fluid-attenuated inversion recovery image (TR/TE/TI, 9000 ms/99 ms/2500 ms; NEX, 1; matrix size, 320 × 224; FOV, 210 × 210) and post-contrast T1-weighted (TR/TE, 250 ms/70 ms; NEX, 2; matrix size, 448 × 269; FOV, 210 × 210) images. Contrast-enhanced MRI was performed in all orthogonal (axial, coronal and sagittal) planes. The imaging sequences of 1.5 Tesla scanner (Signa HDxt, GE Healthcare) were as follows: axial spin-echo T1-weighted (TR/TE, 583.3 ms/13.0 ms; NEX, 1; matrix size, 256 × 256; FOV, 220 × 220), turbo spin-echo T2-weighted (TR/TE, 5150 ms/91128.7 ms; NEX, 2; matrix size, 320 × 256; FOV, 220 × 220), fluid-attenuated inversion recovery image (TR/TE/TI, 8802 ms/127.5 ms/2200 ms; NEX, 1; matrix size, 384 × 192; FOV, 220 × 220) and post-contrast T1-weighted (TR/TE, 583.3 ms/13 ms; NEX, 1; matrix size, 256 × 256; FOV, 220 × 220) images.
The preoperative navigation MR was done on 1.5 Tesla scanner (Signa HDxt, GE Healthcare) with contrast enhanced 3D T1-weighted three dimensional spoiled gradient recalled (TR/TE, 7.6 ms/2.3 ms; NEX, 1; matrix size, 256 × 256; FOV, 250 × 250) images.
Evaluation of the Interface Irregularity
We defined the presence of irregularity of the interface as either spiculations or confluent fuzzy margins. The spiculations and fuzzy margins were only measured on navigation contrast enhanced T1-weighted images in all patients. Two neuroradiologists analyzed all preoperative MRI scans without accessing the patient information, including any pathological results independently and reached a consensus.
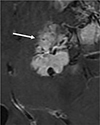
Spiculation
We defined a spiculation as a spike-like prominence (Fig. 2). Spiculations, which were distinct projections in the interface between the mass and the brain parenchyma, should be detected in more than two consecutive image slices and confirmed in all orthogonal planes (axial, coronal and sagittal planes). To minimize the possibility of considering intervening, enhancing vessels as spiculations, any vessel-like, continuous linear enhancements were excluded. Two readers counted the number of spiculations in every image slice that contained a tumor without duplication.
Fuzzy Margin
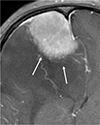
In addition to spiculations, a fuzzy margin, which was an indistinct margin between the mass and brain parenchyma, could indicate interface irregularity (Fig. 3) at the tumor circumference. It can only be detected in the image slice, en face, not tangentially, to minimize partial volume artifacts. The ratio of the fuzzy margin was defined and measured as the circumferential length of the fuzzy margin to the whole circumferential length of the interface of the tumor and brain parenchyma on the image slice for which the fuzzy margin was best visualized.
Statistical Analysis
We classified the patients into two groups: the patients who had brain parenchymal invasion by the tumor as the Present group and who had no parenchymal invasion as the Absent group. To assess the difference in the numbers of spiculations and the ratios of fuzzy margins between the Present and Absent group, we compared the two groups by using the Mann-Whitney U test.
Secondly, with the use of a receiver operating characteristic (ROC) curve, we observed meaningful number of spiculations and ratio of the fuzzy margin. Because not all spiculations or fuzzy margins indicated a true irregular interface, thresholds were needed to categorize whether there was a true irregular interface. After the optimal cutoff values for the spiculations and fuzzy margin were determined, we combined the two parameters into the new parameter of irregular interface. When either one of them was positive, then the patient was considered to be positive for irregular interface. The sensitivity and specificity of number of spiculations, ratio of fuzzy margin and irregular interface for predicting the parenchymal invasion were calculated with ROC curve analysis.
Statistical correlations between the presence of an interface irregularity and brain parenchymal invasion by the tumor as well as meningioma histological grade were tested with chi-square test. We considered anaplastic meningiomas as part of the disease spectrum of non-typical, high-grade meningiomas (henceforward atypical meningiomas).
The Bland-Altman method was used to depict the interobserver agreement in evaluating spiculations and fuzzy margins of tumors on contrast enhanced T1-weighted images, and the intraclass correlation coefficient (ICC) was used to calculate the inter-observer agreement. All analyses were performed using IBM SPSS Statistics software, version 18.0 (IBM Corporation, Armonk, NY, USA).
RESULTS
Interobserver Agreement between Two Readers
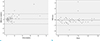
Two radiologists counted the number of spiculations and measured the ratio of the fuzzy margin for all tumors. The agreement between two reviewers was excellent; ICC = 0.892 for fuzzy margins and ICC = 0.928 for spiculations. Additionally, the Bland-Altman plot showed strong agreement of the interobserver (Fig. 4a, b) measurements for spiculations and fuzzy margins on postcontrast T1-weighted images.
Correlation with Brain Parenchymal Invasion on Microscopic Examinations
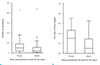
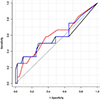
Statistically significant differences were noted between the Present and Absent groups for the number of spiculations and the ratio of fuzzy margin (P = 0.038 and P = 0.028, respectively) (Fig. 5a, b). The optimal cutoff value for the number of spiculations was derived using a ROC curve, with 4.5 or more spiculations with 61.1% sensitivity and 68.9% specificity (AUC = 0.660) as the threshold for a truly irregular interface. The optimal cutoff value for the ratio of fuzzy margin was 0.24 or greater with 66.7% sensitivity and 65.6% specificity (AUC = 0.666). For the combination of two parameters as one parameter of the interface irregularity, the sensitivity and specificity were 72% and 59% (AUC = 0.680), respectively (Table 2, Fig. 6).
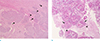
The correlation between the presence of brain parenchymal invasion and brain-tumor interface irregularity was estimated using the chi-square test. The presence of brain-tumor interface irregularity had a significant relationship with brain parenchymal invasion (P = 0.001). In pathological images, we associated the findings of brain parenchymal invasion by a meningioma with the imaging findings of spiculation or a fuzzy brain-tumor interface (Fig. 7a, b).
Correlation with the Histological Grades of Meningiomas
The irregularity of the interface between the meningioma and brain parenchyma was correlated with the meningioma histological grade. In the presence of meaningful spiculations or a fuzzy margin on MRI, the tumor was confirmed as higher grade meningioma, atypical or anaplastic (P < 0.001).
The sensitivity and specificity of the interface irregularity between the tumor and parenchyma for diagnosing high-grade meningiomas were calculated as 82.61% and 82.35%, respectively. In conclusion, the irregularity of the tumor-brain interface suggested both tumor invasion into the brain parenchyma and a higher grade of meningioma.
DISCUSSION
Although the majority of meningiomas are benign, there exist subtypes that show more aggressive characteristics, such as a high recurrence rate after complete resection or, rarely, malignant features. The WHO grading system has standardized diagnostic criteria for atypical meningiomas, including ≥ 4 mitotic cells per 10 high power field (HPF) and/or 3 or more of the following: increased cellularity, small cells, necrosis, prominent nucleoli, and sheeting (9). Further revision in 2007 included brain invasion with an otherwise grade I tumor as an additional criterion for a WHO grade II lesion (10). Preoperatively identifying the histological grade of meningiomas is very important because it influences the treatment plan with respect to whether additional radiotherapy is followed by surgical resection, and it also influences the surgical resection strategy (311).
To date, many reports have introduced advanced imaging techniques, such as diffusion weighted MRI or MRS, that reflect the histological characteristics of meningiomas. Based on increased mitotic activity, DWI has been suggested for diagnosing atypical or malignant meningiomas (1213). Due to the increased cellularity, atypical or malignant meningiomas have increased signal intensity on DWI and very low signal intensity on ADC maps. Conversely, typical meningiomas have variable signals in DWI and relatively high ADC values. However, tumors with cystic or necrotic changes that increase the ADC values did not conform to this rule even when they were atypical or malignant. Furthermore, as atypical meningiomas might contain more cystic and hemorrhagic components than typical meningiomas, diagnosis with DWI in these cases is difficult (14).
Demir et al. (15) have suggested the use of MR spectroscopy to determine the histological grade of meningiomas based on different metabolic patterns of atypical meningiomas. They reported that prominent choline, the absence or low levels of NAA and creatine, and the presence of alanine were common characteristics of the spectral pattern of meningiomas on proton MR spectroscopy. However, their results were limited to differentiating between typical and atypical meningiomas (15).
There are many other trials using different imaging methods, and they have limitations in determining the preoperative histologic grade. However, a few studies have investigated the characteristics of atypical meningiomas using conventional MRI. Nakasu et al. (16) investigated the radiological findings associated with a high recurrence rate of meningiomas using conventional MRI. They focused on the round or lobulated shape of the tumors instead of on the margin of the interface between the tumor and brain parenchyma (16). Kawahara et al. (6) suggested that there was a high frequency of unclear tumor-brain interfaces using T1-weighted images with contrast enhancement in high-grade meningiomas. However, their definition of an unclear interface between the tumor and brain parenchyma was vague, including a simple categorization of the images as positive or negative (6).
In this present article, we more specifically defined the irregular interface as the presence of spiculations and/ or a fuzzy margin. In addition, we set the threshold of the number of spiculations and the ratio of fuzzy margin to minimize the error when categorizing the interface as positive or negative. There might be some artifacts that are confused with irregular interfaces on MR images, such as feeding vessels or partial volume artifacts, making it difficult to accurately define interface irregularities.
On microscopic pathologic examinations, the spiculations corresponded to larger, more distinct parenchymal invasions. On the other hand, a fuzzy margin corresponded to smaller, more indistinct infiltrations into the brain parenchyma that frequently accompanied adhesion between the tumor and brain parenchyma. These correlated well with the radiology-pathology results, indicating that the presence of spiculations and fuzzy margins, which represent interface irregularity between the tumor and parenchyma, were indicative of parenchymal invasion by the tumor mass and high-grade, atypical meningiomas.
While more than 4.5 spiculations (practically 5 spiculations) or more than 0.24 of a fuzzy margin significantly represented actual brain parenchymal invasion, fewer than 5 spiculations, or less than 0.24 of a fuzzy margin ratio, could be detected in typical meningiomas, indicating that not all detected irregular interfaces represented true invasion of the brain parenchyma. The sensitivity and specificity of interface irregularities for predicting the preoperative histologic grade of meningiomas were higher than in other trials that examined the irregular interface between the tumor and brain parenchyma. Kawahara et al. (6) reported that the sensitivity of an unclear tumor-brain interface in 65.4%, which is lower than the 82.61% sensitivity in our study.
There are several limitations to evaluating the irregular interfaces of the tumor. First, this study was conducted retrospectively, and not every patient's pathological specimen obtained from an operative field had adherent brain parenchyma. In these cases, it was impossible to evaluate the relationship between the tumor and neighboring brain parenchyma using microscopic examination. As a result, many tumor masses that were suspected as high-grade meningiomas in preoperative MRI were categorized into tumor masses without parenchymal invasion because of the lack of adherent brain tissue in their pathological specimens.
Twenty-eight patients had pathology confirmed as atypical or anaplastic meningioma without brain parenchymal invasion, although they had a highly suspected irregular interface in their preoperative MRI. This could explain why the relationship between the interface irregularity and histological grade of meningiomas should be estimated additionally. Because there were cases with missing brain parenchyma in the pathological specimen, we estimated the correlation between the interface irregularity and histological grade to reduce this limitation.
Second, due to the different maximal enhancing time of the tumors, heterogeneous peripheral enhancement of the tumor border was confused with fuzzy margins. Another limitation was that, as mentioned above, enhanced blood vessels supplying the tumor could mimic spiculations. In cases with confusion between blood vessels and spiculations, we additionally reviewed contrast enhanced T1-SPACE (sampling perfection with application-optimized contrasts using different flip angle evolutions) images when they were available. Because contrast enhanced T1-SPACE sequences suppressed the enhancing blood vessels, this approach was helpful in cases in which feeding vessels mimicked spiculations. In addition, as these sequences were 3D images, they were able to reduce artifacts, such as partial volume artifacts, that mimicked fuzzy margins.
In conclusion, invasion of the brain parenchyma by a tumor was one of the most important factors in the diagnosis of atypical meningioma. Although many advanced imaging modalities have been suggested as capable of predicting the histological grade of meningiomas, an irregular interface between the tumor and brain parenchyma in preoperative conventional MRI could be a strong predictive factor of atypical meningioma.


 XML Download