This article has been
cited by other articles in ScienceCentral.
Abstract
Purpose
Advances of magnetic resonance imaging (MRI), especially that of the Ultra-High Field (UHF) MRI will be reviewed.
Materials and Methods
Diffusion MRI data was obtained from a healthy adult young male of age 30 using a 7.0T research MRI scanner (Magnetom, Siemens) with 40 mT/m maximum gradient field. The specific imaging parameters used for the data acquisition were a single shot DW echo planar imaging.
Results
Three areas of the imaging experiments are focused on for the study, namely the anatomy, angiography, and tractography.
Conclusion
It is envisioned that, in near future, there will be more 7.0T MRIs for brain research and explosive clinical application research will also be developed, for example in the area of connectomics in neuroscience and clinical neurology and neurosurgery.
Keywords: UHF-7.0T MRI, Development of MRI-history, Super resolution MR tractography, Review of ultra-high field MRI, UHF-diffusion tensor imaging
INTRODUCTION
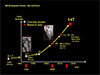
History of MRI goes back to 1970 with low field MRI using resistive magnet such as 0.1T or 1 Kilo Gauss MRI (
123). From the early and mid-1980, superconducting magnet became available and began to obtain clinically usable images. First 2.0T
* MRI became a reality in 1985 (KAIS 1985) and began to provide superior images with time limits that are acceptable to the clinical community and rapidly became the major diagnostic tool (
45). In the mid-1990, sporadically 3.0T MRI became available and starts providing improved images in certain areas. Nearly two decades later, first experimental research proto type of ultra-high field 7.0T MRI became available in the research community and start providing markedly improved anatomical images hitherto unavailable with low field MRI (
67).
History of modern MRI development is given in
Figure 1 where the time and duration of the each modality remained and durations of the development periods are illustrated. As shown in
Figure 2, one of the first 2.0T MRI magnet installed at the Korea Advanced Institute of Science (KAIS) in 1985 is shown together with the students and faculty who are watching the assembling the magnet to be installed at the laboratory (1985). Nearly two decades later in 2005, again one of the first 7.0T magnets for the installation at the Neuroscience Research Institute in Gachon Medical School in Incheon, Korea (2005) is shown in
Figure 3.
This 7.0T MRI at NRI (2005), together with the other three 7.0T MRI installations at MGH Harvard (2005) and Magdeburg University in Germany (2005), and NIH (2005) were the four first groups started to develop the machine for the research and preclinical study. First research trials were mostly anatomical imaging of the human brain (
67). To perform the imaging, first and most difficult task was to develop the suitable RF coils for the brain imaging within the limited time to avoid possible movement related artifacts as well as the dose uniformity to the subject under study (
6). Several types of the RF coils developed during this period and used for the experiments are shown in
Figure 4. Most of the experiments are performed with volunteers of various age categories from as young as 18 years old to 80 years old, both males and females. For the each experiment, we have obtained both Institutional Review Board (IRB) as well as permission from the Korea Food and Drug Administration with consent from the each volunteer. Quite large number of patients has been studied in collaborations with physicians who are in charge of the patients with consents from the patients who volunteered for the study. For the most of the study we have found no particular effects on both normal volunteers as well as patients except some who explained that there was minor dizziness during the study but no particular complains after the exam. It is generally felt that the 7.0T MRI is not health hazardous in any form except minor dizziness felt by patients during the study and agreed in general that there is no particular health hazard effect on human.
MATERIALS AND METHODS
Among the many conventional imaging modality, diffusion MRI requires an additional care, for example data was obtained from a healthy adult young male of age 30 using a 7.0T research MRI scanner (Magnetom, Siemens, Erlangen, Germany) with 40 mT/m maximum gradient field. The specific imaging parameters used for the data acquisition were a single shot DW echo planar imaging with following parameters: TR/TE = 6000/83 ms; matrix = 128 · 128; 1.8mm isotropic resolution; 64 DW-directions, b = 0 and 2000 s/mm
2, 3 repeats; GRAPPA with factor 3 and 45 slices, band width: 1562 Hz/Px, and total acquisition time: 19 min 05 s (6 s · 65 · 3 repeats). For reference, we have also acquired T1-weighted MPRAGE images. Diffusion MRI data were further processed to correct for geometric distortions using the point spread function correction technique. Calculation of fiber orientation distribution was also performed using software package MRtrix (Brain Research Institute, Melbourne, Australia,
http://www.brain.org.au/software/) (
8).
Whole brain fiber tracking or the tractography was carried out with probabilistic streamline using the second order integration over fiber orientation distribution algorithm (
9). From the reconstructed fiber-tracks, super-resolution TDI maps were generated by calculating the number of tracks in each element of a grid. One of the important new developments of the TDI is that the grid element can be made smaller than the original voxel size, often as much as a factor 10 or more depending on the statistical quality of the data (
9). For the current study, we have chosen a 200 µm isotropic grid size, which is nearly 1000 times smaller compared with the original data in voxel size. Directionally encoded color (DEC) TDI maps (the super resolution equivalent of the DEC map in diffusion tensor imaging) were also used for each data set. The IRB of Gachon University of Medicine and Korea Food and Drug Administration approved the procedures of the present study. Participant provided written informed consent.
RESULTS
Three areas of the imaging experiments are focused on for the study, namely the anatomy, angiography, and tractography. First group of anatomical study results are shown in
Figures 5,
6,
7 for the imaging of the
in-vivo human brainstems at two areas.
Figure 5 shows two sagittal view images of the brainstem areas at near the middle portion of the brain where the substantia nigra and hippocampus are located. As shown, at left side (x = -8 mm), we can see clearly the substantia nigra at the upper side of the pons with all the fine fiber tracts which appears to be the corticospinal tracts are clearly visible. In the right, at x = -12 mm, hippocampus as well as amygdala are all clearly visible with clarity never before possible with low field MRI, such as the conventional 1.5T or 3.0T.
Figure 6 shows the expanded view of the midbrain area shown in
Figure 5 with finer details such as the substantia nigra and nucleus accumbens. In
Figure 7, a sagittal slice with expansion of the previous image shown in
Figure 5, again we can see all the fine details of the hippocampus and amygdala together with the main body of the hippocampus and tail extended to the posterior aspect. For the first time, we can see clearly the separation between the head of hippocampus and amygdala complex. In
Figure 8, an over view of the hippocampus with an expanded view image is shown which clearly visualizing the dentate gyrus connected from the head of the hippocampus to the tail with all the fine details. In
Figure 9, an expanded view image of a coronal view of the hippocampus showing the substructures of the hippocampus such as the CA1, CA2, CA3, CA4, and dentate gyrus together with the subiculum and parahippocampal gyrus, the details never before visualized by the conventional low field MRI. In
Figures 10 and
11, these two images demonstrate again one of the most clinically useful information, that is the early possible diagnosis of the Parkinson's disease, the possibility of directly observing the deterioration of the substantia nigra due to the Parkinsonism. In
Figure 10, a sagittal view image and a cut view image in an axial direction (small one) of a healthy male are shown to visualize the substantia nigra, the main cortical gray matter believed to be involved in Parkinsonism. As seen, the substantia nigra is surrounded by the crus cerebri and more medially, the two red nuclei are clearly visible showing how the healthy substantia nigra should look like. In the subsequent figure (
Fig. 11), a set of the same cut axial view images of a healthy control and a Parkinson's disease, respectively are shown. As it is clearly visible, the image of the Parkinson's disease case, the subject's substantia nigra is heavily distorted in the boundary of the substantia nigra and the crus cerebri compared with the smooth arch type shown in the left for the healthy normal subject. This simple and clearly differentiated observation of the Parkinsonism would be a useful tool for the differential diagnosis of the Parkinson's and Parkinson's related movement disorders, such as the supranuclear palsy (SNP) or the multiple system atrophy (MSA). In
Figure 11, a comparison of the regions where the substantia nigra is located for Parkinson's and a healthy normal is shown. As seen two images are clearly different and Parkinson's is easily identified from that of the healthy. Note here, that the Parkinson's patient is a newly detected early Parkinsonism, the H&Y 1.
Last two decades or so, such as the Parkinson's diseases has been treated by surgical means such as the deep brain stimulation (DBS) technique, usually known as DBS. The surgical operation, however, requires an accurate information on the location of the involved nucleus or the grey matter which is sitting deep in the brain, the subthalamic nucleus or STN. Finding the location of the STN is a laborious and yet complicate and often difficult procedure to find the exact location of this small but important nucleus. 7.0T's high resolution capability offer great advantage in finding the nucleus or the target point precisely and rapidly. In
Figure 12, a 7.0T MR image of coronal view is shown together with the anatomical details of the region where STN is located. From this coronal view image (
Fig. 12), once STN target point is identified within the green elliptical circle, it is easy to locate it in an axial view via three dimensional coordinate translation as shown in
Figure 13 where precise 3D locations of the target point in an axial view is shown for the DBS targeting of the STN.
In the areas of angiography, UHF MRI has another advantage in addition to the high resolution anatomical image, that is with increased T1 value with UHF MRI which helps us to make better contrast angiography thanks to the increased contrast between the steady state tissues in the imaging slice which are well saturated due to repeated excitation in contrast to that of the newly arriving fresh unsaturated blood which entered into the imaging slice, therefore, gives off better signals. In
Figure 14, small vessel imaging of the lenticulostriate artery (LSA) region with 1.5T and 7.0T MR, respectively, are shown. As shown, small vessels in the LSA region in the low field MRI (1.5T) is completely lost while the small vessels in the LSA are clearly visible with 7.0T MR angiography, suggesting potentials of the 7.0T angiography in early and difficult small vessels detection for the strokes and other vascular abnormality. In
Figure 15, an example of imaging of the middle cerebral artery (MCA) abnormality with newly generated collaterals. As shown, in 3.0T angiography, MCA occlusion is so severe, that it can be concluded that the MCA is virtually occluded while with 7.0T angiography, we can see all the collaterals which are developed over the time as a result of the MCA occlusion.
Finally, one of the most exciting and promising areas of UHF MRI such as 7.0T is in the areas of the neural fiber tracking using diffusion tensor imaging (DTI) or tractography (
10). Up to now, most of the low field DTI suffered great deal with low resolution which involves many image distortion effects such as the "crossing" and "kissings" of the fiber tracts and bundles thereby severely disturbed formation of accurate tractography (
10). Solution to this problem is the high resolution tractography or small voxel imaging which requires high signal to noise (SNR) ratio to fulfill the statistical requirement. In this respect, again 7.0T's high signal to noise ratio and high signal intensity allow us to improve image resolution so that small voxel imaging is possible, thereby, allows us to avoid the resolution degrading factors such as "crossing" and "kissings" and also allow us to manipulate the image by post image processing. Recently, Calamante et al. (
8) have developed what is known as TDI, or track density imaging, a post signal processing of the data with voxel fractionation and deconvolution. Present tractography work is the result of the collaboration between the University of Melbourne group (
89) who developed track density imaging algorithm, known as TDI and our 7.0T MRI DTI data.
In
Figure 16, a comparison of the conventional DTI image and the new TDI +7.0T DTI image or tractography is shown. As shown, substantial improvement is seen (at right) compared with conventional data (
8). In
Figure 17, one example of the new 7.0T tractography of a coronal view image is shown with assignment of the fiber tracts such as the anterior thalamic radiation (ATR) and other small fiber tracts which would normally be difficult to visualize with conventional low field MR tractography. This remarkably improved resolution finally allow us to examine many new fiber tracts such as the sub-division of the classically known superior longitudinal fasciculus (SLF) hitherto unable to classify. In
Figure 18, two coronal views of tractography are shown to compare the SLF, one at the left with the first original DTI tractography with proposed sub division of the SLF by Makris et al. (
11) while, at the right, a new TDI +7.0T MR tractography is shown with new proposed subdivision scheme of the SLF (
12). New SLF sub-division with corresponding sagittal view images are shown in
Figure 19 to demonstrate the well separated individual sagittal view data by the newly proposed sub-division scheme of the SLF. From this new tractography, for the first time, we are able to clearly identify the individual sub-divisions of the SLF with which functional-connectivity map can be constructed or obtained (
1012).
DISCUSSION
As shown in the result section, last decade was one of the most exciting period during which MRI research and developments made a remarkable progresses, both in the anatomical imaging as well as several other non-anatomical imaging arena such as angiography and tractography by extending the resolution limit down to sub-millimeter region, that is as small as one to two hundreds micron level in-vivo human imaging hitherto impossible to obtain with conventional low field MRI. It is also worth to point out that the UHF MRI appears no particular hazardous effect on human and safety.
More recently new UHF MRI systems without necessity of external shielding appeared and start providing easy installation without unnecessarily large space requirement like the old prototype research 7.0T system which requires as much as 500 tons of iron and large space for shielding and installation. It should also be noted that the last three to four decades of MRI development implies the future development of, such as 14.0T and beyond, is possible as technology develop. In
Figure 20, future prospect of development of the UHF and EHF (Extreme High Field) MRI such as 14.0T is illustrated and the potential scientific progresses that can be gained are suggested. Similarly, in
Figure 21, what has been progressed from the early start of 1970 by the group of University of Nottingham by Andrew et al. with 0.1T MRI in the mid 70's to modern 7.0T developments are noted. This historical development clearly suggests trend of future development of MRI in the field of UHF and EHF areas. In Korea, Cho et al. (
3) at KAIS, Seoul, Korea, started developing 0.1T MRI as early as late 70's and succeeded in obtaining human images and progressed to 2.0T MRI in 1985, one of the first highest field MRI in the world.
Subsequent UHF development was followed after 20 years since the 2.0T MRI and installed one of the first 7.0T MRI in 2005 at Neuroscience Research Institute of Gachon Medical School, Incheon, Korea. Currently over 70 units of 7.0T MRI are installed at various research centers of the world and pursuing research and development not only for the preclinical research but also the basic MRI research. It is envisioned that, in near future, there will be 11.7T MRI for research (NIH etc.) as well as 10.4T (University of Minnesota) and will be added to the current 7.0T research which has nearly 10 years of research and preclinical experiences.
In conclusions, it is envisioned that, in near future, there will be more 7.0T MRIs for brain research and explosive clinical application research will also be developed, for example in the area of connectomics in neuroscience and clinical neurology and neurosurgery. It is also clear that the UHF and EHF MRI research and development will continue and start providing new insights to the research and future clinical applications such as the newly arising "Brain" and other Neuroscience related research much discussed today such as the USA's "Brain Initiative" and European Union's "Human Brain Project" as well as clinical arena such as the DBS development and its clinical applications (
1314).
Figures and Tables
Fig. 1
History of MRI development. MR imaging actually started as early as mid-1970 after the first MRI concept was introduced in 1973. Most of the early MRI magnets were the resistive types and field strength was less than 1-1.5 K Gauss. Only after the 80's superconducting magnets were introduced and field strengths were 1.0-2.0 Tesla (T). Most of the commercial products were, however, centered around 1.5T and 1.5T was more or less the standard super conducting MRI till mid 90's. Since mid-90's 3.0T MRI began to appear, but performance was minimal and users responses were not very enthusiastic. 7.0T magnet became available since the early 2000 and early 7.0T MRI research types began to be in operation at Harvard, NIH, Magdeburg in Germany, and Gachon NRI in Korea. As of today, 2016, nearly 70-80 7.0T units are in operation at various research centers of the world.
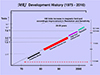
Fig. 2
One of the first 2.0T magnets were installed at Korea Advanced Institute of Science (now KAIST) for research. This is one of the historical event and start producing numerous high resolution anatomical images much superior than the low field resistive MRI of 1.0 K Gauss or 0.1T and opened superconducting MRI era and it remained till beginning of 2000.

Fig. 3
One of the first 7.0T magnets were installed at Neuroscience Research Institute of Gachon University in Korea in 2005. This prototype required an extensive shielding to protect magnetic field radiation to the external surroundings. Nearly 500 tons of iron sheets were used for the shielding at the time. Today, new self-shielded types became available, therefore, no longer such an expensive and elaborate shielding is necessary.

Fig. 4
Various RF (radiofrequency) coils of different types are displayed. In UHF (ultra-high field) MRI such as 7.0T MRI, wave length of the RF is very short (like 20 cm only), therefore, severe non-uniformity arises within the object, like head. One of the major difficulties were, therefore, development of the suitable and efficient RF coil suitable for the each experiment which is particularly difficult at the time due to the increased frequency at 7.0T often destroys the field uniformity as well as RF excitation uniformity. The later could affect the local overdose of RF radiation to the patients or subject under study, therefore, requires utmost care since it could result in danger to the subjects or patients.

Fig. 5
7.0T MRI began to reveal many ultra-high resolution anatomical images such as the fine details of the brainstem structures by T2 weighted imaging. In this figure, two most exciting sagittal view images of the brainstem areas are shown. First, in the left, a sagittal slice at x = -8 mm, we can see clearly the substantia nigra as well as many brainstem structures such as the corticospinal tracts in the pons and other thalamic structures in the diencephalon. In the right, we see the fine structure of the hippocampus and amygdala and the surroundings.
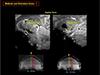
Fig. 6
This image is an expanded view image of the left side of image shown in Figure 5 where substantia nigra is. As seen, one can identify from the upper left by counter clock wise; corpus callosum, the thalamus, anterior commissure, nucleus accumbens, ventral tegmental area, substantia nigra, subthalamic nucleus and fornix. In the pons, we can also clearly see the corticospinal tracts and in the low right, we see the entire cerebellum.
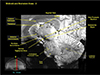
Fig. 7
This is the expanded image of the right side in Figure 5 showing the details of the hippocampus. As seen, we see remarkably clear delineation of the entire hippocampal structure together with the amygdala right adjacent to the head of the hippocampus. Again we can see the thalamus and most part of the basal ganglia.
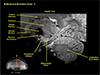
Fig. 8
This is another image of the hippocampus showing the details of the dentate gyrus and surroundings in a sagittal view. In the low side of the hippocampal proper, a parallel and continuous contact of the cingulum along the body of hippocampus is seen.
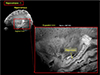
Fig. 9
This image is the most typical hippocampal image seen in a coronal view. As it is shown, we can see clearly most of the sub-components of the hippocampal proper near the head of the hippocampus. Familiar CA1, CA2 etc. can be clearly seen together with the surrounding parahippocampal cortices such as the subiculum, part of the entorhinal cortex, as well as the fusiform area (FFA). This hippocampal image is certainly one of the finest form ever obtained for in-vivo human brain imaging in the field of in-vivo human brain imaging with MRI.
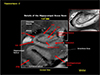
Fig. 10
As we move more to the clinical arena, such as substantia nigra is interesting due to the fact that substantia nigra is heavily involved in Parkinson's disease as well as other movement disorders. In this figure both sagittal and an axial view images are displayed to demonstrate the relative location of the area which contains the substantia nigra. In the axial view image shown in the right of the image clearly visualized the area of substantia nigra with crus cerebri surrounding the substantia nigra in a smooth arch. We will see how this smooth arch is destroyed in the case of Parkinson's disease.
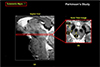
Fig. 11
In this figure, we have displayed two images containing the substantia nigra in an axial view. In the left the substantia nigra area of a healthy normal subject is displayed while in the right, a Parkinson's patient is shown. As seen, the crus cerebri, the surrounding fiber bundles of the substantia nigra, are severely degradated from the original clean arch form due to the damage of the substantia nigra proper. Considering the fact the patient is known to be the early Parkinson's (H&Y1), it is interesting to know how the damage of substantia nigra initiated or influenced the surrounding fiber bundles, the crus cerebri. This study leads to physicians that the Parkinson's disease can now be detected directly which otherwise difficult in the past with low field MRI.
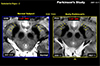
Fig. 12
As we know that there is an alternative to the drug administration in treatment of Parkinson's and other movement disorders, the deep brain stimulation (DBS), known for years and now widely practiced and considered as an important new option, especially for the cases of drug resistant patients. The target for the DBS treatment or the electrode insertion point is the gray matter located bellow the thalamus deep inside the brain. Targeting and location of this gray matter, known as the subthalamic nucleus (STN), is not easy with conventional low field MRI and used only for the relative estimate of the STN and often need an additional tool to identify or confirmation of the position of the STN, for instance using such as MER (Micro Electrode Recording). As shown, this target, the STN can be directly localized or visualized by 7.0T MRI as shown in the image. STN is located right above the substantia nigra (SN) and is clearly visible. This allows physician to perform "Direct Targeting" and appears to be the most promising new technique that can be achieved by using 7.0T MRI.
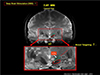
Fig. 13
This axial view image with STN location identified from the first STN location of the coronal section of STN clearly indicates the target point for DBS electrode location in axial view. Obviously this can be extended to sagittal view as well such that 3 dimensionally well identified target point can be selected with sub-millimeter precision. It should be noted that the precise targeting and location of the stimulating electrode is the key requirement for scientifically reproducible experiments, especially in this early stage of DBS research which requires understanding of the mechanisms involved and exploration of the neural function behind the DBS mechanisms.
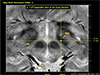
Fig. 14
Angiography with UHF MRI is another well-known technique which has an obvious advantage, that is the increase of T1 value as field increases. In the time of flight angiography, imaging slice is repeatedly activated, therefore, saturated while the new blood flow to the slice, the inflow blood, is not saturated, therefore, the blood to tissue contrast is increased substantially. This advantage is one of the most important and advantageous point of the UHF MRI in angiography. In this figure, a comparison of the UHF MR angiography is shown together with the low conventional low field MR angiography with 1.5T. As shown, the small vessel angiography with low field MRI completely lost all the small vessels in the region where the lenticulostriate arteries should be while we can see all the small vessels in the 7.0T MR angiography. Note here that these angiography are performed without contrast agent. This technique, therefore, appears to be a useful technique in early diagnosis of the strokes of various types.
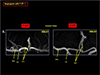
Fig. 15
Another example which demonstrating the advantages of the UHF MRI in angiography is shown. In the left, a conventional time of flight angiography with 3.0T MRI is shown for a patient with middle cerebral artery (MCA) occlusion. As seen, MCA is completely occluded and appears as a severe MCA occlusion. In the right, same patient with 7.0T MR angiography where many small collaterals are visible explaining why this patient is still survived and functions normally. It should be noted that with 3.0T MR angiography alone, diagnosis of this patient would be, at best, confusion or requires another study with contrast agents either by X-ray or MR angiography.
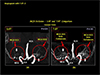
Fig. 16
One of the most exciting new development with UHF MRI is the tractography. Due to the increased signal to noise ratio and high statics, it is now possible to make resolution better, that is the voxel size can be made small, in turn, this provide us means to eliminate much disturbed fiber tract "crossing" and "kissings" thereby one can improve the resolution. In this figure an example of the improvement in resolution of the new tractography with 7.0T is demonstrated. In the upper part, a conventional tractography with diffusion tensor imaging of an axial view image is displayed. When a portion of the corpus callosum of the posterior part is displayed in the low left side, with smoothing with interpolation, it appears as shown in the left side. With 7.0T MRI and new tract density imaging technique, one can improve the image quality substantially as shown in the low right side of the image. This new tractography allows us many new developments including new "Connectomics" much discussed now days.
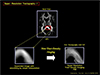
Fig. 17
In this figure, one of the examples of the new tractography obtained from the 7.0T MRI with TDI image processing is displayed. With this high resolution tractography, it is now possible to assign most of the fine and small tracts even such as the anterior thalamic radiation (ATR) as shown in the tract assignment at the left side of figure.
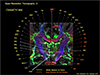
Fig. 18
A comparison with the previously attempted classification of the various fiber tracts with new 7.0T MR tractography is shown. For example, one of the important tracts was the superior longitudinal fasciculus (SLF). Although this tract is important and required further scrutiny, it has been delayed until now due to the resolution limits of the existing MR tractography, mainly by the low field MRI. In the left side, one of the most pioneering attempt to further classify the SLF into sub-division with low field MRI which has been attempted by Makris et al. is shown. In this image (coronal view), four divided SLF subdivisions are indicated, such as SLF I, II, III, and AF (Arcuate Fasciculus). Although it is largely correct, quantitative analysis was difficult. In the right, the new 7.0T MR tractography is shown for comparison. We will describe in the following a few examples of SLF sub-divisions with the new 7.0T MR tractography.
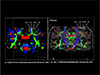
Fig. 19
Further analysis of the SLF by the new 7.0T MR tractography is shown in this figure. As seen, when the SLF points shown in the coronal view are displayed in sagittal view images, that is it is now possible to show each corresponding sagittal slice as shown in the circular form surrounding the coronal view image at the middle-left. As seen, it is now possible to analyze quantitatively how each tract is distributed and branched out and directed to different cortical and subcortical areas. For example, the slice at lateral most side at x = -4.0 cm, large number of red spots are visible which originated from the slices more medially located and eventually directed toward the cortical surfaces, for example many well-known Brodmann's areas such as the prefrontal cortex or Broca's area while many medially located slices such as the slice at x = -3.0 cm has mostly connected to the prefrontal areas, like Brodmann's areas BA9, 10, and 11. These high resolution neurotractography are and will be the most powerful tools of the future neuroscience research and brain research projects such as the "Connectomics" much discussed today in the field of neuroscience.
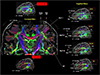
Fig. 20
As we have learned, progresses of MRI in the last three decades were remarkable and future will be similar if not identical. As we enter 21st century, we have had one of the most remarkable progresses with UHF MRI such as the 7.0T MRI with which one can see-through the human brain in-vivo with such a details it is now possible to locate many fine cortical structures hitherto remained as a mystery, such as the substructures of the hippocampus as well as the SLF sub-divisions. In the right most columns, several future progresses expected with further developments of the MRI, especially in the field of UHF and EHF (Extreme High Field) MRI such as 14T. Further improvement in MRI with field strength beyond 7.0T is coming slowly but soon a number of world centers will be equipped with UHF MRI beyond the 7.0T. Application areas will also rapidly expand beyond the simple anatomy to angiography but to the field such as the ultra-high resolution tractography which has much prospect in many modern diseases and disorders such as psychiatric and non-movement disorders, not to mention the future "Connectomics".
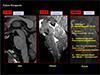
Fig. 21
Lastly, historical development is shown with a drawing starting from the early development of the low field resistive 0.1T magnet MRI to the 7.0T MRI and beyond such as the 11.7T and 14T. Author is convinced that there will be 14T MRI in near future demonstrating the many unknown MRI power hitherto unseen and even imagined. Science progresses without limits and once Einstein said that "Great thought begin with seeing something differently", that is with increasing resolution and contrast, we not only see more but also different aspect of the same subject which otherwise not possible.
Acknowledgments
Author would like to thank many colleagues and students who made major contributions to the work which I am publishing in this review paper, from the early KAIS(T) to NRI periods, starting from 1979 to 2015 as well as many who have supported directly and indirectly during the period. Among many, Drs. Hong-Suk Kim, Jong-Beom Ra, Chang-Hyun Oh, Hyun-Wook Park, Min-Hyung Cho, Soo-Yeoul Lee, Yong-Man Ro, among others. Especially in the last decade at NRI where much of the UHF work has been carried out, among them Drs. Young-Bo Kim, Young-Don Son, Chang-Ki Kang, Kyung-Nam Kim, Jae-Yong Lee, Se- Hong Oh, and Seung-Yeon Park, among many. I would also like to thank Drs. S. H. Paek and B. S. Jeon at Seoul National University Medical School who contributed many aspects of Parkinson's disease study as well as Deep Brain Stimulation research. Thanks are also to Dr. J. W. Chang and his colleagues at Yonsei University for the many discussions and collaborations. I would also personally like to thank to Dr. Gil-Ya Lee and Chul-Ok Lee at Gil Foundation who supported NRI program for last 10 years.
References
1. Hinshaw WS, Bottomley PA, Holland GN. Radiographic thin-section image of the human wrist by nuclear magnetic resonance. Nature. 1977; 270:722–723.
2. Holland GN, Moore WS, Hawkes RC. Nuclear magnetic resonance tomography of the brain. J Comput Assist Tomogr. 1980; 4:1–3.
3. Cho ZH, Kim HS, Song HB, Cumming J. Fourier transform nuclear magnetic resonance tomographic imaging. Proc IEEE Inst Electr Electron Eng. 1982; 79:1152–1173.
4. Cho ZH, Oh CH, Mun CW, Kim YS. Some results of high-flow-velocity NMR imaging using selection gradient. Magn Reson Med. 1986; 3:857–862.
5. Park HW, Cho ZH. High-resolution human in vivo spectroscopic imaging using echo-time encoding technique. Magn Reson Med. 1986; 3:448–453.
6. Cho ZH, Son YD, Kim HK, et al. A hybrid PET-MRI: an integrated molecular-genetic imaging system with HRRT-PET and 7.0-T MRI. Int J Imaging Syst Technol. 2007; 17:252–265.
7. Duyn JH, van Gelderen P, Li TQ, de Zwart JA, Koretsky AP, Fukunaga M. High-field MRI of brain cortical substructure based on signal phase. Proc Natl Acad Sci U S A. 2007; 104:11796–11801.
8. Calamante F, Tournier JD, Smith RE, Connelly A. A generalized framework for super-resolution track-weighted imaging. Neuroimage. 2012; 59:2494–2503.
9. Calamante F, Oh SH, Tournier JD, et al. Super-resolution track-density imaging of thalamic substructures: comparison with high-resolution anatomical magnetic resonance imaging at 7.0T. Hum Brain Mapp. 2013; 34:2538–2548.
10. Cho ZH, Law M, Chi JG, et al. An anatomic review of thalamolimbic fiber tractography: ultra-high resolution direct visualization of thalamolimbic fibers anterior thalamic radiation, superolateral and inferomedial medial forebrain bundles, and newly identified septum pellucidum tract. World Neurosurg. 2015; 83:54–61.
11. Makris N, Kennedy DN, McInerney S, et al. Segmentation of subcomponents within the superior longitudinal fascicle in humans: a quantitative, in vivo, DT-MRI study. Cereb Cortex. 2005; 15:854–869.
12. Cho ZH, Chi JG,. Calamante F. 7.0T MRI brain white matter atlas. 2nd ed. New York, Heidelberg, London: Springer Verlag;2015.
13. Lee KH, Blaha CD, Garris PA, et al. Evolution of deep brain stimulation: human electrometer and smart devices supporting the next generation of therapy. Neuromodulation. 2009; 12:85–103.
14. Cho ZH, Min HK, Oh SH, et al. Direct visualization of deep brain stimulation targets in Parkinson disease with the use of 7-tesla magnetic resonance imaging. J Neurosurg. 2010; 113:639–647.


 PDF
PDF ePub
ePub Citation
 Print
Print


 XML Download