

 PDF
PDF ePub
ePub Citation
 Print
Print


INTRODUCTION
Magnetic resonance imaging (MRI) enables non-invasive examinations of the human body, and it has been established as an important component in research on brain function as well as the diagnosis and explanation of the pathogenesis of various brain diseases (1). Cutting-edge techniques including diffusion, perfusion, magnetic resonance spectroscopy, and volumetric analysis that utilize various post-processing tools are being actively applied to the early diagnosis and research of degenerative brain diseases that are difficult to diagnose by methods based on naked eye examination (2).
The hippocampus is an important part of the brain involved in learning, memory, perception, and regulation of emotional behavior and certain movements (34). A reduction in hippocampal volume is related to various neuropsychiatric diseases, such as depression, schizophrenia, epilepsy, Alzheimer's disease, and sleep disorders. Hippocampal volume needs to be accurately determined, since volume is important in early diagnoses and assessment of treatments (56789101112).
T1-weighted images created using the magnetization-prepared rapid acquisition gradient echo (MPRAGE) technique are typically used to obtain volumetric images of the brain. MPRAGE enables high-resolution volume imaging, although more time is required to obtain an image (13141516).
An important determinant of tissue contrast in T1-weighted images created using the MPRAGE technique is inversion time (TI). TI determines repetition time (TR) and the tissue separation process is performed according to the characteristics of the MRI post-processing software used in volumetric analysis. The changes in volume as a function of changes in TI have been described (17).
In terms of volumetric analysis of the hippocampus, manual tracing (also termed manual segmentation) is the accepted optimal standard. However, the amount of information that can be acquired by MRI and the advantages of MRI in terms of time, cost, and effort has led to an increased reliance on automated software (18).
Leading automated software programs include FreeSurfer (1920), FMRIB software library (FSL) (21), and statistical parametric mapping (SPM). All produce statistical outputs based on various operational environments, constant thresholds, and anatomical brain maps, among others. Volume images are determined by image recording conditions and the characteristics of MRI post-processing software.
This study sought to determine whether the hippocampal volume obtained using three-dimensional (3D) MPRAGE with 1.5-Tesla MRI varies as a function of TI and post-processing, and to obtain data to serve as the basis for determining the optimal TI compared to manual tracing. The evaluated systems were FreeSurfer, a fully automated software program, and the semi-automated individual brain atlases using statistical parametric mapping software (IBASPM) (22).
MATERIALS AND METHODS
Image Acquisition
This study was conducted with 12 normal adult men and women (six men and six women; mean age, 23.72 years). Images were obtained with an Avanto 1.5-Tesla MRI scanner (Siemens, Erlangen, Germany). To obtain images with high T1 contrast in a short time, oblique coronal images were obtained using the 3D MPRAGE technique perpendicular to an imaginary line connecting the anterior commissure and posterior commissure. Image acquisition conditions were TR = 1700 ms, TE (echo time) = 3.44 ms, Flip angle = 8°, field of view (FOV) = 220 × 220 mm2, matrix size = 256 × 256, slice thickness = 1.3 mm, and TI = 800, 900, 1000, and 1100 ms.
Manual Tracing
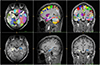
Manual tracing was performed with the assistance of a brain imaging specialist as previously reported (232425) and included the hippocampus, dentate gyrus, subiculum, fimbria hippocampi, alveus hippocampi, and cornu ammonis (CA). Areas of the hippocampus were designated in order from the back to front slice (Fig. 1) using ITK-SNAP ver. 3.2.0 (26) and were indicated with voxel number and volume. To decrease errors in manual tracing and determine the reliability of the measurer, two measurements were obtained within a one-month interval, and intra-class correlation coefficients (ICC) for the volumes of the left and right hippocampus were obtained. Results indicated high reliability, with an ICC of 0.899 (P = 0.001) for the left hippocampus and 0.875 (P = 0.001) for the right hippocampus.
Automated Segmentation with FreeSurfer
FreeSurfer ver. 5.1.0 was used to analyze hippocampal volume. Coronal images and reconstructed axial images were acquired and converted to mgz format, a FreeSurfer analysis format. Image conversion consisted of five steps. The first was an affine registration step in which 12 parameters were used to reduce noise caused by movement. The second was the initial volumetric labeling step. The third was modification of changes in signal intensity induced by b1 bias. The fourth was high-dimensional nonlinear volumetric alignment. In the last step, the volume was segmented based on brain templates and anatomical atlases. The steps involved various imaging processes including normalization of signal intensity, skull stripping to separate areas of the skull in the normalized space, and segmentation into white matter (WM), gray matter (GM), and cerebral spinal fluid (CSF). The imaging processes were performed based on the automatically estimated probability data derived from the manually labeled training set (27).
Automated Segmentation with IBASPM
Volumetric analysis of the hippocampus was performed using five steps and the IBASPM toolbox in SPM2, and a specific atlas or threshold can be designated for the analysis. In the first step, images were segmented into WM, GM, and CSF. In the second step spatial normalization of images into stereotaxic space was done using the spm_normalise function included in SPM. In the third step, images were classified based on the automated anatomical labeling (AAL) atlas (28) that allows the selection of each GM voxel. In this study, the atlas with 116 pre-defined segmentations was used. In the fourth step, atlases were generated for each brain tissue in each image based on classification in the previous stage. In the final step, volumes of generated atlases were statistically calculated.
Statistical Analyses
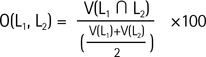
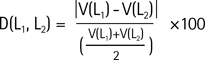
Labels segmented from respective datasets were compared in native space, and in terms of comparison methods, percent volume overlap Eq. [1], and percent volume difference Eq. [2] (proposed by Gonzalo et al. (1), Morey et al. (18), and Bruce et al. (27)) were evaluated using ITK-snap. In a statistical method that uses two different labels (L1, L2), the maximum value of O (L1, L2) is 100. This indicates a complete overlap of two labels in space, while a decrease in the value indicates a decrease in the area of overlap in space. On the other hand, the maximum value of D (L1, L2) is 0, and an increase in D indicates a decrease in the performance of the volumetric analysis detectable by labels. In addition, to measure the performance of the automated software, a Pearson correlation analysis was performed in addition to the determination of hippocampal volumes based on manual tracing, and this was illustrated with a scatterplot and a Bland-Altman plot.
RESULTS
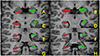
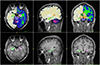
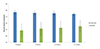
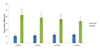
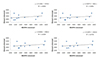
The performance of the FreeSurfer and IBASPM automated software and TI values were compared with those of manual tracing. Forty-eight datasets were obtained by TI from 12 subjects. Data from one subject were excluded due to segmentation errors in the MRI post-processing of FreeSurfer (Figs. 2,3). The percent volume overlap results based on FreeSurfer and manual tracing showed a maximum value (77.1 ± 2.9%) at TI = 800 ms, which decreased as TI increased, with a minimum value (74.5 ± 2.1%) at TI = 1100 ms. Comparison of IBASPM and manual tracing showed the minimum value (48.7 ± 10.3%) at TI = 800 ms, which increased as TI increased, with a maximum value (55.3 ± 9.1%) at TI = 1100 ms. Overall, FreeSurfer showed higher percent volume overlap values than IBASPM (Fig. 4). In comparisons of percent volume difference, FreeSurfer showed the minimum value (11 ± 3.3%) at TI = 800 ms and the maximum value (13.1 ± 2.1%) at TI = 1100 ms, with IBASPM displaying the maximum value (43 ± 10.7%) at TI = 800 ms and the minimum value (33.6 ± 7.3%) at TI = 1100 ms. IBASPM showed higher percent volume difference values than FreeSurfer (Fig. 5).
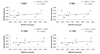
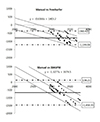
Correlation analysis showed that FreeSurfer and manual tracing produced higher values than IBASPM and manual tracing (Figs. 6, 7). The Bland-Altman plot demonstrated that the hippocampal volumes obtained by FreeSurfer and IBASPM were larger than that obtained by manual tracing (2934.82 ± 215.331 mm3) (Fig. 8). Table 1 summarizes the key results.
DISCUSSION
FreeSurfer outperformed IBASPM in terms of percent volume overlap and percent volume difference with manual tracing. FreeSurfer showed a stronger correlation than IBASPM, but not at a statistically significant level. In addition, hippocampal volume was larger in FreeSurfer and IBASPM than in manual tracing. The mean volumes of FreeSurfer and IBASPM increased as TI increased. This is believed to be due to the ambiguous boundary of the hippocampus caused by the relatively higher increase in signal intensity of WM resulting from the difference in the vertical axis relaxation time of WM and GM (17). The percent volume overlap showed a different pattern, in which FreeSurfer showed the highest value at TI = 800 ms and IBASPM showed the highest value at TI = 1100 ms. This difference was likely due to differences in the processing of the two software programs. IBASPM performs pre-processing using segmentation and normalization of SPM2, and it uses a different brain template, which may have caused the difference (26). The difference was most frequently observed in the normalization process. This suggests that in the measurement of hippocampal volume using automated software, the choice of TI and automated software can also be important factors.
Many researchers consider FreeSurfer the best alternative to manual tracing (5). Although manual tracing is perceived as the gold standard, it has disadvantages that include lack of consistency caused by researcher subjectivity and the difficulty involved in applying it to various subjects using the same standard. On the other hand, the demand for FreeSurfer is increasing, because it provides highly reproducible and reliable data on brain tissue volume and various other types of information.
Because information on changes in hippocampal volume can be useful in the diagnosis of various brain diseases, a method for obtaining higher contrast through changes in imaging acquisition factors and the development of software for accurate measurement is required. Current evaluations can be misinterpreted when interpretations only consider brain tissue volume and not the location in space. Use of percent volume overlap allows the accurate determination of the optimal imaging acquisition method and software performance by comparisons between MRI equipment environment, imaging acquisition method, and manual tracing that incorporates the researcher's subjective opinions and thoughts.
A limitation of the study is that the study subjects were normal adults, which makes it difficult to generalize the results to patients with brain disease. But, the study is notable as it provides reliable data for selecting automated software that fits researchers' needs.
In conclusion, FreeSurfer outperformed IBASPM in volumetric analysis of the hippocampus in comparison with manual tracing. The software yielded different patterns as a function of TI. Use of percent volume overlap can help researchers select a MRI post-processing method that fits their needs.

 XML Download