

 PDF
PDF ePub
ePub Citation
 Print
Print


INTRODUCTION
Gliomas are the most prevalent primary neoplasm of the brain, and vary histopathologically from low grade to high grade (1). Malignant gliomas are categorized in the World Health Organization (WHO) system into four grades according to the presence of the following characteristics: atypia, mitoses, endothelial proliferation and necrosis (2). Secondary glioblastomas (GBMs) develop from WHO grade II or III gliomas, have a longer period of gliomagenesis, and arise from an early event such as an isocitrate dehydrogenase (IDH) gene mutation; however, primary GBMs occur de novo in older patients (3).
According to a recent genomic analysis of high-grade gliomas (HGGs), IDH gene mutations as a genetic marker of secondary GBMs matched the respective clinical diagnoses in 95% of cases (4). The IDH gene mutation has a direct relation with the role of abnormal metabolism in the pathogenesis and progression of these primary brain tumors (5). In fact, GBM patients with this mutation have a highly favorable prognosis, and IDH gene mutation testing is important for clinical patient management and stratification in clinical trials (4678).
Conventional MRI was used to analyze genetic alterations in GBMs in previous studies. Tumor texture analysis by T2 weighted image (WI) and contrast-enhanced (CE) T1WI can be used to predict the methylguanine methyltransferase (MGMT) promoter methylation status of GBM (9). The border characteristics and the homogeneity of the signal intensity of T2WI and T1WI can be used to assess the loss of 1p/19q (10). Additionally, the p53 mutation status and epidermal growth factor receptor (EGFR) status can be assessed by conventional MRI (1112).
To our knowledge, no previous study has used volumetric analysis based on T2WI and CE T1WI features to differentiate GBMs with and without IDH gene mutation. Thus, the purpose of this study was to identify the T2WI and CE T1WI features correlated with IDH gene mutation in GBMs.
MATERIALS AND METHODS
Our Institutional Review Board approved this study, and the requirement for informed consent was waived.
Patient Selection
One hundred and twenty-three patients who underwent surgical resection or stereotactic biopsy at our institution between March 2008 and April 2014 were selected from our radiology report database. The inclusion criteria were as follows: (a) a histopathological diagnosis of GBM based on the WHO criteria (b) had undergone surgery or stereotactic biopsy and (c) had baseline MR imaging performed with T2WI and CE T1WI prior to the surgery or biopsy. We excluded 14 patients due to (a) poor-quality MR images and (b) to baseline MR imaging after the surgery. As a result, a total of 109 patients with GBM (69 males and 40 females; age range: 23-83 years; mean age: 56 years) were enrolled.
Image Acquisition
For each patient, MR imaging was performed using a 3T scanner equipped with a 32-channel head coil (Verio; Siemens Healthcare Sector, Erlangen, Germany). The MR imaging included T1WI before and after contrast enhancement of the multi-planar reconstructed transverse and coronal imaging with a sagittal three-dimensional magnetization prepared rapid acquisition gradient echo (3D-MPRAGE) sequence, transverse fluid-attenuated inversion-recovery (FLAIR), and transverse T2WI with turbo spin-echo sequences. We obtained T1WIs with 3D-MPRAGE sequences using the following parameters: TR, 1500 ms; TE, 1.9 ms; flip angle (FA), 9°; matrix, 256 × 232; field of view (FOV), 220 × 250; section thickness, 1 mm; and number of excitations (NEX), 1. The parameters in the axial FLAIR imaging were a TR of 9000 ms, a TE of 97 ms, an inversion time of 2500 ms, a FA of 130°, a matrix of 384 × 348, a FOV of 199 × 220, and a slice thickness of 5 mm. The parameters in the transverse T2WI were as follows: TR, 5160 ms; TE, 91 ms; FA, 130°; matrix, 640 × 510-580; FOV, 175-199 × 220; section thickness, 5 mm; and NEX, 3. CE T1WI was obtained after intravenous administration of Gadobutrol (Gadovist®, Bayer Schering Pharma, Berlin, Germany) at a dose of 0.1 mmol per kilogram (mmol/kg) body weight.
Quantitative Image Analysis
The MR imaging data were first transferred from the picture archiving and communication system workstation to a personal computer for further analyses. Image analysis was performed by an investigator (B.S.Y.) who was supervised by an expert neuroradiologist (C.S.H., 10 years of experience in neuroradiology). Coregistrations between the T2WI and CE T1WI were performed using a dedicated software package (NordicICE; NordicNeuroLab AS, Bergen, Norway), and semiautomatic segmentation was performed using another dedicated software package (NordicTumorEx). The volume of interest (VOI) was defined by adjusting the elliptical VOI manually in the software, and automatic segmentation was considered within only the defined VOI. Observers were required to define a contrast-enhanced mass that avoided the cystic or necrotic regions, intralesional macrovessels, or perilesional edema on the CE T1WI and a higher signal intensity area than the grey matter on the T2WI. In terms of T2WI-based volumetrics, cystic or necrotic portions were included. The volume of each area was also presented because the analysis was performed using volume data derived from three-dimensional analysis. Automatic segmentation with clustering analysis was performed after determining the VOI. The clustering analysis was conducted using the Expectation and Maximization algorithm. The software presented three to seven clusters that did not overlap with one another in the segmented VOI. We chose a seven-cluster module within the segmented VOI, and the observers selected several clusters by visual inspection. The volume information for each tumor based on both the T2WI and CE T1WI was automatically calculated within the segmented VOI for every tumor.
Statistical Analysis
All statistical analyses were performed using the MedCalc software (MedCalc version 14.12.0; MedCalc Software, Mariakerke, Belgium). Results with a P value of less than 0.05 were considered statistically significant. The clinical characteristics were compared between the IDH1P and IDH1N groups using Fisher's exact test for categorical variables and an unpaired Student's t-test for non-categorical variables.
Kolmogorov-Smirnov's test was used to determine the normality of the distribution of non-categorical variables. According to the results of Kolmogorov-Smirnov's test, an unpaired Student's t-test was performed to compare tumor volume between the IDH1P and IDH1N groups. The area under the receiver operating characteristic (ROC) curve (AUC) was used to determine the optimum tumor volume cutoff values for differentiating IDH1P from IDH1N using the method proposed by DeLong et al. (13). After obtaining cutoff values, sensitivities (detection of IDH1P GBM) and specificities (detection of IDH1N GBM) were calculated, and the ROC curves based on the tumor extents by T2WI and CE T1WI were compared between the two groups.
RESULTS
Clinical Characteristics
In the present study, we enrolled a total of 109 patients diagnosed with GBM: IDH1P (n = 12) and IDH1N (n = 97). No IDH2 mutation was detected in any of the patients. Among the clinical characteristics, only patient age was significantly lower in the IDH1P group compared to the IDH1N group (Table 1).
Volumetric Analysis Based on T2WI and CE T1WI
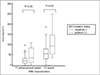
The mean tumor volume by CE T1WI was significantly larger in the IDH1P group than in the IDH1N group (49.0 ± 40.1 [mean ± standard deviation] mm3 and 22.5 ± 17.5 mm3, respectively, P < 0.0001). The maximum value in the IDH1P group was 109.7 mm3 and the minimum was 1.4 mm3. The maximum value in the IDH1N group was 97.9 mm3 and the minimum was 0.4 mm3 (Fig. 1).
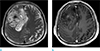
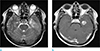
Moreover, the IDH1P group showed a significantly larger volume by T2WI than the IDH1N group (108.8 ± 68.1mm3 and 59.3 ± 37.3 mm3, respectively, P = 0.0002). The maximum value in the IDH1P group was 248.7 mm3 and the minimum was 36.4 mm3. The maximum value in the IDH1N group was 185.9 mm3 and the minimum was 1.8 mm3 (Fig. 1). Figures 2 and 3 show representative cases of GBMs with IDH1P and IDH1N, respectively.
The CE T1WI to T2WI tumor volume ratio was not significantly different between the IDH1P and IDH1N groups (40.7 ± 25.5% and 43.1 ± 30.1%, respectively, P = 0.7925).
Diagnostic Performance of Volumetric Analysis for the Differentiation of IDH1P from IDH1N
Table 2 summarizes the results of the ROC analyses of mean tumor volume for the differentiation of IDH1P (n = 12) from IDH1N (n = 97) GBMs. The AUC values of the T1 enhancement and T2 extent of the tumors were 0.686 (0.590-0.771) and 0.733 (0.640-0.813), respectively (P = 0.0666 and 0.0035, respectively). In terms of the differentiation of IDH1P GBMs from IDH1N tumors, the sensitivity and specificity were 58.3% (7 of 12 IDH1P) and 81.4% (79 of 97 IDH1N), respectively, using a T2WI-based tumor volume cutoff value of 90.25 mm3.
DISCUSSION
In this study of the imaging features of IDH1P and IDH1N GBMs on T2WI and CE T1WI, we found that IDH1P GBMs had a larger volume on both T2WI and CE T1WI, and the tumor extent on T2WI was more significantly different.
IDH mutation is a highly selective molecular marker of secondary GBMs that complements the clinical criteria for their differentiation from primary GBMs (7). Only ~5% of primary GBMs have IDH mutations; however, ~60-80% of diffusely infiltrating gliomas and secondary GBMs have IDH mutations (357). The IDH mutation state of these tumors is the cause of their different features. Secondary GBMs grow stepwise, and they infiltrate into other tissues; thus, their MR imaging and histopathological findings are heterogeneous, and the tumor is larger than primary GBMs (141516). In addition, previous studies using magnetic resonance spectroscopy (MRS) showed that the accumulation of 2-hydroxyglutarate (2-HG) in the tumor was associated with IDH mutations in 30 patients with gliomas, which was likely related to the slow tumorigenesis of secondary GBMs (171819).
To our knowledge, no study of the correlation of tumor volume imaging and the IDH mutation status has been performed, and few studies have assessed the therapeutic responses of GBM with IDH1 mutation using T2WI and CE T1WI (2021). Although several advanced MR imaging techniques, including perfusion study and diffusion-weighted imaging, have become popular for glioma evaluation (14), T2WI and CE T1WI remain essential for obtaining basic information such as tumor location and the extent and presence of leptomeningeal seeding, which are necessary for treatment planning. Our results suggest that by both T2W1 and CE T1W1, the IDH1P group showed a significantly larger tumor volume than the IDH1N group. As mentioned above, secondary GBMs with the IDH1 mutation progress stepwise; thus, they have heterogeneous glioma components including low- and high-grade portions (14). Thus, we assumed that IDH1P GBMs could have a more infiltrative nature than IDH1N GBMs, which might cause differences in the tumor volumes on the T2WI and CE T1WI. Additionally, in a previous study (22), conventional MR imaging of GBM with IDH1P showed a large tumor size, the presence of large nonenhancing regions, and more frequent involvement of the frontal lobe. Interestingly, however, we found no significant difference in the CE T1WI to T2WI tumor volume ratio between the two groups. We believe that the CE T1WI to T2WI tumor volume ratio of the GBMs could be affected more by tumor extent than by tumor heterogeneity, related to the IDH1 mutation status.
As mentioned above, relatively young patients were more frequent in the IDH1P group than in the IDH1N group (Table 1). It seems that the GBMs with IDH mutations start gliomagenesis earlier than those without IDH mutations. In previous reports (723), there was also a marked difference in the age distribution of the patients with primary and secondary GBMs, and similarly those with and without IDH1 gene mutations.
Other than the intrinsic limits of any retrospective study, several other limitations to our work should be noted. First, the patient population was relatively small, and because of the retrospective nature of the study, there could have been selection bias due to the inclusion and exclusion criteria. Further investigation of a larger population is warranted. Second, the tumor boundary was defined with reference to T2WI. T2WI included either tumor infiltration or peritumoral edema or a combination of the two. However, it is impossible to differentiate between these two components in an image-based study. Third, we did not include advanced imaging techniques—such as MR spectroscopy, perfusion imaging and diffusion-weighted imaging—which can provide valuable information regarding glioma physiology and metabolism.
In conclusion, our results suggest that T2WI and CE T1WI analysis based on tumor volume can facilitate detection of the more infiltrative imaging features of IDH1P GBMs, which differ from those of IDH1N tumors. Conventional imaging of GBMs should be carefully assessed for an accurate diagnosis and prognosis prediction.


 XML Download