

 PDF
PDF ePub
ePub Citation
 Print
Print


INTRODUCTION
Hyperpolarized 13C magnetic resonance spectroscopy imaging (MRSI) is an emerging technique to observe the metabolic activities of tissue after injecting hyperpolarized 13C-labeled substrates (12). Due to a low natural abundance of 13C, a special technique and equipment (dynamic nuclear polarization [DNP]), are required to enhance the magnetic sensitivity of 13C nuclei by 10,000-fold or more, compared to the thermal equilibrium (3). One of the widely used molecules for hyperpolarization is [1-13C] pyruvate, which is converted to several downstream metabolites such as lactate, alanine, and bicarbonate (4). The real time metabolic activities of tissues can be observed by measuring the conversion of injected substrate to downstream metabolites via magnetic resonance spectroscopy (MRS). Diagnosis and observation of treatment response for several diseases, such as cancer (256), heart disease (7), and diabetes (8), can be made by observation of metabolic activities.
Hyperpolarized 13C-labled substrates experience irrecoverable signal decay by T1 relaxation. With T1 relaxation constraint of ~20 s (9.4 T), it is important to acquire the hyperpolarized signal rapidly and efficiently. Furthermore, downstream metabolites converted from injected substrates still have a low sensitivity. Thus, it is critical to determine optimal scan-time window to increase the signal-to-noise ratio (SNR) in hyperpolarized 13C MRSI. Conventionally, pre-scans of time-resolved hyperpolarized 13C magnetic resonance spectroscopy (MRS) were performed, and the scan-time window was determined directly from the dynamic intensity curves of downstream metabolites (9); however, this approach may not be optimal. In pre-scans of time-resolved MRS, RF excitations were performed before, or right after, injection of pyruvate. However, in hyperpolarized 13C MRSI, RF excitation were performed only during the pre-determined scan-time window. Due to different RF excitations, and thus the different remaining polarizations, dynamic polarization curves in hyperpolarized 13C MRSI cannot be represented well by the dynamic intensity curves in timeresolved MRS. In this study, the protocol-specific simulation methods using two-site exchange model were proposed to find the optimal scan-time window to maximize the SNR of downstream metabolites in hyperpolarized 13C MRSI. Determined optimal scan-time window was validated by multiple in vivo experiments of tumor-bearing mice via injection of hyperpolarized [1-13C] pyruvate.
MATERIALS AND METHODS
MRSI Simulation Based on Two-site Exchange Model
The dynamic curve of pyruvate and lactate signal can be simulated by considering the arterial input function (AIF) of the two-site exchange model, i.e., Eq. [1-2] (10).


Here, Mpyr (t) and Mlac (t) are the time course function of 13C pyruvate and lactate signal, respectively. In addition, several parameters are used for this model. kx (x represents the pyruvate or lactate) is the rate constant for signal decay (in s-1), which involves both T1 decay and signal loss from excitation. kpyr→lac represents the conversion rate constant (in s-1). rateinj is the rate of pyruvate arrival (in a.u. s-1). tarr represents the time of pyruvate arrival (in s), and tend is the time of pyruvate maximum in the dynamic curve (in s). In this simulation model, several assumptions were made. First, duration from tarr to tend , rate of injection (rateinj), the T1 relaxation time of pyruvate, and conversion rate constant of pyruvate to lactate (kpyr→lac) for selected slice, can be estimated by pre-scans of time-resolved MRS. Second, the T1 relaxation times of pyruvate and lactate are equal (2). Backward reaction rate constant (klac→pyr) was ignored (6). Based on the pre-scans, the parameters used for simulation are as follows; 6s of duration between tarr and tend , 0.3 s-1 of rateinj , 21 s of T1 for 9.4 T in vivo environments, 0.0063 s-1 of kpyr→lac.
Based on the dynamic curve simulation, signal intensities of lactate on MRSI were simulated with multiple conversion rate constant values (kpyr→lac) and starting time of MRSI after injection (time after tend). The parameters of MRSI simulation are 10° of flip angle, 21 s of T1 relaxation time, 81ms of repetition time (TR), and 8 × 8 matrix size. Other parameters were the same as the dynamic curve simulation.
In vivo Experiments
All experiments were performed on a 9.4 T Bruker BioSpec 94/20 small animal imaging MRI (Bruker BioSpin MRI GmbH, Ettlingen, Germany) equipped with 1H-13C dual-tuned mouse surface transmit/receive coil. Six-week-sold BALB/C nude mice, with MDA-MB-231 breast tumor cells implanted in the striatum of brain, were used for the animal studies. The mice were anesthetized using isoflurane during the MRI scan at the level of 1-3%. The animals were kept warm on a heating bed with circulating warm water. Temperature and breathing were monitored during the experiments. All animal procedures were approved by the institute animal care and use committee. For anatomical information, high resolution T2-weighted turbo RARE 1H MR images in axial plane were acquired, with 2 mm slice thickness and 0.125 × 0.125 mm2 resolution.
For hyperpolarized 13C experiments, [1-13C] pyruvic acid doped with 15 mM Trityl radical and 1.5 M Dotarem was polarized using HyperSense DNP polarizer (Oxford Instruments, Molecular Biotools, Oxford, UK). 3.8 mL of Tris/EDTA (40 mM Tris, 21.6 mM NaOH, 0.1 g/L EDTA, 50 mM NaCl) solution was used for dissolution. After dissolution, approximately 350 µl of hyperpolarized pyruvate, having a concentration of 75 mM and a pH of around 7.5, was injected over a duration of 6 s, through a tail vein catheter.
For time-resolved hyperpolarized 13C MRS experiments, slice-selective FID data with a flip angle of 10° and temporal resolution of 1 s were acquired using a pulse and acquire sequence. A 10 mm-thick axial slice was selected, including whole brain. Data acquisitions started before the injection of [1-13C] pyruvate into mouse and continued for two minutes. The spectral bandwidth of acquired data was 6510 Hz with 2048 spectral points. Seventeen BALB/C nude mice, having the MDA-MB-231 breast tumor cells, were scanned.
For hyperpolarized 13C MRSI experiments, FID CSI sequence with centric-ordered phase encoding was used. MRSI data were acquired with constant flip angle (FA = 10°), repetition time (TR = 81 ms), and 2 mm of slice thickness, resulting in a total scan time of 5.2 s. The FOV was set to 16 × 16 mm2 to cover a mouse brain having 8 × 8 matrix size. The spectral bandwidth of acquired data was 6510 Hz with 512 spectral points. Hyperpolarized 13C MRSI experiments were performed at different scan timing to compare the SNR of downstream metabolites on targeted tumor between, before, and after optimization (n = 3 for 7 s after injection, and n = 3 for 15 s after injection).
All data were processed using MATLAB (R2012a, MathWorks, Natick, MA, USA). MRS and MRSI data were apodized by a 33 Hz Lorentzian filter and zero-padded with 4096 points in time domain prior to FFT. The conversion rate constant, kpyr→lac, was estimated from pre-scans of time-resolved MRS data by fitting the dynamic intensity curves to Eq. [1] and [2] after injection (t > tend). The metabolite map was obtained from MRSI data by measuring the peak signal-to-noise ratio (PSNR) values of metabolites in each voxel. To visualize the results, measured PSNR values were overlaid with the high resolution 1H T2-weighted anatomical image.
RESULT
In time-resolved MRS, the apparent conversion rate constant was estimated as 0.0063 ± 0.004 in selected tumor-bearing slices (n = 17). In addition, T1 relaxation time constant was estimated at 21 ± 4.4 s in 9.4 T environments. Mean values of apparent conversion rate constant and T1 relaxation time constant were used for determining the optimal scan-time window for hyperpolarized 13C MRSI.
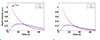
Figure 1 represents the simulated lactate signal with temporal resolution of 1 s for two cases, one without RF excitation (Fig. 1a) and one with RF excitation (flip angle = 10°) (Fig. 1b). In simulated lactate signal evolution without RF excitations (Fig. 1a), lactate has maximum signal intensity at 16 s after tend, which is 22 s after pyruvate arrival (red dotted line). With RF excitations, maximum of lactate signal appeared 18 s after pyruvate arrival (Fig. 1b), which is 4 s earlier than without RF excitation.
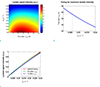
In addition to previous dynamic simulation, the signal intensities of lactate on MRSI were simulated with multiple conversion rate constant values in ranges of 0.001-0.02 and acquisition timings in range of 0-30 s (Fig. 2). The optimal scan timing for any conversion rate constant, which results in the maximum signal intensity of lactate on MRSI, can be determined by simulation (Fig. 2a). Figure 2b shows the optimal scan timing for each kpyr→lac. For higher conversion rate constant, the optimal scan timing is earlier. The optimal scan timing corresponding to the measured mean apparent conversion rate constant was about 15 s after injection. Figure 2c compares the lactate signal intensity acquired at different scan timing for each kpyr→lac : optimal timing, 7 s after tend and 15 s after tend. For 0.0063 of kpyr→lac, the lactate signal intensity acquired at 7 s after tend is 10% less than the optimal timing. In contrast, the lactate signal intensity scanned at 15 s after tend is 0.01% less than optimal timing. Thus, we can say that the optimal scan time is almost 15 s after tend.
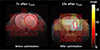
For in vivo experiments, multiple hyperpolarized 13C MRSI were performed to compare the SNR of lactate between, before, and after optimization of scan timing. Control experiments were performed by scanning at the earlier timing of 7 s after tend. Figure 3 shows the lactate peak signal-to-noise (PSNR) maps. Before the optimization of scan-time window, PSNR of lactate in the voxels corresponding to tumor was 8 ± 4.6 (n = 3). PSNR of lactate scanned after optimization of scan-time window was 18.5 ± 3.1 (n = 3). Through the optimization of scan-time window using simulation of two-site exchange model, 230% increase in the downstream metabolite PSNR was achieved.
DISCUSSION
In this study, the measured conversion rate constant (kpyr→lac) value of selected tumor-bearing slice was very low (0.0063 s-1). Due to a low concentration of lactate converted from the injected pyruvate, SNR of lactate signal in selected slice was low. The improvements in lactate SNR was achieved by optimization of scan-time window. For higher values of kpyr→lac, a higher increase in the lactate SNR can be expected (Fig. 2c).
In this study, the pre-scans of time-resolved MRS data were acquired from tumor-bearing slice, including normal brain. In other words, the acquired data represented the dynamics of both normal brain and tumor. Scan-time window was optimized to improve the SNR of lactate in whole slices. If the kpyr→lac of tumor can be measured, the scan-time window can be optimized to improve SNR of lactate signal in tumor.
In pre-scans of time-resolved MRS, the standard deviation of estimated kpyr→lac value was comparable to the mean value. The conversion rate constant depends on the progression of tumor, conditions of each mouse (perfusion, metabolism, and anesthesia state etc.), and conditions of experiments (hyperpolarization level, injection duration etc.). Mean value of estimated kpyr→lac was used for simulation to optimize the scan-time window.
In hyperpolarized 13C studies, the signal is irrecoverable, which decreases with metabolic conversion, T1 relaxation, and RF excitation. For these reasons, we used FID CSI sequence with centric ordered phase encoding. After acquiring data on the center of k-space first, it is beneficial to increase the SNR of metabolites. Furthermore, temporal and spatial resolutions are limited. Due to these limitations, low resolution of MRSI experiments, which were 2 × 2 mm2 of resolution, were performed in this study. The PSNR of lactate in MRSI was calculated voxel by voxel as shown in Figure 3. In low resolution images, partial-volume effects can lead to errors in the quantification of lactate in the brain and tumor tissues. If the MRSI experiments are performed with higher resolution, the quantification of PSNR improvement can be more accurate.
Furthermore, the lactate map was well-localized to the tumor after scan-time window optimization (Fig. 3). However, any quantitative analysis related to localization was not performed in this study. Localization analysis involved with simulating point spread functions (PSFs) remains as a future work.
In conclusion, in hyperpolarized 13C MRSI experiments, it is important to determine the scan-time window in terms of SNR of downstream metabolites. Conventionally, the scan-time window was determined by pre-scans of time-resolved MRS experiments. However, it may not be an optimal timing. Thus, protocol-specific simulation approaches were developed to determine the optimal scan-time window for hyperpolarized 13C MRSI. Using the determined optimal scan-time window, SNR of downstream metabolites (i.e., lactate) was maximized in hyperpolarized 13C MRSI.
 XML Download