

 PDF
PDF ePub
ePub Citation
 Print
Print


INTRODUCTION
Intracranial hypertension (IH) is caused by various conditions but can develop without specific cause, which is known as idiopathic intracranial hypertension (IIH) or pseudotumor cerebri (1234). Direct measurement of intracranial or lumbar cerebrospinal fluid (CSF) pressure can make a definite diagnosis of IH, but it is an invasive technique and can be technically challenging in obese patients. Its usefulness is also limited due to false-negative results caused by the fluctuation of spinal fluid pressure, and patients require repeated lumbar punctures when the clinical suspicion of IH is high (5). Although papilledema can serve as a useful indicator of IH (6789), it may not be visible in patients with acute elevation of intracranial pressure (10). Thus, recognition of MR imaging findings representative of IH can be helpful in patients with limited clinical examinations.
Many reports have described MRI findings of IH, including posterior globe flattening, optic nerve protrusion (3611), and optic nerve sheath distension (89). According to the reports by Agid et al. (11) and Rohr et al. (3), both posterior globe flattening and optic nerve protrusion are very specific for IIH, but they are not sensitive enough to determine IIH in all patients. In addition, the optic nerve sheath diameter (ONSD) has various size criteria indicating abnormality, which complicates the application of this method to diagnose IH. We hypothesized that the lower sensitivity of these specific signs for IH is attributable to the partial-volume effect seen in conventional thick-slice imaging. A 3D, thinner MRI may improve detectability of posterior globe flattening, which is more prevalent than optic nerve protrusion.
Therefore, the purpose of our study was to compare the frequency of posterior globe flattening between two-dimensional (2D) 5-mm and three-dimensional (3D) 1-mm isovoxel T2-weighted imaging (T2WI) in patients with suspected IH.
MATERIALS AND METHODS
This retrospective study was approved by our Institutional Review Board, and informed consent of subjects was waived.
Patients
Out of 2937 patients who underwent routine head MRI between October 2013 and March 2014, 69 were clinically suspected of having IH of various causes, including headaches (n = 30), intracerebral hemorrhage (n = 19), tumors (n = 15), acute infarct (n = 3), and bacterial meningitis (n = 2) were enrolled. Patients who had severe artifacts on images and alterations in eye globes were excluded.
MRI
We replaced T1-weighted sagittal imaging with 3D 1-mm isovoxel T2WI for routine head MRI in October 2013. MRI was performed using a 1.5- and two 3.0-T MR imagers (Avanto, Skyra, and Verio; Siemens, Erlangen, Germany). All patients underwent head MRI including both 2D axial T2WI and 3D 1-mm isovoxel T2 sampling perfection with application-optimized contrasts using different flip-angle evolution (SPACE) imaging. Axial T2WI was obtained using a turbo spin-echo technique at 5-mm slice thickness with a 1-mm gap; (TR/TE, 4000/115; field of view [FOV], 151-230 mm; matrix, 384 × 290; number of signals acquired, 1; and in-plane resolution, 0.7-0.9 mm; acquisition time, 2 minutes 34 seconds; Avanto), (TR/TE, 6300/100; FOV, 151-230 mm; number of signals acquired, 1; and in-plane resolution, 0.7-0.9 mm; acquisition time, 2 minutes 41 seconds; Skyra), (TR/TE, 6100/92; FOV, 448-364 mm; number of signals acquired, 1; and in-plane resolution, 0.7-0.9 mm; acquisition time, 2 minutes 51 seconds; Verio). Sagittal 3D 1-mm isovoxel T2-weighted SPACE imaging was obtained with the following parameters: at Avanto (TR/TE, 4000/480; FOV, 250 mm; matrix, 256 × 258; number of signals acquired, 1; acquisition time, 4 minutes 16 seconds), at Skyra (TR/TE, 3200/411; FOV, 250 mm; matrix, 256 × 256; number of signals acquired, 1; acquisition time, 3 minutes 26 seconds), and at Verio (TR/TE, 3200/434; FOV, 250 mm; matrix, 256 × 258; number of signals acquired, 1; acquisition time, 3 minutes 26 seconds). Generalized auto calibrating partially parallel acquisition (GRAPPA) was applied to both types of imaging with a reduction factor of two.
Image Analysis
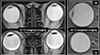
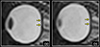
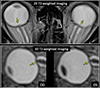
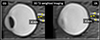
Both T2WI were analyzed independently by two radiologists (one with 11 and one with 4 years of experience) at separate sessions two weeks apart. All images were reviewed in a randomized order using Osirix version 5.9 (Pixmeo, Switzerland). Three-dimensional multiplanar reformation was used for assessment of eyes on 3D T2WI (Fig. 1). The presence or absence of posterior globe flattening and optic nerve protrusion was first assessed. Posterior globe flattening was determined when there was a straightening of the normal outward convexity of the sclera at the area of attachment to the optic nerve or indentation of the posterior globe by dilated optic nerve sheath (Fig. 2). Optic nerve protrusion was defined as visualization of concave sclera at the area of optic nerve attachment by the hypointense optic nerve (Fig. 3). The ONSD was measured 4 mm posterior to the eye globe on multiplanar-reformatted sagittal 3D T2WI (912) (Fig. 4).
Statistical Analyses
Inter-rater reliability of the two radiologists' assessment was tested using Cohen's kappa with interpretation according to the report by Landis et al. (13). Differences in frequency of the posterior globe flattening between 2D and 3D T2WI were assessed using a chi-square test. The ONSD was compared between the two reviewers using the intraclass correlation coefficient, and the Bland-Altman plot was also used. After testing for data normality, an independent sample t-test was used to compare the ONSD between the groups with or without posterior globe flattening, on 2D and 3D T2WI each. Values were expressed as mean ± standard deviation and P values < 0.05 were considered statistically significant. Statistical analyses were performed using SPSS (version 21; IBM, Armonk, NY, USA) and MedCalc (version 13; MedCalc Software, Mariakerke, Belgium).
RESULTS
Frequency of Posterior Globe Flattening between 2D and 3D T2WI
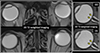
Posterior globe flattening was detected more frequently on reformatted 1-mm 3D T2WI than on 5-mm 2D T2WI (105 out of 138 eye globes on 3D T2WI versus 27 on 2D T2WI, P = 0.001) (Fig. 5). Inter-rater reliability was almost perfect in both 2D and 3D T2WI (κ = 0.928 and 0.962, respectively).
Optic Nerve Sheath Diameter
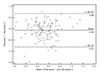
The ONSD measured on reformatted 3D T2WI was significantly greater in patients with posterior globe flattening on 2D T2WI (6.14 [mean] ± 0.44 mm [standard deviation]) and on 3D T2WI (5.90 ± 0.47 mm) than in those without posterior globe flattening on 2D T2WI (5.74 ± 0.44 mm) and on 3D T2WI (5.56 ± 0.34 mm); P < 0.001, both. There was excellent agreement in measurement of ONSD on 3D T2WI (intraclass coefficient, 0.835; 95% CI, 0.766, 0.883). The Bland-Altman plot showed a slight bias between the two observers with mean differences ranging from -0.81 to 0.68 (Fig. 6).
Optic Nerve Protrusion
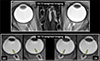
Optic nerve protrusion was more frequent on reformatted 1-mm 3D T2WI than on 5-mm 2D T2WI (8 out of 138 globes on 3D T2WI versus one on 2D T2WI; P = 0.018) (Fig. 7).
DISCUSSION
Our study demonstrates that 3D T2WI has greater detection sensitivity of posterior globe flattening than conventional 2D T2WI in patients with suspected IH. Optic nerve protrusion, a more specific indicator of IH, is more frequently observed on 3D T2WI than on 2D T2WI, although the number of patients with this sign is relatively small.
Papilledema is a useful indicator of IH. However, as shown in a previous study, it may be limited in acute clinical settings as a few days is required before the appearance of edema in the optic disc (14). In addition, papilledema may not be present in some patients with pre-existing optic atrophy (15). Also, direct measurement of intracranial pressure is sometimes limited due to its invasiveness and fluctuation. Given the above-mentioned reasons, MRI may be more suitable for evaluation of IH because it is noninvasive and objective. By taking advantage of MRI, some have proposed that MR imaging findings could be used to diagnose IIH, even in the absence of clinically recognizable papilledema (1617). Thus, more accurate and sensitive imaging techniques are needed for better evaluation of IH.
Of several imaging findings suggested in previous studies to indicate IH (368911), posterior globe flattening and optic nerve protrusion are considered specific signs for IIH (311). However, these imaging signs for IIH are limited by lower sensitivity, particularly in regard to optic nerve protrusion. We thought that this lower sensitivity may be due to a partial volume effect from conventional thick-slice MR imaging. Routine head MRI is usually obtained with 5 mm thickness including a 1-mm gap. In patients requiring further assessment for IH, 3-mm thick 2D imaging is usually obtained, which increases imaging acquisition times. Even worse is that the position of the eye globes and optic nerve is not always parallel to an axial imaging plane. Last, the optic nerve head is not large enough to be accurately visualized on 2D imaging. Consequently, transverse 2D imaging may not be suitable for assessment of posterior globe flattening and optic nerve protrusion. Therefore, we hypothesized that 3D 1-mm isovoxel T2WI would increase the detection sensitivity of posterior globe flattening and optic nerve protrusion.
A previous study suggested that high-resolution 3D T2*-weighted imaging improved visualization of the CSF within the optic nerve sheath in patients diagnosed with papilledema (18). Recently, another report suggested that 3D constructive interference in steady state imaging, with a slice thickness of 0.69-1 mm, improves visualization of optic nerve head deformity in patients with papilledema when compared to conventional 5-mm 2D T2WI (12). We acknowledge that these two previous studies have already demonstrated the superiority of thin 3D imaging to 2D imaging. In those studies, however, additional imaging for evaluation of papilledema was obtained in patients who had undergone routine head MRI. Our imaging protocol, on the other hand, does not require additional scanning and the acquisition time of 3D T2WI is shorter than those reported in previous studies, which potentially reduces the chance of motion-induced artifacts. In addition, our 3D T2WI enables assessment of the pituitary gland height and shape of the sella. Another advantage of 3D T2WI with variable flip angles is that it is very sensitive to vascular flow without application of additional black-blood techniques, allowing us to evaluate the venous sinuses without intravenous administration of a gadolinium contrast medium. We are prospectively evaluating the venous sinuses in patients with nonspecific headaches, with comparable results to dynamic-enhanced MR angiography. We believe that 3D T2WI can serve as a useful tool for evaluation of not only IIH but also IH with secondary causes.
A significant difference of ONSD was found between the two groups, with or without posterior globe flattening, which supports our observation of 3D reformatted imaging. However, there has been no definite threshold of ONSD to suggest IH. Previous studies proposed their own thresholds, but they are limited, due to a significant overlap between patients and control groups. Standard imaging plane, imaging sequence, or specific location for evaluation of ONSD has yet to be determined. Hence, we believe that the ONSD even measured on reformatted 3D T2WI is less reliable than posterior globe flattening for assessment of IH, and further study is needed for use in clinical settings.
In our study, optic nerve protrusion was observed more frequently on reformatted 3D 1-mm T2WI than on 2D 5-mm T2WI, in line with previous observations (12). This is more specific than posterior globe flattening, but it tends to appear in patients with severe IH, and always manifests with posterior globe flattening. Therefore, it is more important to assess the presence or absence of posterior globe flattening using high sensitivity methods in patients with mild or nonspecific symptoms and signs.
We acknowledge the following limitations: First, a retrospective study with a selected group of patients may limit the value of our results. Second, measurement of the CSF pressure and ophthalmologic examination were not performed. However, as mentioned previously, these tests have certain clinical limitations. Despite not performing gold standard studies, we believe our observation is valid because posterior globe flattening is a direct manifestation of a pressure gradient between the globe and CSF space. Third, imaging evaluation was still based on a subjective method even though inter-observer agreement was excellent. A recent report suggested that automated quantitation of the posterior scleral flattening and optic nerve protrusion improved reliability over a subjective rating (19). Thus, application of such an automated quantitation technique to our 3D T2WI, although it requires additional time for processing, would be desirable. Last, three different MRI scanners were used in acquisition of MR imaging. However, we have not observed any significant difference between machines when evaluating eye globes, which is frequently observed in some patients who underwent serial imaging studies using different scanners.
In conclusion, detection of posterior globe flattening is significantly more frequent on 3D 1-mm isovoxel T2WI than on 2D 5-mm T2WI in patients suspected of having IH.
 XML Download