

 PDF
PDF ePub
ePub Citation
 Print
Print


INTRODUCTION
An aging global population has resulted in increased prevalence of neurodegenerative diseases, including dementia. The most common form of dementia is Alzheimer's disease (AD), followed by vascular dementia, Lewy body dementia, Parkinson's disease dementia, frontotemporal lobar degeneration, and other dementias (1). Regardless of the differing pathology and underlying proteinopathies, most neurodegenerative dementias result in progressive neuronal cell loss, which is strongly correlated with cognitive decline. Therefore, numerous approaches have been developed to detect decreases in cortical volume and increased cortical atrophy, including manual segmentation (23), voxel-based morphometry (4) and cortical thickness analyses (56). Using the Freesurfer software, developed by Fischl et al. (7), has become the most widely used approach for measuring cortical thickness in various brain regions. Freesurfer does not have a cost for use and is compatible with most hardware and software platforms. However, because it was originally developed for research purposes, Freesurfer does require a high performance computer workstation and has long processing durations (8).
Recently, Lin et al. (8) introduced a new method of cortical thickness analysis, which they termed the brain surface intensity model (BSIM). The BSIM extracts a one-dimensional intensity profile perpendicular to the gray matter iso-intensity layer (GMIIL) at each surface point. Cortical thickness is then calculated at each surface point using the surface intensity model fit (8). Unlike Freesurfer, the BSIM-based method does not segment gray matter from white matter, but instead computes cortical thickness using the local intensity profile. This model of fit reduces the effects of partial volume and image noise, thereby achieving sub-millimeter resolution (89).
With BSIM, however, use of deformed brain mesh and subsequent semi-automatic skull stripping increases susceptibility to measurement variability (8). In addition, BSIM-based cortical thickness measurements have only been tested using the Alzheimer's Disease Neuroimaging Initiative (ADNI) and Australian Imaging Biomarkers and Lifestyle Study of Ageing (AIBL) databases, which contain 1.5T images. This method has not previously been evaluated in an elderly Asian population using 3T images. There are ethnic differences in brain morphology (1011) and cortical thickness, so use of BSIM-based cortical thickness measurements in other populations must be evaluated (12).
We aimed to evaluate intra-rater and inter-rater reliability of BSIM-based cortical thickness analysis, for use of adjunct clinical tool to detect cortical atrophy, in cognitively healthy elderly Asian participants. In addition, we compared cortical thickness measurements from our participants to findings of previous research.
MATERIALS AND METHODS
Participants
This retrospective study enrolled 15 healthy elderly participants between 55 and 84 years of age (M:F = 5:10; mean, 73.9 ± 8.2 years), recruited from patients referred for the MR imaging protocol using 3D T1-volumetric imaging. Referrals resulted from routine medical exams between June 2006 and August 2010 at our university-affiliated hospital. Participants were included if they showed no clinical evidence of neuropsychiatric disorders and no apparent abnormal findings on the MR study. We excluded patients with a history of neurological disease, malignancy, stroke, or brain surgery. Indications for MRI included headaches (n = 1), dizziness or vertigo (n = 2), and health screening (n = 12). Mini-mental status examination (MMSE) score for the subjects was 26.3 ± 3.78.
Our Institutional Review Board approved the study, and written informed consent was waived.
MR Imaging Protocol
All participants underwent MR imaging using a 3T unit (Signa HDx, GE Healthcare, Milwaukee, WI, USA) with an 8-channel head coil. The routine MR imaging protocol included the following sequences: 1) axial and sagittal T1-weighted inversion-recovery (repetition time [TR]/ echo time [TE]/ inversion time [TI], 2468/12/920 ms; section thickness, 5 mm; matrix, 512 × 224); 2) axial T2-weighted fast spinecho (FSE) (TR/effective TE, 4000/106 ms; section thickness, 5 mm; matrix, 384 × 384); 3) axial fluid-attenuated inversion-recovery (TR/TE/TI, 11,000/105/2600 ms; section thickness, 5 mm; matrix 384 × 224); 4) axial T2-weighted gradient-echo (GRE) (TR/TE, 550/17 ms; section thickness, 5 mm; matrix, 384 × 224; flip angle, 15°); and 5) T1-weighted volumetric spoiled gradient recalled-echo (SPGR) (TR/TE, 7.3/2.7 ms; section thickness, 1.5 mm; matrix, 256 × 256; flip angle, 13°). The field of view was 230 × 230 mm.
MR Imaging Analyses
One neuroradiologist with 12 years of experience in neuroimaging, 1 general radiologist (1 year experience in neuroimaging), and 1 radiology technician with 5 years of experience in brain MR imaging independently performed the analyses. Training sessions were conducted for the BSIM-based cortical thickness analysis, for a total of 12 h (3 h each day for 4 d) per rater. In order to evaluate intra-rater variability, 1 rater (rater 1) repeated all analyses 1 month following the initial measurements.
BSIM-based cortical thickness analyses were performed using CorThick software (GE Healthcare) on an AW workstation (GE Healthcare). Corrections for inhomogeneity and intensity normalization were first performed. Next, semi-automatic skull stripping was performed; Brain mesh from 10,242 vertices inside the brain was automatically deformed to the brain edge in order to segment brain tissue from non-brain tissue. Then, some remaining nonbrain tissue within the brain mesh was manually deleted (8). Skull stripped brains were registered to a Talairach atlas and 15,964 brain surface reference points were defined around the brain surface. A direction perpendicular to the gray matter iso-intensity layer was calculated from each point and MR intensities along the direction were sampled to create MR intensity profiles across the brain surface. This local intensity profile was then fitted using the BSIM to determine the boundary between cerebral spinal fluid and gray matter, and the boundary between gray and white matters. Cortical thickness was then defined as the distance between these two points, without segmentation. Cortical thicknesses calculated at 15,964 points were color coded, and superimposed on individual brain surfaces (8 9).
Cortical thickness was measured in the following 12 brain regions using pre-defined regional templates that were already implemented within the CorThick software: the parietal, temporal, frontal, occipital, posterior cingulate, anterior cingulate, medial frontal, medial parietal, somatomotor, visual, cerebellum, and "other" regions. The "other" region was comprised of the remaining cortex aside from the 11 functional regions. Individual cortical thicknesses were compared to mean cortical thicknesses from the normative databases within the CorThick software to compute the Z-score thinning maps. Twenty-nine cognitively healthy participants between 70 and 80 years of age were included in computations of the mean and standard deviations of cortical thickness that were used as a normative database of the CorThick software to calculate the individual Z-score values (8).
The duration of processing time required to measure cortical thickness was recorded only for rater 1 and rater 2, for each participant. The duration of processing time was not able to be evaluated for rater 3 due to lack of the data.
Statistical Analyses
Statistical analyses were performed using the Statistical Package for the Social Sciences (Version 17.0 for Windows; SPSS, Chicago, IL, USA) and MedCalc (Version 15.2.2, Mariakerke, Belgium). Values were considered statistically significant when P < 0.05. The intra-class correlation coefficient (ICC) was calculated in order to determine intra-rater (mixed-effect model) and inter-rater reliability (random-effect model) for regional cortical thickness measurements (1314). Fleiss (15) and Cicchetti et al. (16), have recommended for the interpretation of ICC values as following: ICC > 0.75 represents excellent reliability; 0.60-0.74, good reliability; 0.41-0.59, fair reliability; < 0.40, poor reliability. Mean values of the two measurements of rater 1 were used as the final cortical thickness values for the 12 brain regions. The difference in processing time between rater 1 and rater 2 was evaluated with a paired t-test.
RESULTS
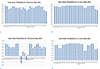
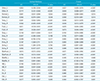
Overall, intra-rater reliability of the cortical thickness measurements was high (Fig. 1). Good reliability was observed for measurements from the right occipital, left anterior cingulate, and both cerebellar regions (ICCs = 0.651-0.741), whereas the remaining regions had excellent reliability (ICCs = 0.751-0.940). The Z-score maps of cortical thickness demonstrated that measurements from all regions except for the right cerebellum (ICC = 0.713) had excellent intra-rater reliability (ICCs = 0.759-0.949) (Table 1).
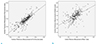
Conversely, inter-rater reliability was not consistent across brain regions, ranging from -0.457-0.815 (Figs. 1 and 2). Measurements from the frontal, medial frontal, sensorimotor, and other regions had excellent reliability (ICCs = 0.765-0.821). Measurements from the temporal, medial parietal, parietal, visual, and cerebellar regions had fair reliability (ICCs = 0.501-0.629). However, measurements from the anterior cingulate, posterior cingulate, and occipital regions resulted in poor or even negative correlations (ICCs = -0.457-0.299). Inter-rater agreement of Z-score map values was poor for the medial parietal region (ICC = 0.395) and fair for the parietal and cerebellar regions (ICCs = 0.459-0.504). All other regions had good reliability (ICCs = 0.619-0.703) (Table 2).
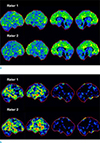
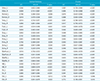
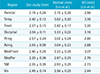
Cortical thickness measurements from all participants ranged from 2.03 ± 0.21 mm in the cerebellum to 2.57 ± 0.24 mm in the posterior cingulate region (Table 3). Z-score maps indicated that cortical thicknesses of participants in our study were not significantly different from those of participants in the databases, with the exception of the cerebellum (Zs = 1.80-3.21) for all participants (Fig. 3), and the temporal region in 1 participant (z = 1.82). The participant with decreased cortical thickness in the temporal lobe was an 80-year-old female.
Processing time duration, including manual skull stripping, was 17.07 ± 3.43 min for rater 1 and 17.73 ± 2.76 min for rater 2. There was no significant difference in processing time (P = 0.403, paired t-test) between raters.
DISCUSSION
We observed good to excellent intra-rater reliability for BSIM-based cortical thickness measurements in all brain regions, and fair to excellent inter-rater reliability in most brain regions, except for the anterior cingulate, posterior cingulate, and occipital regions. We also found that cortical thicknesses of our healthy participants varied from 2.03 ± 0.21 mm in the cerebellum to 2.57 ± 0.24 mm in the posterior cingulate.
Methods of analyzing cortical thickness vary from manual segmentation to extensive software based measurements using programs such as Freesurfer (7). Gray matter versus white matter histological differences are easily differentiated using MR imaging. Gray matter, which has higher water concentration, yields relatively low signal intensity. White matter, which has lower water concentration and higher myelin concentration, is indicated by relatively high signal intensity on T1-weighted images (17). Regional cortical thinning has been extensively studied using cortical thickness analysis, and is a valuable imaging marker for AD, frontotemporal lobar degeneration, Lewy body disease, and other neurodegenerative diseases (718192021222324). Longitudinal evaluation of cortical thinning is a potential tool for treatment response evaluation and for monitoring clinical progression of AD (25 26). Nevertheless, cortical thickness analysis methods have not been incorporated into radiological practice, primarily because the research-oriented Freesurfer method is time consuming and may need manual editing despite its fully automatic nature (78). Therefore, there is an increasing need to develop software for cortical thickness analyses that can be widely used in radiological practice.
ICCs for cortical thickness measurements and Z-score values indicated excellent reliability (0.751 - 0.940) in most brain regions. This is the first study to evaluate the intra-rater and inter-rater reliability of BSIM-based cortical thickness analyses. Test-retest reliability of Freesurfer reportedly ranged from 0.77 to 0.81 (27). Freesurfer and other segmentation-based methods require 3D surface measurements obtained by segmentation of gray matter from white matter in order to calculate cortical thicknesses (28). The cortical surface is then reconstructed as vertices on top of the segmented white matter, followed by definition of cortical thickness based on the distance between the white matter surface and the cortical surface (7). Accordingly, small errors in segmentation can lead to large errors in cortical thickness measurements. Factors affecting the segmentation quality include low image resolution, partial volume effects, image noise, image inhomogeneity, and highly convoluted 3D structures (8). In comparison with Freesurfer, BSIM-based cortical thickness analysis does not include volumetric segmentation of brain gray matter, but instead uses the local intensity profile to extract cortical thickness data (8). According to Lin et al. (8), the use of local intensity profiles is less sensitive to image inhomogeneity. The model fit also mitigates partial volume effects and image noise, while providing better resolution (sub-millimeter).
Despite regional variability between the 2 raters, overall inter-rater agreement was fair to excellent. The findings that ICCs ranged from -0.457-0.815 may be due to the semiautomatic skull stripping process or structural issues concerning the meninges. In particular, the anterior cingulate, posterior cingulate, and occipital regions did not have significant inter-rater correlations. Poor correlations for cortical thickness in the occipital region may reflect incomplete skull stripping, as partial removal of the cortex during the skull stripping process may change the intensity profile and result in erroneously decreased cortical thickness measurements. However, the skull stripping process is not a likely cause of the reduced accuracy in measuring cortical thicknesses in the anterior cingulate and posterior cingulate regions. A more plausible explanation is that the midline location of the anterior and posterior cingulate regions, as well as their close proximity to the falx cerebri (thick meninges), may contribute to incorrect local intensity profiles, thereby leading to poor correlations between the 3 raters.
In contrast, the Z-scores for cortical thickness indicated good inter-rater reliability, which is particularly meaningful because the Z-score map indicates no significant differences in cortical thicknesses between our sample and participants in the database samples. Poor inter-rater reliability for the Z-scores in the medial parietal region might also be due to poor skull stripping in the midline area or due to the overlying falx cerebri. The modest inter-rater reliability of Z-scores in the parietal and cerebellar regions may be due to either poor skull stripping or deformed mesh processing (8).
BSIM-based cortical thickness measurement is acceptable for use in clinical practice because it takes less than 20 min per patient. Compared to use of the research oriented Freesurfer method, BSIM-based cortical thickness measurement enables faster processing. Moreover, the training sessions in our study were only 12 h per rater. Our results demonstrate that BSIM-based cortical thickness analysis can be an efficient alternative tool to Freesurfer for cortical thickness analyses.
Our cortical thickness analyses indicated a thinner cortex compared to data from CorThick software analyses. The age range of our participants was 55-84, which did not differ from the comparison data. The present study indicated thinner cortices in the entire brain, compared to previously published histological data (8), which may have been induced by use of higher strength MR, a different type of T1 volumetric sequence (SPGR instead of magnetization prepared rapid acquisition gradient echo [MPRAGE]) (2930), and ethnic or cultural differences in cortical thickness (101112). Recruitment of participants from our dementia clinic, which is a university-affiliated hospital, may have resulted in selection bias. In the present study, Z-score maps for all participants were within normal ranges, except for 1 participant who had decreased temporal cortical thickness. However, it is possible that the participant could be in a pre-clinical stage of dementia without clinically detectable symptoms.
As demonstrated by our intra-rater and inter-rater reliability analyses, there were no significant differences between Z-score cortical thickness maps or cortical thickness measurements in most regions when raters were an experienced radiologist, a novice general radiologist, and a radiology technician. Ease of use and acceptable reliability are therefore strengths of the BSIM-based cortical thickness analysis method. Thus, BSIM-based cortical thickness analysis can be a valuable adjunct to clinical diagnosis of dementia because it enables rapid analysis of cortical atrophy.
There were some limitations to our study. First, we studied only 15 healthy aged participants. Second, semi-automatic skull stripping is an inherent constraint on accurate measurements. Differences in the skull stripping process may produce variation in cortical thickness calculations. However, this variability can be minimized by increased training and continually developing improved skull stripping methods. Finally, we cannot exclude possible effects of the source data quality in some brain regions. Although we used an optimized T1-weighted 3D SPGR sequence, this may not be the optimized sequence for cortical thickness analysis by BSIM. Furthermore, the ADNI study recommended a MPRAGE sequence for their multicenter study, due to segmentation power (2930). Specifically, the ADNI study suggested use of inversion recovery-prepared fast SPGR or MPRAGE sequences for assessing cortical thicknesses (30). A study with a larger sample size and using various 3D T1 volumetric sequences with patients who are diagnosed with various types of dementia is needed to further validate the BSIM-based method.
In conclusion, although some inter-rater variability was observed in the cingulate, occipital, and cerebellar regions, BSIM-based cortical thickness measurement provides acceptable intra-rater and inter-rater reliability. We therefore suggest BSIM-based cortical thickness analysis as an adjunct tool to detect cortical atrophy in clinical settings.
 XML Download