

 PDF
PDF ePub
ePub Citation
 Print
Print


INTRODUCTION
There are many types of relatively common soft tissue tumors, including myxoid tumors and benign peripheral nerve sheath tumors (BPNSTs). BPNSTs constitute more than 10% of all benign tumors, while myxoid tumors constitute about 3.2% of all benign tumors and over 11% of all malignant soft tissue tumors (12345). Myxoid tumors are connective tissue tumors that have a myxoid background and are composed of a clear, mucoid substance (67). There are many subtypes in the myxoid tumor group, such as myxoid liposarcoma, myxofibrosarcoma, fibromyxoid sarcoma, and others (6). BPNSTs include neurofibroma and neurilemmoma (1).
MRI plays an essential role in detecting soft tissue tumors, thus enabling treatment plans to be made earlier. However, it is very difficult to make a proper diagnosis based on MRI findings only, and additional pre-operative biopsy is required in many cases. Although many radiological findings of myxoid tumors and BPNSTs have been reported in previous studies (1891011121314151617181920), several imaging findings such as high signal intensity (SI) on T2-weighted image (T2WI), internal septations, and pronounced enhancement, have been found to appear in a similar manner, which makes it difficult to distinguish between myxoid tumors and BPNSTs. Moreover, from a pathological perspective, both myxoid tumors and BPNSTs include many subgroups with various degrees of myxoid components (8). Thus, making an accurate diagnosis based on MRI findings becomes more difficult, especially when the mass is adjacent to the neurovascular bundle. Especially, BPNSTs are benign, but malignancy is relatively common among myxoid tumors (72122). Thus, in contrast to local excision as treatment for most cases of BPNSTs, resection with wide surgical margin is needed for most myxoid tumors due to their higher local recurrence rate (12). If we focus on differential MRI findings and suggest a more probable diagnosis between the two tumors, it might be helpful for surgeons to plan treatment options or predict a prognosis much before pathological confirmation of the tumor. Therefore, the purpose of this study was to identify useful MRI findings for the differentiation of myxoid tumors and BPNSTs in the musculoskeletal system.
MATERIALS AND METHODS
Study Population
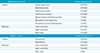
The Institutional Review Board approved this retrospective study, and waived the informed consent. The study group was selected from consecutive patients at the orthopedic cancer department who underwent MRI of a musculoskeletal region (thigh, calf, upper arm, forearm, or pelvis) between September 2011 and December 2013, and who were pathologically confirmed as having myxoid tumors or BPNSTs after surgery. Patients who had pathologically-confirmed myxoid tumors or BPNSTs after surgery, and who had outside MRI scans which were uploaded on a picture-archiving communication system between September 2011 and December 2013, were also included in the study. As a result, MR images of a total of 35 patients (9 males and 26 females; mean age, 52.8 ± 13.4 years; range, 28-79 years) were analyzed in our study. There were 22 patients with myxoid tumors (4 males and 18 females; mean age, 52.8 ± 13.5 years; range, 28-76 years); myxoid liposarcoma was the most common subtype, followed by myxofibrosarcoma, fibromyxoid sarcoma, and others (Table 1). There were 13 patients with BPNSTs (5 males and 8 females; mean age, 52.8 ± 13.9 years; range, 31-79 years), with schwannoma as the most common subtype (Table 1).
MRI Protocol
MRI was performed at 1.5 tesla (T) (Gyroscan Intera; Philips, Best, The Netherlands) using a SENSE Body coil (Philips, Best, The Netherlands) in 7 patients, and at 3.0T (Achieva; Philips, Best, The Netherlands) using a SENSE-XL Torso coil (Philips, Best, The Netherlands) in 11 patients in our hospital. Images from 17 patients, with MRIs done at other hospitals, were taken at 1.5T.
Scans were carried out and images were acquired based on the followings: T1-weighted turbo spin-echo (TSE) axial and coronal scan (repetition time [TR] 450-590 ms/echo time [TE] 7-20 ms at 1.5T and TR 490-600 ms/TE 8-20 ms at 3.0T); T2-weighted TSE axial, coronal, and sagittal scan (TR 3900-7100 ms/TE 90-100 ms at 1.5T and TR 3000-5000 ms/TE 80-120 ms at 3.0T); T2-weighted spectral attenuated inversion recovery TSE axial scan (TR 2000-6600 ms/TE 70-100 ms at 1.5T and TR 1700-8300 ms/TE 50-70 ms at 3.0T); and enhanced T1-weighted fat saturation (FS) and axial, coronal, and sagittal scan (TR 450-590 ms/TE 7-20 ms at 1.5T and TR 490-580 ms/TE 9-20 ms at 3.0T). Slice thickness and field of view (FOV) were as follows: slice thickness 3-7 mm, inter-slice gap 0-1 mm, and FOV, 100 × 100 - 400 × 400 mm. A total of 29 patients underwent contrast-enhancement studies.
Image Evaluation
Two observers (a musculoskeletal radiologist with 11 years of experience in musculoskeletal radiology, and a radiology resident with 3 years of experience) analyzed all MRI data independently. The following tumor characteristics were evaluated: size, margin, degree of SI on T2WI, homogeneity of SI on T2WI, enhancement pattern, enhancement homogeneity, presence of cystic portion, internal fat component, fat split sign, target sign, continuation with adjacent neurovascular bundle, and surrounding halo. Size was measured only once by one observer. All other characteristics were evaluated once by each observer, and after the initial analysis, the two observers underwent a consensus meeting for discordant results, in order to provide a single final dataset.
Size was measured using the longest diameter of the tumor. The margin was assessed using a 2-point scale (well-defined; ill-defined). The degree of SI on T2WI was determined using a 2-point scale compared to that of the adjacent muscle (low; high). Homogeneity of SI on T2WI was also evaluated using a 2-point scale (homogeneous in the case of more than a half-portion of the lesion; homogeneous in the case of less than half). The enhancement pattern was divided using a 3-point scale (no enhancement; peripheral enhancement; solid enhancement), and homogeneity of enhancement was divided using a 2-point scale (more than half of the lesion was homogeneous; less than half was inhomogeneous). The presence of cystic portions, internal fat component, fat split sign, target sign, continuation with adjacent neurovascular bundle, and surrounding halo were rated using a 2-point scale (absent; present). A cystic portion was defined as a high SI portion on T2WI without internal enhancement. The presence of an internal fat component was evaluated by means of high SI foci on T1WI and a signal drop after fat suppression. A target sign was deemed to be present when the tumor showed central low SI and peripheral high SI on T2WI (19). The fat split sign was defined as a rim of fat surrounding the tumor (20). Continuation with adjacent neurovascular bundle was positive when the tumor showed unclear margins with an adjacent nerve in any sequence. In the present study, surrounding halo was defined as a peritumoral high SI outside the lesion on T2WI or on enhanced T1WI.
Statistical Analysis
The association between tumors and variables (margin, degree of SI, on T2WI homogeneity on T2WI, enhancement pattern, enhancement homogeneity, presence of fat split sign, target sign, continuation with adjacent neurovascular bundle, internal fat component, cystic portion, and surrounding halo) were analyzed using Pearson chi-square analysis. The size was compared between the two groups using a t-test. A P-value of < 0.05 was considered a statistically significant. A statistical analysis of the calculations was performed using Stata 10.0 (Stata Corp, College Station, TX, USA).
RESULTS
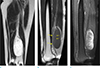
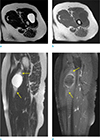
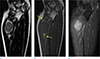
The myxoid tumors were significantly larger than the BPNSTs (mean maximal diameter was 7.27 ± 3.67 cm for the myxoid tumors versus 4.46 ± 3.46 cm for the BPNSTs; P = 0.032). The MRI characteristics are listed in Table 2 to facilitate the comparison between the two tumor groups. There were significant differences between the two groups regarding the degree of SI on T2WI, enhancement homogeneity, inner fat component, fat split sign, and target sign. High SI on T2WI, heterogeneous enhancement, and internal fat component were more commonly observed in myxoid tumors (Figs. 1 and 2). Homogenous enhancement, fat split sign, and target sign were more commonly seen in BPNSTs (Fig. 3). However, other findings, such as margins, homogeneity of SI on T2WI, enhancement pattern (peripheral or solid), internal cystic portion, continuation with neurovascular bundle, and surrounding halo, did not show significant differences between myxoid tumors and BPNSTs.
DISCUSSION
Large size, high SI on T2WI, heterogeneous enhancement, and internal fat component were more commonly observed in myxoid tumors, while homogenous enhancement, fat split sign, and target sign were more commonly seen in BPNSTs, all showing a significant difference between tumor types. Other findings, such as margins, homogeneity of SI on T2WI, enhancement pattern (peripheral or solid), internal cystic portion, continuation with neurovascular bundle, and surrounding halo, did not show significant difference between myxoid tumors and BPNSTs.
It has been reported that myxoid tumors often show high SI on T2WI, which may correspond to the myxoid contents (810). BPNSTs have also demonstrated high SI on T2WI, which may correspond to the nonfibrillary tissue or myxoid material in previous studies (1131518). Our study reported that myxoid tumors show high SI on T2WI more frequently than BPNSTs do; no recent studies have reported on a comparison of SI on T2WI between these tumor groups. We suggest that there might be larger amount of the myxoid contents in myxoid tumors than in neurogenic tumors which contribute to the higher SI on T2WI. Further studies are needed with pathologic correlation.
BPNSTs can show typical central enhancement and myxoid tumors can show heterogeneous solid enhancement, but it was previously reported that the enhancement pattern cannot be used for the differential diagnosis due to the wide spectrum of enhancement in both myxoid tumors and BPNSTs (8910). In our study, myxoid tumors showed heterogeneous enhancement more often than BPNSTs did, but in terms of enhancement pattern (peripheral vs. solid), there was no significant difference between the tumor types. In myxoid tumors, the mixture of enhancing solid portions and non-enhancing myxoid components may contribute to the heterogeneous enhancement feature on MRI.
High SI foci on T1WI suggested that internal fat is usually present in myxoid liposarcomas, but this was not reported in other myxoid tumors such as myxofibrosarcomas (817). In our study, internal fat components were more common in myxoid tumors than in BPNSTs. This is probably due to the high incidence (40.9%) of myxoid liposarcomas in the myxoid tumor group in our study.
Fat split sign, target sign, and continuation with neurovascular bundle have been described as common findings of peripheral nerve sheath tumors in previous studies (1111315181920). Although the fat split sign was significantly more common in BPNSTs in our study, 11 out of 22 myxoid tumors also showed the fat split sign. In fact, this sign can be easily seen in all the soft-tissue tumors located in intermuscular areas (23). It was previously reported that a fat rim can be observed in the focal type of myxofibrosarcoma (8), which may also be counted as the presence of a fat split sign.
Target sign has been described as pathognomonic for BPNSTs (1). The fibrocollagenous tissue in the central portion contributes to the low SI area, and the surrounding more myxomatous tissue contributes to the high SI area (111). In our study, the target sign was more commonly seen in BPNSTs than in myxoid tumors, which is consistent with previous studies. Although myxoid tumors also have myxomatous tissue within them, they usually lack the fibrocollagenous tissue in the central portion, which explains the absence of target sign in myxoid tumors.
In terms of continuation with neurovascular bundle, there was no significant difference between myxoid tumors and BPNSTs in our study. If the tumor size is large, the possibility of being located adjacent to a neurovascular bundle increases, and this situation can be misunderstood as the presence of continuation with the neurovascular bundle. Our study showed that the size is significantly larger in myxoid tumors than in BPNSTs, which may explain this finding.
It has been reported that the margin is infiltrative, focal, multi-nodular, and lobulated in malignant myxoid tumors, such as myxofibrosarcomas (89). Kaya et al. (12) reported on a myxofibrosarcoma that featured a predominant infiltrative growth pattern extending along the fascial planes with high SI on T2WI. Other studies have reported different findings, namely that the tumor borders were always clearly distinguishable or sharply defined in 30 cases of myxoid liposarcoma (14). A previous study has reported that 13 cases (59%) of intramuscular myxoma showed a circumscribed margin (23). In BPNSTs also, previous studies have reported the margins to be well-circumscribed (13). In our study, both myxoid tumors and BPNSTs showed well-defined features more commonly than ill-defined margins. The inclusion of myxoid liposarcoma (9 cases, 40.9%) and intramuscular myxomas (3 cases, 13.6%) in myxoid tumors in our study may be a factor in this result (Table 1).
It has been reported that BPNSTs show heterogeneous SI on T2WI due to disordered histologic distribution of their various contents; collagen fibers, high cellular components, nonfibrillary stromal/myxoid material, etc. (1315). In myxoid tumors, the solid and myxoid components demonstrate high SI on T2WI, with the myxoid component having higher SI which is similar to that of fluid, and internal septations show low SI on T2WI (810). Thus, based on previous studies, both tumor groups may show heterogeneous SI on T2WI due to their contents. In our study, many cases in both tumor groups showed heterogeneous SI on T2WI; no significant difference was noted in the homogeneity of SI on T2WI between myxoid tumors and BPNSTs.
Large-sized tumors often have an internal cystic portion (132425). In our study, although the mean size was significantly larger in myxoid tumors than in BPNSTs, there was no significant difference in the presence of internal cystic portions between the two tumor groups.
Although perilesional edema was previously reported in myxoid liposarcoma (9) and myxoma (23), it has not been reported in BPNSTs. Incomplete formation of peritumoral pseudocapsule permits the leakage of mucoid material from tumors to adjacent muscle, resulting in muscular atrophy with increased fat deposition causing the perilesional edema (23). In our study, we expressed this imaging finding as a "surrounding halo", and there was a tendency for myxoid tumors to more commonly have such halos; however, there was no significant difference between the two tumor groups. This may be due to the small size of our study group. In addition, fat split sign in BPNSTs, which show peritumoral high SI on T2WI, may have been misunderstood as surrounding halo in our study.
There are several limitations in our study. First, it was a retrospective, single-center study, so there may be a selection bias due to the relatively limited number of patients. Second, although there are many heterogeneous cases of myxoid tumors, only limited subtypes were included in the myxoid tumor group in our study, which may have influenced the results.
In conclusion, in the differential diagnosis of myxoid tumors and BPNSTs involving the musculoskeletal system, several MRI findings, such as degree of SI on T2WI, enhancement homogeneity, internal fat component, fat split sign, and target sign, may be helpful.
 XML Download