

 PDF
PDF ePub
ePub Citation
 Print
Print


INTRODUCTION
Developmental venous anomalies (DVAs) of the brain are frequently encountered on contrast-enhanced (CE) CT or MR imaging. They are regarded as normal variants of the cerebral venous development and are usually asymptomatic (1234). However, it has been reported that MR signal abnormalities in the adjacent brain parenchyma could be associated with DVAs (56). Venous congestion or infarction due to stenosis, or occlusion of the collecting vein, may cause parenchymal signal abnormalities in the drainage area of a DVA (1256). Sometimes, a DVA can also be associated with a cavernous angioma (CA), also referred to as a mixed angioma. CAs are usually manifested as hemorrhagic foci. When DVAs are associated with CAs, they can also show parenchymal signal abnormalities due to the hemorrhagic lesions of the CAs (78910).
Susceptibility-weighted imaging (SWI) is a highly sensitive MR sequence for the detection of hemorrhage (11121314). Recent reports show that SWI is more sensitive in detecting hemorrhagic foci in CAs than the T2-weighted and conventional gradient echo (GRE) images (15). However, there have been few reports in which authors have used SWI for the evaluation of parenchymal signal abnormalities in DVAs (16). If we can find more hemorrhagic lesions in DVAs, it would help us to better understand the pathophysiology of parenchymal signal abnormalities associated with DVAs. The purpose of this study was to evaluate the associated brain parenchymal abnormalities of DVAs with SWI.
MATERIALS AND METHODS
Patient Population
This retrospective study was approved by our Institutional Review Board. Informed consent was waived.
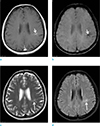
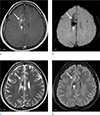
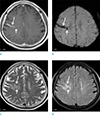
From January 2012 to June 2013, 2356 consecutive patients underwent brain MR examinations with SWI and CE study. A retrospective review of their MR imaging identified DVAs in 57 patients (2.4%) on CE T1-weighted images. There were 32 male and 25 female patients, aged 19 to 92 years (mean, 59.1 years). The criteria used to establish the diagnosis of DVA are based on MR imaging findings, especially on CE T1-weighted images. DVAs are characterized by a cluster of venous radicles that converge into a collecting vein, resulting in the typical 'caput medusae' appearance (Figs. 1, 2, 3).
MR Imaging
All MR examinations were performed on a 1.5 Tesla (T) MR scanner (MagnetomAvanto, Siemens Medical solution, Erlangen, Germany). Our MR protocol consisted of T2-weighted imaging, fluid-attenuated inversion recovery (FLAIR), SWI, T1 and CE T1-weighted imaging (Table 1). SWI was acquired using a full velocity-compensated, three-dimensional, GRE sequence having the following parameters: repetition time (TR) = 48 ms; echo time (TE) = 40 ms; flip angle (FA) = 15; bandwidth = 80 kHz; slice thickness = 2 mm, with 64 slices in a single slab; matrix size = 256 × 168. The acquisition time was 3 minutes and 7 seconds, with the use of iPAT factor 2. All images were obtained in the same axial plane. Subsequently, 2-mm minIP images were generated. The sequence, along with the entire image processing, was automated on a Siemens MR scanner platform. The SWI and minIP images were uploaded and made available on the picture archiving and communication (PACS) system.
Image Analysis
The MR examinations were reviewed in detail by two radiologists. One radiologist had an added qualification in neuroradiology and 15 years' experience in evaluating brain MR imaging; the other radiologist had three years of experience interpreting and assessing MR images. Data were collected with respect to the following: the location of DVA, the associated increased signal intensity, and the associated hemorrhage in the drainage area of DVA on FLAIR, T2-weighted images, and SWI. The drainage territory was defined as the brain parenchyma directly adjacent to the visualized radicles of the DVA. Signal intensity alterations adjacent to the DVA were defined as increased extravascular signal intensities within the directly subjacent brain parenchyma. We were careful not to include signal intensity within the visible vascularity of the DVA, as commonly identified on FLAIR imaging. Imaging findings were determined by consensus of both the radiologists.
RESULTS
Of the 2356 patients examined, we identified 57 DVAs in 57 patients (2.4%). Based on their location, 47 DVAs (82.4%) were in either lobe of the supratentorial brain, 9 (15.7%) were in the cerebellum, and 1 (1.7%) was in the pons.
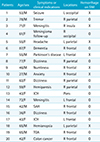
Of the 57 DVAs identified, 20 (35.1%) had associated parenchymal abnormalities in the drainage area (Table 2) (Figs. 1, 2, 3). Among the 20 DVAs having associated parenchymal abnormalities, 13 (65%) showed hemorrhagic foci on SWI (Figs. 2, 3) and 7 (35%) demonstrated only increased parenchymal signal abnormalities on T2-weighted and FLAIR images (Fig. 1). In 5 (38.5%) of the 13 patients who had hemorrhagic foci, the hemorrhagic lesions were demonstrated only on SWI (Fig. 3). In the remaining 8 patients, although both T2-weighted images and SWI showed the hemorrhagic foci as signal void lesions, they were more prominently demonstrated on SWI than on T2-weighted images (Fig. 2).
DISCUSSION
Cerebral vascular malformations are classified into four categories: arteriovenous malformation, capillary telangiectasia, DVA, and CA (12). Of these, DVA is the most common, with a 2.6% incidence seen in 4069 brain autopsies (3). In our study, DVAs were demonstrated in 57 (2.4%) of the 2356 patients, which is similar the previous reports (34).
In the present study, parenchymal signal abnormalities were associated in 20 (35.1%) of the 57 DVAs. Previous reports have been variable for the incidence of parenchymal signal abnormalities associated with DVAs (561617), ranging from 12.5% to 54.1%. The reason for this variability may be related to differences in the patient population, inclusion and exclusion criteria, and sample size. Different machines and scanning parameters of the studies may also be a factor.
Venous hypertension due to thrombosis or stenosis of the collecting vein is the underlying mechanism leading to symptomatic infarction or asymptomatic parenchymal signal abnormalities in DVAs (1256). In cases of no demonstrable stenosis, partial thickening of the veins forming the DVA may also contribute to the development of venous hypertension, by reducing the size and compliance of the vessel lumen, increasing the resistance to flow, and diminishing the vessel's capacity to adapt to pressure modifications (1). In a recent study that evaluated diffusion and perfusion-weighted MR imaging in patients with parenchymal signal abnormalities associated with DVAs, the signal abnormalities around DVAs showed increased ADC, increased cerebral blood volume, and delayed mean transit time and time-to-peak, as opposed to those of the contralateral normal portions. They concluded that the parenchymal signal abnormalities associated with DVAs were caused by vasogenic edema with congestion and delayed perfusion (17).
In the past, DVAs were thought to be rare lesions that were associated with intracerebral hemorrhage (1819). Since the advent of MR imaging, it has been reported that DVAs were relatively prevalent and were associated with a relative risk of hemorrhage. The hemorrhagic lesions associated with DVAs are attributed to coexistent CAs. However, they may also be caused by venous infarction secondary to DVA thrombosis in the absence of a coexisting CA (1).
SWI is a high-spatial resolution, three dimensional, GRE MR technique, which maximizes sensitivity to magnetic susceptibility effects (1314). Deoxygenated blood products (deoxyhemoglobin, methemoglobin, and hemosiderin), being paramagnetic with four unpaired electrons, generates magnetic fields that are additively combined with the external magnetic field (131420). SWI uses paramagnetic deoxyhemoglobin in the cerebral vein as an intrinsic contrast agent; this is useful for the demonstration of the cerebral venous anatomy (1321). Because DVA is a normal variation of the transmedullary vein, it usually shows similar flow velocity and deoxyhemoglobin concentration as the normal cerebral vein. On SWI, DVA is demonstrated as a signal void lesion with the normal cerebral veins. In our study, SWI was useful for the demonstration of DVA itself as well as associated hemorrhage (Figs. 1, 2, 3). Among the 13 patients who had hemorrhagic foci, 5 (38.5%) showed the hemorrhagic lesions only on SWI (Fig. 3). In the remaining 8 patients, although both T2-weighted images and SWI showed the hemorrhagic foci as signal void lesions, they were more prominently demonstrated on SWI than on T2-weighted images (Fig. 2).
In our study, hemorrhagic foci were detected in 13 (22.8%) of the 57 DVAs on SWI (Table 2) (Figs. 2, 3). In a recent study of Takasugi et al. (16), hemorrhagic lesions were observed in 62.3% of DVAs on SWI. The discrepancy in our results and those of Takasugi et al. (16) might be due to several factors. First, our patients were scanned using a 1.5T MR machine, whereas Takasugi's group used a 3T scanner. Susceptibility effect in higher field strength increases the conspicuity of paramagnetic substances. Second, the method of patient selection was different. We retrospectively reviewed all brain MR examinations which were undertaken during the study period. However, they selected their patients from the data base of MR imaging reports. In a routine clinical practice, it tends to be that a subtle, small, or uncomplicated incidental DVA might not be mentioned in a MR imaging report, which might work as a selection bias.
In conclusion, the incidence of DVAs was 2.4%, having associated parenchymal abnormalities in 35.1% of the cases. On SWI, hemorrhage was detected in 22.8% of DVAs. We are of the opinion that SWI might give a potential for understanding the pathophysiology of parenchymal abnormalities in DVAs.

 XML Download