

 PDF
PDF ePub
ePub Citation
 Print
Print


INTRODUCTION
The development of an intracranial hemorrhage (and its evolution) is a dynamic process, depending on the physiologic and magnetic property of the hemoglobin. Generally, five stages of hemorrhage are widely accepted by the status of hemoglobin: hyperacute (intracellular oxy-hemoglobin); acute (intracellular deoxy-hemoglobin); early subacute (intracellular met-hemoglobin); late subacute (extracellular met-hemoglobin); and chronic (ferritin and hemosiderin) (12). Differentiation between those stages of hemorrhage could be achieved by the combination of the T1- and T2-weighted images (3). Gradient echo T2* weighted images (GRE) were previously known to be sensitive, in the detection of intracranial hemorrhages. The recently applied susceptibility-weighted image (SWI) has shown better sensitivity and specificity than GRE, for detection of intracranial hemorrhages (4). Phase imaging from the SWI is also informative, in regard to differentiating the hemorrhage from calcification, by means of the opposite direction of the phase value between them (567). We hypothesized that the findings of an intracranial hemorrhage on the phase images would be different, according to the stage, location, and size, because the phase value is proportional to the paramagnetic property of the hemorrhage. To the best of our knowledge, findings of an intracranial hemorrhage on the phase images have not been evaluated in accordance to its stage, location, and size. Therefore, the purpose of this study was to assess and describe the findings of intracranial hemorrhages on phase images.
MATERIALS AND METHODS
Patient Population
The Institutional Review Board approved this retrospective study, and waived the patient consent. Patients with intracranial hemorrhages were searched, using an electronic medical database, between March 2012 and December 2013. Among these, the number of patients who underwent both an MRI (including SWI) and computed tomography was 105. Patients who had previous history of hemorrhagic stroke, vascular malformation, ruptured cerebral aneurysm, and other causes of intracranial hemorrhage were excluded from the analysis (n = 5). Patients with poor image quality of phase images were excluded from the analysis (n = 5). Finally 95 patients, with first onset intracranial hemorrhage, were included in this study.
Acquisition of MRI and Generation of SWI and Phase Image
Susceptibility-weight images were taken using a 3.0 T MR system (Verio, Siemens Medical Solutions, Erlangen, Germany). SWI acquisition was performed with a 3-dimensional gradient echo sequence, with FA = 15°; TR/TE = 28/20 msec; FOV = 173 × 230 mm; matrix size = 194 × 256; slice thickness = 2 mm; and voxel size = 0.9 × 0.9 × 2 mm. After obtaining both the magnitude and phase images, post-processing of the magnitude and phase images were performed in an MR console. Briefly, a phase image was generated after unwrapping the phase images by applying a high pass filter. Then, a phase mask was generated, and multiplied to the fourth power with the magnitude image, to generate the SWI. The phase image was a left-handed system, where the hemorrhage presented a hyper-signal intensity and the calcification presented a hypo-signal intensity on the phase images. The acquisition time for the SWI took less than 4 minutes and 30 seconds. Conventional sequences (T1-weighted image and T2-weighted image) were acquired to classify the stage of the hemorrhage.
Classification of Intracranial Hemorrhage
Stages of hemorrhage
The electronic medical record was reviewed by a 3-year trainee resident. The acute stage was defined as occurring within 3 days after the symptom onset of intracranial hemorrhage. The early subacute stage was defined as occurring between 4 to 7 days after symptom onset. The late subacute stage was defined as occurring between 8 to 21 days after symptom onset. The chronic stage was defined as occurring over 21 days after symptom onset. A neuroradiologist with 10 years of experience confirmed the hemorrhage by the dark blooming lesion on the T2*-weighted gradient echo, and correlated the stages of the hemorrhage by their characteristic appearances on T1- and T2-weighted images (8). The signal intensity on the phase images were described by hyper-, iso-, and hypo-signal intensities, compared to that of brain parenchyma. A pre-contrast CT was used to confirm whether the lesions on the phase image were hemorrhages or calcifications. Calcification was defined by the hyperdense (Hounsfield unit > 140) lesion on the pre-contrast CT. The interval between the MRI and the CT was within 3 days.
Location of Hemorrhage
The neuroradiologist and the trainee radiologist, with 10 years and 3 years of experience respectively, classified them into 3 categories with consensus: subarachnoid hemorrhage; parenchymal hemorrhage; and subdural hemorrhage or epidural hemorrhage.
Size of Hemorrhage
Detection of the hemorrhage was performed using the SWI, which is considered sensitive enough to identify tiny hemorrhages (presented as a dark blooming signal). After reviewing several slices, above and below the parenchymal hemorrhage, the longest diameter of hemorrhage was measured using axial magnitude images. Magnitude images were considered most reliable for measuring the size of the hemorrhage, because the voxel size of the magnitude image was smaller than the T1- and T2- weighted images, and less affected by the susceptibility effect than the SWI. The trainee radiologist measured the longest diameter by means of using a one-directional long axis on the PACS (picture archiving communication system).
RESULTS
Stage of Hemorrhage
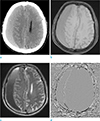
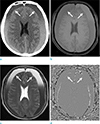
A total of 95 patients with intracranial hemorrhages were classified into 4 groups: 34 cases were acute, 11 were early subacute, 15 were late subacute, 8 were chronic; in addition, there were some stage-unknown microbleeds (n = 27). All stages of hemorrhages were detected as a dark signal intensity, with blooming, on the SWI. In the acute and early subacute stages, the middle of the hemorrhage slices were heterogeneously hyper-, iso-, and hypo-signal intensities on the phase images (Fig. 1). This heterogeneity of phase might come from heterogeneous distribution of oxy-, deoxy-, and met-hemoglobins. The upper and lower slices of the hemorrhage were homogeneously hyper-signal intensity; this phenomenon could be explained by the paramagnetic dipole artifact (9). The late subacute stage of the hemorrhages was demonstrated by the homogeneous hyper-intensity on the phase images, which could be explained by the homogeneously distributed extracellular met-hemoglobins (Fig. 2). The chronic stage of the hemorrhages was depicted by a shrunken iso-signal intensity with a hyper-signal rim, which could be explained by the resolution of the hemorrhage with the hemosiderin rim.
Location of Hemorrhage
1. Subarachnoid hemorrhage (SAH)
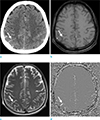
All cases of SAH were due to the rupture of intracranial aneurysms (n = 1), or traumatic brain injuries (n = 20). The findings of the SAH were observed as being sulcal or cisternal high density on the pre-contrast CT and as a dark signal on the SWI (10). Thin SAH was expressed by a homogeneous hyper-signal intensity on the phase images (Fig. 3). However, a thick portion of the SAH showed mixed hyper- and hypo-signal intensities, due to an aliasing artifact on the phase images.
2. Brain parenchymal hematoma
The Parenchymal Hematoma Were Due To Hypertension (n = 123), Contusion (n = 22), Or Rupture Of A Vascular Malformation (n = 1). There Were No Cases Resulting From Tumor Bleeding. Parenchymal Hematomas Were Demonstrated By Three Patterns: Heterogeneous Hyper-, Iso- And Hypo-signal Intensity With A Dipole Artifact, Homogeneous Hyper-signal Intensity With A Dipole Artifact, And Homogeneous Hyper-signal Intensity Without A Dipole Artifact (Depending on the size of hematomas).
3. Subdural hemorrhage (SDH) or epidural hemorrhage (EDH)
Subdural hemorrhages (SDH) were found in 11 cases, and epidural hemorrhages (EDH) were found 2 cases. The signal intensities of the SDH and EDH on the phase images were found as being of similar appearance on the phase images. The shapes of the SDH and EDH had extra-axial crescent and biconvex appearances, with stage-compatible signal intensities on the phase images.
Size of Hemorrhage
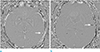
A total of 146 parenchymal hemorrhages were divided into 3 groups according to their size: those greater than 5 mm (n = 56), those ranging from 3 mm to 5 mm (n = 36), and those less than 3 mm (n = 55). The slice thickness of the SWI was 2 mm; therefore smaller hemorrhages (< 3 mm) - compared to the slice thickness - showed homogeneous hyper-signal intensity (Fig. 4A). Larger hematomas showed a heterogeneous mixture of hyper-, iso-, and hypo-signal intensities. The signal intensity in the upper and lower slices of the hematoma showed hyper-signal intensity, due to the paramagnetic dipole artifact (11). The middle slices of the hematomas showed a homogeneous hypo-signal intensity (3-5 mm; Fig. 4B) and a heterogeneous mixture of hyper-, iso- and hypo-signal intensity (> 5 mm).
DISCUSSION
SWI is very sensitive to blood products, and can provide additional phase information (12). A combination of T1-, T2-, and T2*-weighted images can be used to differentiate between the stages of hemorrhages. However, descriptions of the various intracranial hemorrhages on the phase image have not been reported previously. To the best of our knowledge, this study was the first to describe findings of the phase image, according to the stage, location, and size of the intracranial hemorrhage.
Each stage shows a different susceptibility to sequential degradation of the hemoglobin. Extravasated oxy-hemoglobluin evolves to deoxy-hemoglobin, met-hemoglobin, and hemosiderin in time (8). Theoretically, the evolution of hemoglobin products results in higher susceptibility, so its signal on the phase image can be expected increase sequentially. However, the inhomogeneous distribution of those hemoglobin products makes heterogeneous mixed hyper-, iso-, and hypo-signal intensities in the acute and early subacute stages. The phase images, post-processed by recent techniques might have limitations because the current dipole inversion of hematomas is imperfect. In the late subacute stage, homogeneous distribution of extracellular met-hemoglobin caused more homogeneous high-signal intensities on the phase images. In the chronic stage, the shrunken parenchyma surrounded by hemosiderin was demonstrated, as we expected. Conventional MR sequences, such as the T1- and T2-weighted images, can predict signal changes in the parenchymal hemorrhage consistently. However, the prediction of the signal change is inconsistent for the EDH, SDH and SAH on the conventional MR sequences. Similar limitations were observed on the phase images.
Recent studies on the phase image of traumatic SAH showed a heterogeneous aliasing pattern on the phase image (10). Our study showed a similar pattern on the phase image, in the case of a thick portion of the SAH. However, most of the thin portion of the SAH showed homogeneous hyper-signal intensity on the phase image, without aliasing. Aliasing can also be caused by other reasons, such as bone-tissue interfaces, air-tissue interfaces, and the calcification of the tentorium or falx. Careful interpretation should be performed on hemorrhages near the skull base, falx, tentorium, and convexities.
A dipole artifact was found in hemorrhages that were 3 mm and larger than 3 mm in size. The phenomenon could be understood as an imperfect dipole inversion of paramagnetic susceptibility (13). In our study, because we used left-handed phase images, the upper and lower slices of hematomas showed hyper-signal intensities. If a right-handed system was used, the opposite hypo-signal intensity would be demonstrated on the phase images. In contrast, smaller hemorrhages (less than 3 mm) showed a relatively homogeneous hyper-signal intensity on phase images (14).
Our study had several limitations. First, this study is retrospective, in regard to the nature of the analysis. As for the SAH, all of the cases were in the acute stage. Therefore, the evolution of SAH on the phase image could not be assessed on this study; as such, further study should be undertaken. Second, the dates of the CT and MR acquisition were different in most cases. It was possible to change during the transition between acute and subacute stages, or early and late subacute stages; however, the interval between the two modalities was relatively narrow (within 3 days), and hematoma evolution could only be relatively little during this short period. Third, the dipole inversion was not performed on the post-processing of the phase images. An accurate dipole inversion could provide less aliasing of susceptibility, and more quantitative phase information.
In conclusion, all hemorrhages showed a blooming dark signal on the SWI. However, the phase images showed different appearances, according to the stage, location, and size of the hemorrhages. These findings on the phase images could provide more information about the various intracranial hemorrhages.
 XML Download