

 PDF
PDF ePub
ePub Citation
 Print
Print


INTRODUCTION
Major depressive disorder (MDD) is a typical and serious mental disorder such that lifetime prevalence reaches up to 16%, and 12-months prevalence is about 6.6%, and present various symptoms, including behavioral, cognitive, and emotional manifestations (1, 2, 3). The associations between the low emotional regulation which is the key feature of depressed patients and the structural changes such as the orbital and medial prefrontal cortices, amygdala, hippocampus, and related parts of the striatum and thalamus of MDD's brain have been proposed (4, 5, 6, 7, 8).
The rapid development of novel MR imaging techniques and analyses methods has made it possible to apply neuromorphometry for the investigation of regional abnormalities in patients with MDD. There were previous MR-based studies reporting structural abnormalities in patients with MDD. Those investigations mainly focused on certain brain areas (e.g., deep gray matters, limbic and paralimbic brain circuits, including the hippocampus), which were assumed to play key roles in the development of symptoms in affective disorder (4, 5, 6, 7). Most of MRbased volumetry studies, however, have been performed using manual estimation of specific brain regions, with inevitable limitations due to measurement bias. Voxel-based morphometry (VBM) is a fully automated imaging analysis technique, thus provides objective information regarding brain tissue concentration or regional volume changes of gray matter, white matter, and cerebrospinal fluid (CSF) respectively with minimal operational bias (9). VBM has been proved useful to reveal brain abnormalities in various neuropsychiatric diseases such as schizophrenia (10), major depressive disorder (8, 11, 12, 13), and obsessive compulsive disorder (14).
Several VBM studies in patients with MDD have reported differences in gray matter volume (GMV) and concentration (GMC) compared to healthy controls with contradictory results (11, 12, 13), which could be partly explained by heterogeneity of patient groups. Structural changes the brain in patients with MDD could be affected by diverse factors such as age of onset, sex, previous number of depressive episodes, duration of illness, and antidepressant medication. Of particular note, there are studies that amygdala and hippocampus, whose volume typically decreased in patients with MDD, show a volume increase after antidepressant medications (15, 16). To reduce sexual dimorphism in MDD pathophysiology such as certain infectious and autoimmune diseases, we included only female subjects in this study (17).
The purpose of this study is to evaluate the difference in structural abnormalities between the patients with MDD and non-depressed normal controls by optimized VBM, and additionally the relationship between the regional GMV and clinical variables.
MATERIALS AND METHODS
Subjects
Twenty female patients with major depressive disorder (age, mean ± SD: 42.3 ± 10.20, range: 17-56 years) were recruited from the department of psychiatry at our Hospital. The mean age of the first depressive episode was 31.8 (±13.1), the mean number of lifetime depressive episodes was 7.1 (±9.12), and mean illness duration was 114 (±135.5) months.
In addition, 21 female normal control subjects (age, mean ± SD: 42.45 ± 13.95, range: 24-58 years), group-matched to patients on age, handedness, and parental socioeconomic status, were recruited from the community, and these normal subjects did not have any neuropsychiatric diseases. This study was approved by the local institutional review board of our Hospital, and all subjects provided written informed consent prior to study participation.
Patients were included if they met criteria for major depressive disorder based on the structured clinical interview (SCID) for DSM-IV (18). Depressive symptoms were assessed by means of Beck Depression Inventory (BDI; 19) and the 17-item Hamilton Depression Rating Scale (HDRS; 20). Both SCID and HDRS were administered by an experienced psychiatrist.
Patients were excluded from the study if they had a history of childhood trauma or other major Axis I disorders, including bipolar disorder, schizophrenia, schizoaffective disorder, claustrophobia, and current or past history of alcohol or substance abuse or dependence. However, patients with underlying dysthymic disorder, i.e., double depression, or panic attacks in the context of MDD were included.
None of patients were on antidepressant medication at least three months before the MRI scanning. None of the patients were taking antipsychotics or mood stabilizers. Control subjects had no past history of any Axis I disorders and no family history of Axis I disorders. None of both patients and control subjects had been exposed to a serious traumatic event enough to cause PTSD. Subjects were also excluded if they had major medical or neurological illness, a history of significant head trauma, treatment with ECT, exposure to oral or intravenous steroids, contraindications to magnetic resonance imaging (MRI), or an IQ of less than 80.
MRI acquisition
All the subjects were scanned with a 1.5T scanner (Gyroscan ACS-NT; Philips Medical Systems, Best, The Netherlands). For the consistent head positioning of individuals, the pilot images of coronal, sagittal, axial fast filed echo T1 MRIs were acquired using scanning variables of 10 mm in thickness, 10 mm in gap, a repetition time/echo time (TR/TE) = 15/5.2 ms, matrix = 256 × 256, field of view (FOV) = 25 × 25 cm, 3 slices in each orientation, and a flip angle of 20°. By the guide of pilot images, coronal 3-D T1-weighted turbo field echo MRI was obtained with scanning variables of 1.3-millimeters (mm) in thickness, no gap, 160 slices, 10 minutes 13 seconds scanning time, TR/TE = 10/4.3 milliseconds (msec), 1 a number of signal averages (NSA), matrix = 256 × 256, field of view = 220 × 220 millimeters (mm), 160 slices, a 8° flip angle. Coronal slices were obtained perpendicular to the long axis of the anterior commissure to the posterior commissure in the midsagittal pilot. All subjects were scanned with a same MRI scanner and same MRI parameters.
Intracranial volume measurement
The intracranial cavity volumes (ICV) of all subjects were manually traced using Unix based Sun Ultra 1 Creator workstation (Sun Microsystems, CA, USA), and Analyze 7.5™ (Biomedical Imaging Resource, Mayo Foundation, Rochester, MN). ICV represents the size of the brain at maximal maturity unaffected by age and disease related atrophy, so ICV was utilized for normalization of the gray or white matter volumes (21), and to correct the variations of premorbid individuals' brain size for the VBM with modulated images.
The raw coronal T1-weighted MRIs were reconstructed to sagittal images of 5-mm thickness, which were then magnified two times. The cerebrum, cerebellum and midbrain were included for the ICV volume (22). Lateral limits of the ICV was defined as the right- and left-most slices of the brain parenchyma on sagittal images, while the lower tip of the cerebellum as the lower limit. The dura matter of the cerebrum, the cerebellum and the midbrain, except for the inferior boundary, was manually traced. (23). A horizontal line was drawn across the midbrain to include the lower tip of the cerebellum to establish the inferior boundary on the head tilt-corrected sagittal images (24). The MRIs of all 41 subjects were mixed in the same directory without clinical information before the ICV measurements. The intra-rater reliability (ICC) of ICV previously reported (ICC = 0.996).
Voxel-based morphometry
To observe the differences of regional GMV, the optimized VBM (9, 25) was performed. To make T1 template and prior images of gray, white matter, and cerebrospinal fluid (CSF), all MR images of MDD patients and normal controls were spatially normalized to standard T1 (ICBM 152) template. Spatially normalized images were partitioned into the gray, white matter images, and CSF space. The partitioned images were sub-sampled into a voxel size of 2 × 2 × 2 mm. To exclude isolated clusters of one tissue class which were unlikely to be the member of this tissue type, HMRF process was applied to the segmentation processes (26). The spatially normalized raw images, segmented gray, white matter images, and CSF spaces were averaged and saved into the customized T1 template, gray matter, white matter, or CSF prior images, respectively. The customized T1 template and prior images were smoothed using an 8 mm full-width at half-maximum (FWHM) Isotropic Gaussian Kernel (IGK).
The raw T1 MRIs of all subjects were segmented into gray, white matter, and CSF space in native space. The volumes of gray and white matter images were separately calculated. The spatial normalization parameters of all T1 MRIs were estimated by matching individual gray matter with own gray matter template, then the spatially normalized images of raw images were created. Spatially normalized images were segmented using HMRF operation (26) and own prior images. The spatially normalized gray or white matter images were modulated by the Jacobian determinants calculated in the process of spatial normalization. 8 mm FWHM IGK was applied to improve signal-to noise ratio and the normal distribution of tissue signal. The final voxel sizes of segmented gray matter images were 1 × 1 × 1 mm.
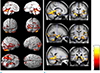
Coordinates were defined by the Montreal Neurological Institute (MNI) coordinate system and the cluster regions of decreased GMV were named by the atlas of Henri M. Duvernoy (27). The averaged T1 MRI created using the all subjects of this study was used as the template in the figures, and the images were displayed in neurological views.
Statistics
Statistical analyses were performed with SPSS 18 (SPSS Inc. USA). The differences of clinical variables, ICV, and the total volumes of gray or white matter between the normal controls and the MDD patients were tested using t-test. To correct the effects of age and ICV, the analysis of covariance (ANCOVA) were also performed in the between group comparisons of the clinical variables and the total amount of gray or white matter. All tests were two tailed, and the level of significance was P < 0.05.
In the VBM analysis, ANCOVA with ICV and age as covariates was performed for the GMV analysis representing regional volume change. The partial correlation analysis (controlled for age and ICV) between the regional GMV and clinical variables (onset age of depressive episode, number of depressive episode, illness duration, BDI, and HDRS) and between the total volume of GM or WM and clinical variables were also performed. The mask of brain parenchyma was applied for the VBM analysis and the level of absolute threshold was strictly set to 0.2 to exclude the areas of gray matter-CSF junction. To correct for multiple comparisons, the results were corrected using a false discovery rate (FDR) correction at P < 0.05 level (28). The clusters were excluded when their size were equal or less than 200 voxels (kE > 200 voxels, 200 mm3).
RESULTS
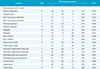
The age distribution was similar between the female normal controls and female MDD patients (two tailed t-test, P = 0.98). The scores of BDI (two tailed t-test, ANCOVA controlled for age, P < 0.0001) and HDRS (two tailed t-test, ANCOVA controlled for age, P < 0.0001) of MDD patients were significantly higher than those of the normal controls, and the scores of BDI and HDRS indicate the MDD patients were in the state of moderate depression (Table 1).
The absolute amount of GM (two tailed t-test, P = 0.19), WM (two tailed t-test, P = 0.55), and ICV (two tailed t-test, P = 0.57) did not differ between the two groups. After controlling for age and ICV, the GM volume of MDD was significantly smaller than that of normal controls (ANCOVA, P = 0.002), but the difference of WM volume between the two groups was not significant (ANCOVA, P = 0.22) (Table 1). The The total volume of GM or WM were not correlated with the clinical variables.
The results of VBM analysis clearly showed the regionally decreased GMV of MDD patients in the areas of the limbic system, including both amygdalae, ambient gyri, hippocampal heads, subiculum (body to tail), posterior parahippocampal gyri, thalami (pulvinar nuclei, dorsal posterior cingulate gyri, and left pregenual cingulate gyrus. The regional GMV of lingual gyri, short insular gyri, right fusiform gyrus, and right inferior frontal gyrus were also decreased in the patients with MDD (all FDR P < 0.05) (Figure 1 and Table 2). However, any correlation was not observed between the regional GMV and clinical variables.
DISCUSSION
The purpose of this study was to show the abnormalities of cortical or subcortical structures, which were related with emotional regulation or production using optimized VBM in the female patients with MDD. The major findings were the reduced total GMV and the decreased regional GMV in the limbic system, including amygdalae, ambient gyri, hippocampal heads, subiculum, posterior parahippocampal gyri, pulvinar nuclei, dorsal posterior cingulate gyri, and left pregenual cingulate gyrus of MDD patients. Our findings were concordant with the hypothesis of the abnormal frontostriatal-limbic neural circuit of MDD (29, 30, 31).
Several VBM studies on MDD have reported the structurally abnormal GM with inconsistent results (8, 11, 32, 33, 34, 35, 36). The reduced GM in the medial part of prefrontal cortex (12), ventral anterior cingulate cortex (vACC) and right amygdala (34), hippocampus, cingulate, thalamus (11), hippocampus, amygdala, gyrus rectus (35), the right dorsolateral prefrontal and orbitofrontal cortices (11), anterior cingulate cortex and inferior orbitofrontal cortex (8), and hippocampus and left temporal cortex (32, 36). These inconsistent results may be partly explained by the heterogeneity of patient groups and the pathophysiological characteristics of MDD. Structural brain changes in patients with MDD could be affected by diverse factors such as the age of onset, gender, the number of depressive episodes, the duration of illness, antidepressant medication, and treatment resistant depression. Since MDD presents the diverse domains of symptoms such as the emotional, motivational, behavioral, and cognitive manifestation, structural abnormalities in multiple areas implicate pathologic patterns of neurotransmission in interconnected neural circuits (30). However, it seems that these diverse results, which were showed structural deficits in the previous studies, were related with limbic and limbic related cortices.
The hippocampal atrophy has been consistently reported in MDD patients (37, 38, 39). This hippocampal atrophy usually observed in patients with multiple past episodes of depression, not in the patients experiencing their first episode of depression (40). The illness duration of MDD was known to the critical factor of hippocampal atrophy (37, 40). We previously reported reduced hippocampal volume and regionally contracted hippocampal shape in the areas of ambient gyrus, basal hippocampal head, posterior subiculum, and dorsal hippocampus in patients with unremitting MDD (39). The result of VBM was showed the reduced GMV in the ambient gyri. Because the ambient gyrus is the junction between the anterior hippocampus and the amygdala, the atrophy of ambient gyri could be interpreted by the abnormal interconnection between the hippocampus and amygdala.
The Stress has been thought to be one of the key factors that damage the hippocampus and strongly suppresses the adult neurogenesis of the hippocampus by increasing glucocorticoid release. The deficit of adult neurogenesis in dentate gyrus is thought to be an important pathophysiological factor of depression (41, 42, 43). We previously explained the possible causes of hippocampal volume reduction by "1) the effect of neurotoxicity induced by the hypersecretion of glucocorticoids may contribute to the neuronal death; 2) the failing adult neurogenesis in the dentate gyrus, which contributes to the weak neuronal projections from the dentate gyrus to CA3 subfield, could be an important causal factor for the deficits in these subfields; 3) the damage to dendrites; and 4) the loss of grail cells" (39).
The regional GMVs of the amygdala and the anterior portion of insular cortex which was related with the emotion production were observed in this study. The atrophy of amygdala in MDD has been well documented (44), and the association between insular cortex and MDD was recently reported (45). The insular cortex plays a key role in emotional and cognitive functions as a component of the limbic integration; in particular, the anterior insular cortex is considered a limbic related cortex. The anterior portion of insular cortex has extensive connections with anterior cingulate gyrus and amygdala (46). Thus the decreased GMV of amygdala, cingulate gyrus, and anterior insular cortex in this study could be explained by the functional deficit of the emotional processing network in MDD.
The main function of the lingual gyrus, which was showed decreased regional GMV in this study, is the integration of auditory, visual, and somatosensory functions (47, 48). The higher-order harmonic processing of the lingual gyrus was reported in trained musicians (49). So, the structural deficit of the MDD's lingual gyrus could reflect the deficit of multisensory function (50, 51). The fusiform gyrus has been kwon to be related with the perception of emotion (52), the recognitions of word, face, number, and color (53). The network between fusiform gyrus and amygdala is involved in facial processing, and this network is vulnerable to depression (54). Thus the GM deficit of MDD's fusiform gyri could be interpreted as the abnormal functioning of emotional and perceptional processing.
In this study, the spatially normalized images with additional modulation were used for analysis of GMV changes. To preserve the total amount of signal during spatial normalization, areas expanded during warping are correspondingly reduced in intensity, while areas contracted during warping are increased in intensity. This process, known as modulation, involves multiplying tissue voxel values by the Jacobian determinants (i.e., the determinants of the deformation parameters obtained by spatial normalization). Therefore, the use of a modulation process may reflect regional volume changes (25). The spatial normalization process matches the size and shape of the subject's brain to a template image at the time of the MRI scan, but does not normalize the premorbid brain size (55, 56, 57), so volume normalization against the premorbid brain size is an important factor for mVBM. Skull growth occurs along the suture lines and the size of skull is determined by brain expansion, which takes place during the normal growth of the brain (58), so ICV represents the brain size at maximal maturity unaffected by age and disease related atrophy. The estimation of correct ICV could be the important factor for the VBM analysis of disease related volume changes. In the VBM analysis, manually measured ICV was utilized for the normalization of the regional brain volumes, and the method for ICV measurement adopted in this study was wide used and validated (23, 59, 60). The VBM corrected with manually measured ICV was significantly increased the sensitivity of GMV change compared to the volume correction with the summed volumes of total gray and white matters or total gray matter volumes or automated ICV measurement (60).
In the VBM analysis, inaccurate segmentation between the tissue partitions could affect the results of regional GMV. So if there were remained CSF fractions around gray matter partition, additional segmentation should be performed. In the present study, to process the accurate segmentation of gray matter images, we did some trials in the MRI acquisition and preprocessing processes. By the setting of various MRI acquisition parameters, we got a good T1 volumetric MR image, which was effectively suppressing the densities of the cranial bone and dura matter compared to the density of gray matter. Additionally, the clean-up procedure and HMRF model were applied in the segmentation processes. The clean-up process is a procedure to remove non-connected non-brain voxels from the segmented gray matter. Using conditional dilations and erosions a clean-up mask was created to remove these nonconnected parts from the segmented images. The HMRF model removes the isolated voxels of one tissue class, which are unlikely to be the member of gray matter (61). Using the described image acquisition and preprocessing methods, we could get clearly segmented gray matter images without manual editing, these upgraded methods improved the sensitivity of VBM.
CONCLUSIONS
The results of this study indicate that the female MDD is mainly associated with the structural deficits of the limbic system and limbic system related cortices, which were known to the center of emotions. These find may contribute to understand the pathophysiology of female major depression.

 XML Download