Abstract
Objective
The aim of this study was to analyze published data for an association between consumption of sugar sweetened beverages (SSBs) and the development of gout.
Methods
We performed a meta-analysis to examine the highest and lowest categories of SSB consumption in relation to risk of gout.
Results
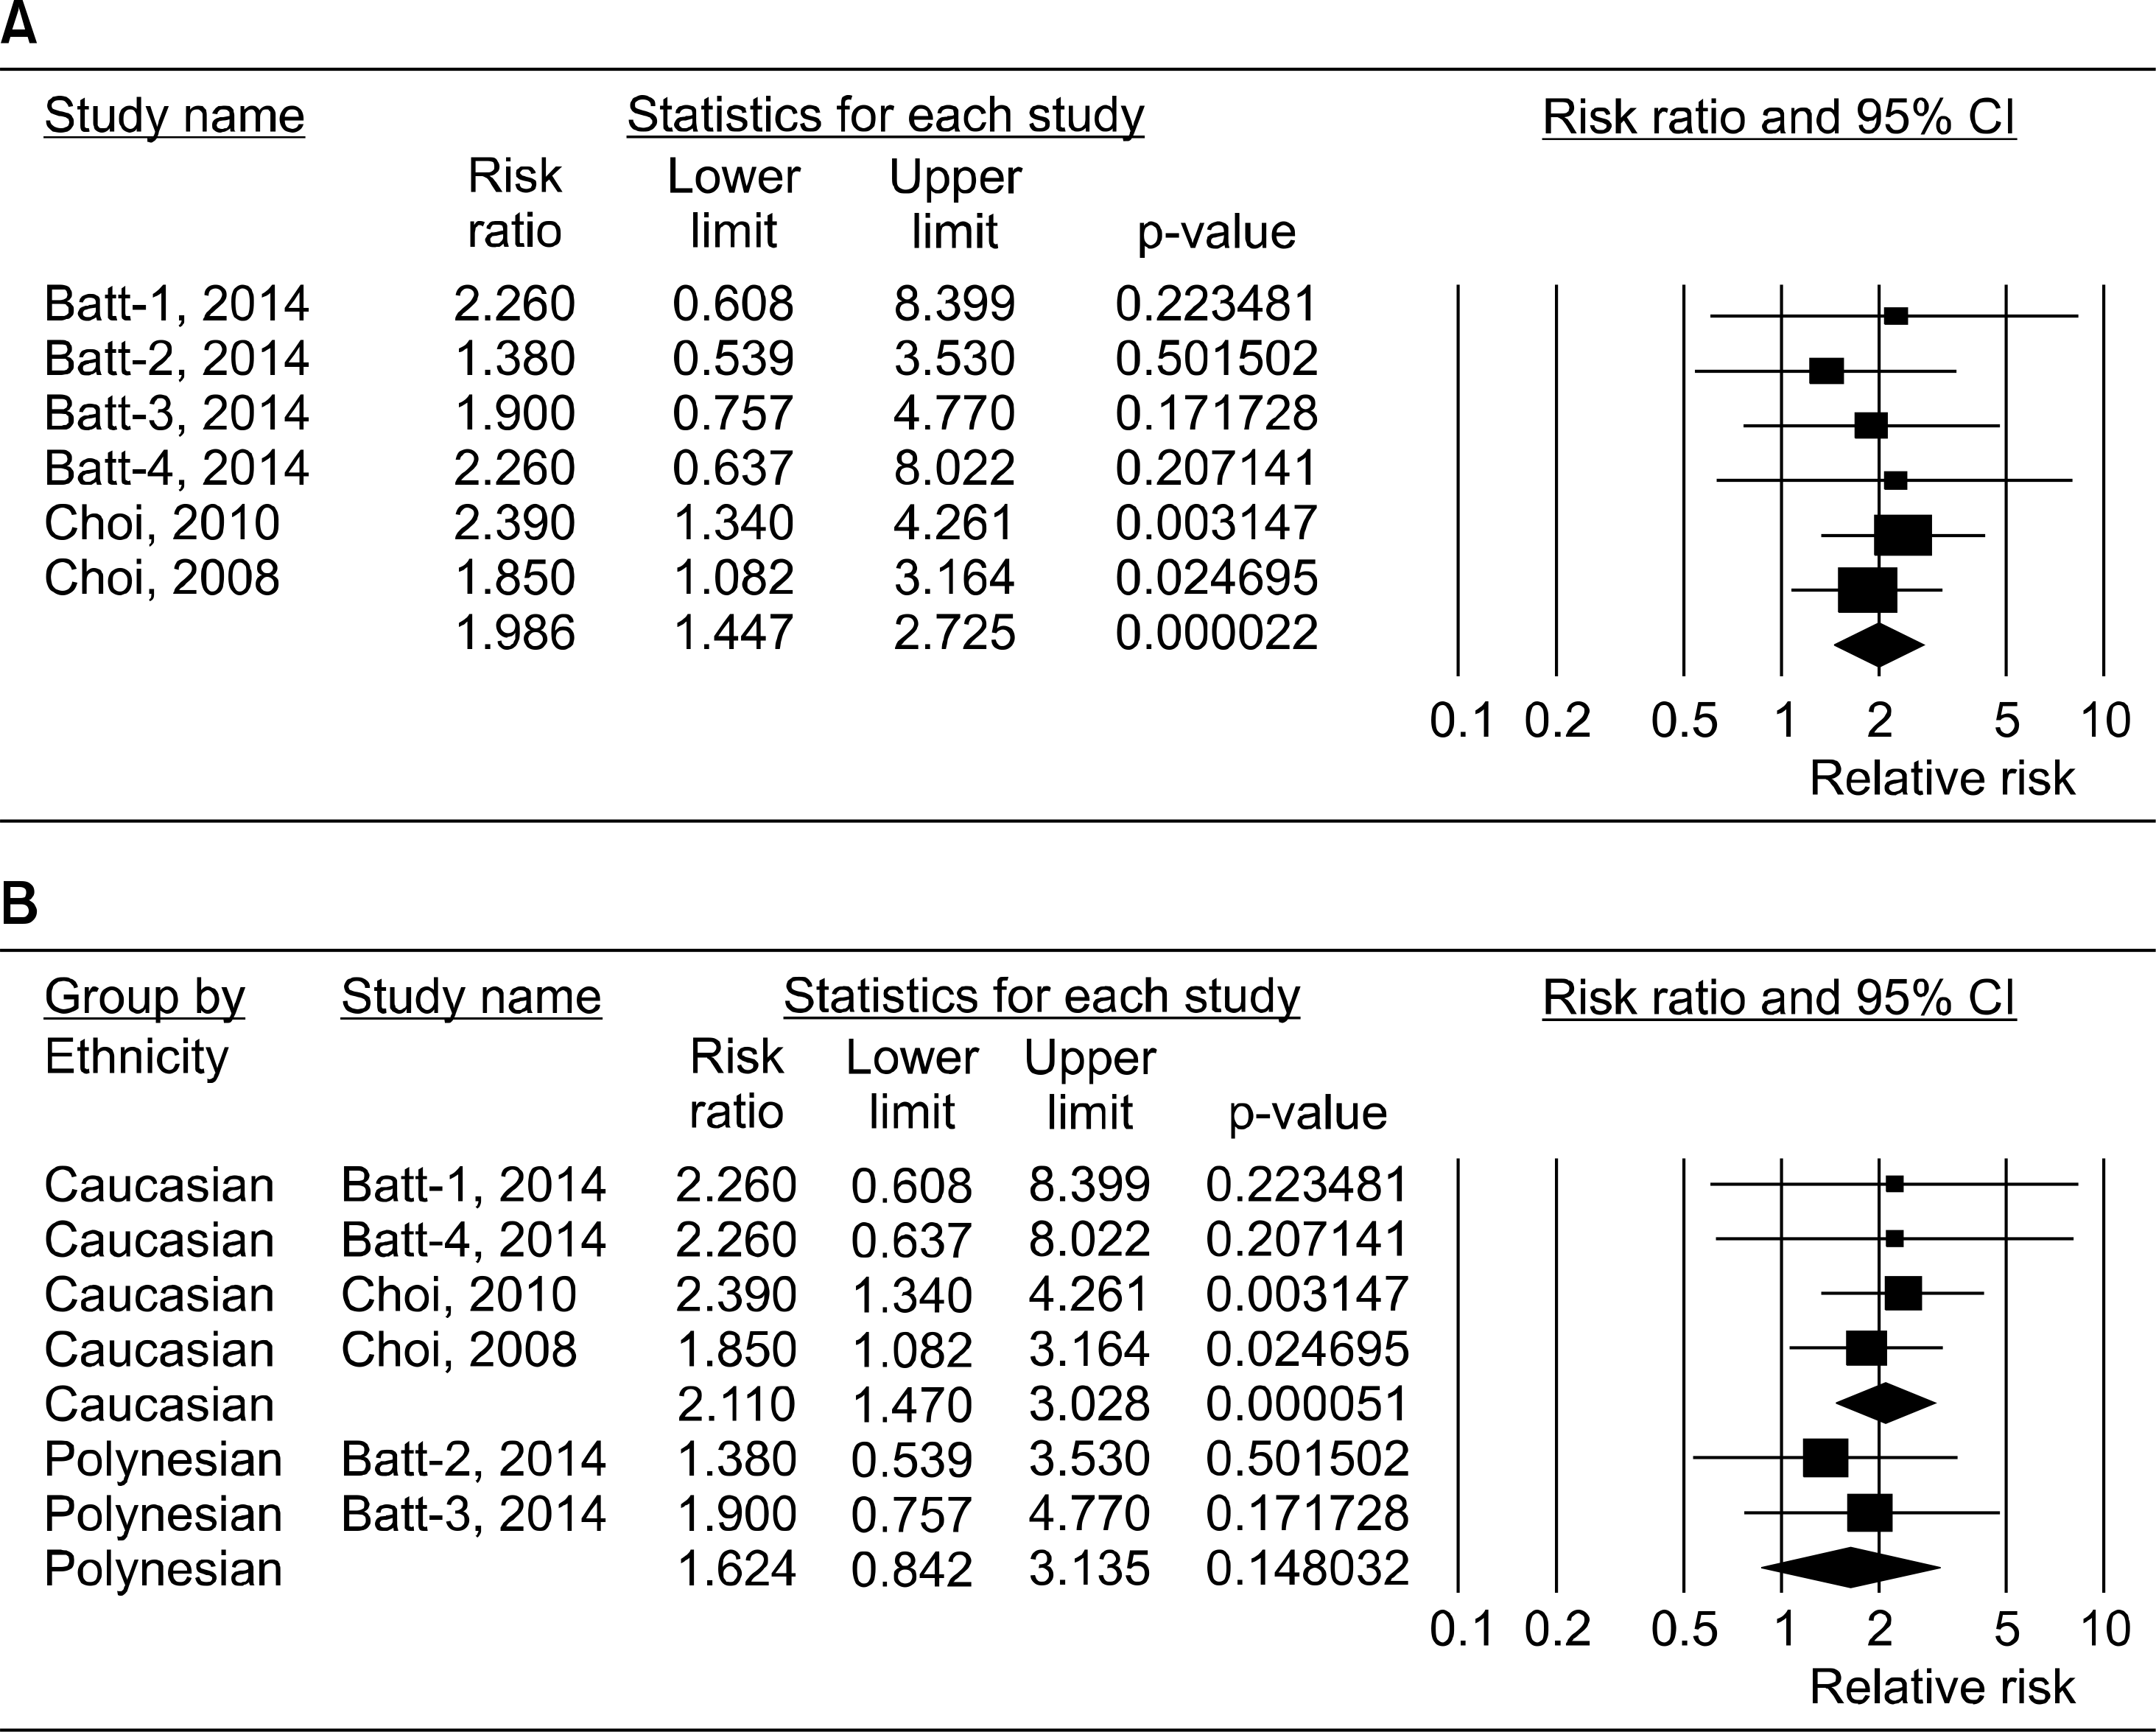
Three studies including 2,606 gout patients among 134,008 participants were included. Meta-analysis revealed a significant association between SSB consumption and gout risk (relative risk [RR]=1.986, 95% confidence interval [CI]=1.447∼2.725, p=2.2×10⁻⁵). Stratification by ethnicity showed a significant association between SSB consumption and gout risk in ethnic Europeans, but not in Polynesians (RR=2.110, 95% CI=1.470∼2.725, p=5.1×10⁻⁵; RR=1.624, 95% CI=0.842∼3.135, p=0.148, respectively). SSB consumption and gout risk were associated in original data and imputed data, for both men and women, regardless of data type and sex. The association between the highest SSB consumption group and gout was stronger than the association between the middle group and gout, indicating a doseresponse gradient (RR=1.986, 95% CI=1.447∼2.725, p<2.2×10⁻⁵ vs. RR=1.260, 95% CI=1.043∼1.522, p<0.016).
Conclusion
This meta-analysis of 134,008 participants demonstrates that SSB consumption is associated with an elevated risk of gout development, particularly in the ethnic European population. Available evidence indicates a doseresponse gradient of the relationship between SSB consumption and gout risk.
REFERENCES
2. Terkeltaub RA. Clinical practice. Gout. N Engl J Med. 2003; 349:1647–55.
4. Nakagawa T, Tuttle KR, Short RA, Johnson RJ. Hypothesis: fructose-induced hyperuricemia as a causal mechanism for the epidemic of the metabolic syndrome. Nat Clin Pract Nephrol. 2005; 1:80–6.

6. Rho YH, Zhu Y, Choi HK. The epidemiology of uric acid and fructose. Semin Nephrol. 2011; 31:410–9.

7. Batt C, Phipps-Green AJ, Black MA, Cadzow M, Merriman ME, Topless R, et al. Sugar-sweetened beverage consumption: a risk factor for prevalent gout with SLC2A9 gen-otype-specific effects on serum urate and risk of gout. Ann Rheum Dis. 2014; 73:2101–6.
8. Choi HK, Willett W, Curhan G. Fructose-rich beverages and risk of gout in women. JAMA. 2010; 304:2270–8.

9. Choi HK, Curhan G. Soft drinks, fructose consumption, and the risk of gout in men: prospective cohort study. BMJ. 2008; 336:309–12.

10. Lee YH, Harley JB, Nath SK. Meta-analysis of TNF-alpha promoter-308 A/G polymorphism and SLE susceptibility. Eur J Hum Genet. 2006; 14:364–71.
11. Lee YH, Rho YH, Choi SJ, Ji JD, Song GG. PADI4 polymorphisms and rheumatoid arthritis susceptibility: a meta-analysis. Rheumatol Int. 2007; 27:827–33.

12. Nath SK, Harley JB, Lee YH. Polymorphisms of complement receptor 1 and interleukin-10 genes and systemic lupus erythematosus: a meta-analysis. Hum Genet. 2005; 118:225–34.

13. Zhang J, Yu KF. What's the relative risk? A method of cor-recting the odds ratio in cohort studies of common outcomes. JAMA. 1998; 280:1690–1.
14. Wells GA, Shea B, O'connell D, Peterson J, Welch V, Losos M, et al. The Newcastle-Ottawa Scale (NOS) for assessing the quality of nonrandomised studies in meta-analyses [Internet]. Ottawa: Ottawa Hospital Research Institute;2011. [cited 2016]. Available from:. http://www.ohri.-ca/programs/clinical_epidemiology/oxford.asp.
15. Davey P, Grainger D, MacMillan J, Rajan N, Aristides M, Gliksman M. Clinical outcomes with insulin lispro compared with human regular insulin: a meta-analysis. Clin Ther. 1997; 19:656–74.

17. Jadad AR, Moore RA, Carroll D, Jenkinson C, Reynolds DJ, Gavaghan DJ, et al. Assessing the quality of reports of randomized clinical trials: is blinding necessary? Control Clin Trials. 1996; 17:1–12.

18. Higgins JP, Thompson SG. Quantifying heterogeneity in a meta-analysis. Stat Med. 2002; 21:1539–58.

19. Egger M, Davey Smith G, Schneider M, Minder C. Bias in meta-analysis detected by a simple, graphical test. BMJ. 1997; 315:629–34.

20. Dalbeth N, Phipps-Green A, House ME, Gamble GD, Horne A, Stamp LK, et al. Body mass index modulates the relationship of sugar-sweetened beverage intake with serum urate concentrations and gout. Arthritis Res Ther. 2015; 17:263.

21. Cox CL, Stanhope KL, Schwarz JM, Graham JL, Hatcher B, Griffen SC, et al. Consumption of fructose-but not glucose-sweetened beverages for 10 weeks increases circulating concentrations of uric acid, retinol binding protein-4, and gamma-glutamyl transferase activity in overweight/ obese humans. Nutr Metab (Lond). 2012; 9:68.

22. Jayalath VH, de Souza RJ, Ha V, Mirrahimi A, Blanco-Mejia S, Di Buono M, et al. Sugar-sweetened beverage consumption and incident hypertension: a systematic review and meta-analysis of prospective cohorts. Am J Clin Nutr. 2015; 102:914–21.

23. Malik VS, Popkin BM, Bray GA, Després JP, Willett WC, Hu FB. Sugar-sweetened beverages and risk of metabolic syndrome and type 2 diabetes: a meta-analysis. Diabetes Care. 2010; 33:2477–83.
Figure 2.
Meta-analysis of the association between sugar sweetened beverages (SSBs) consumption and gout risk for the highest versus lowest groups of SSBs intake in the overall group (A) and each ethnic group (B). CI: confidence interval.

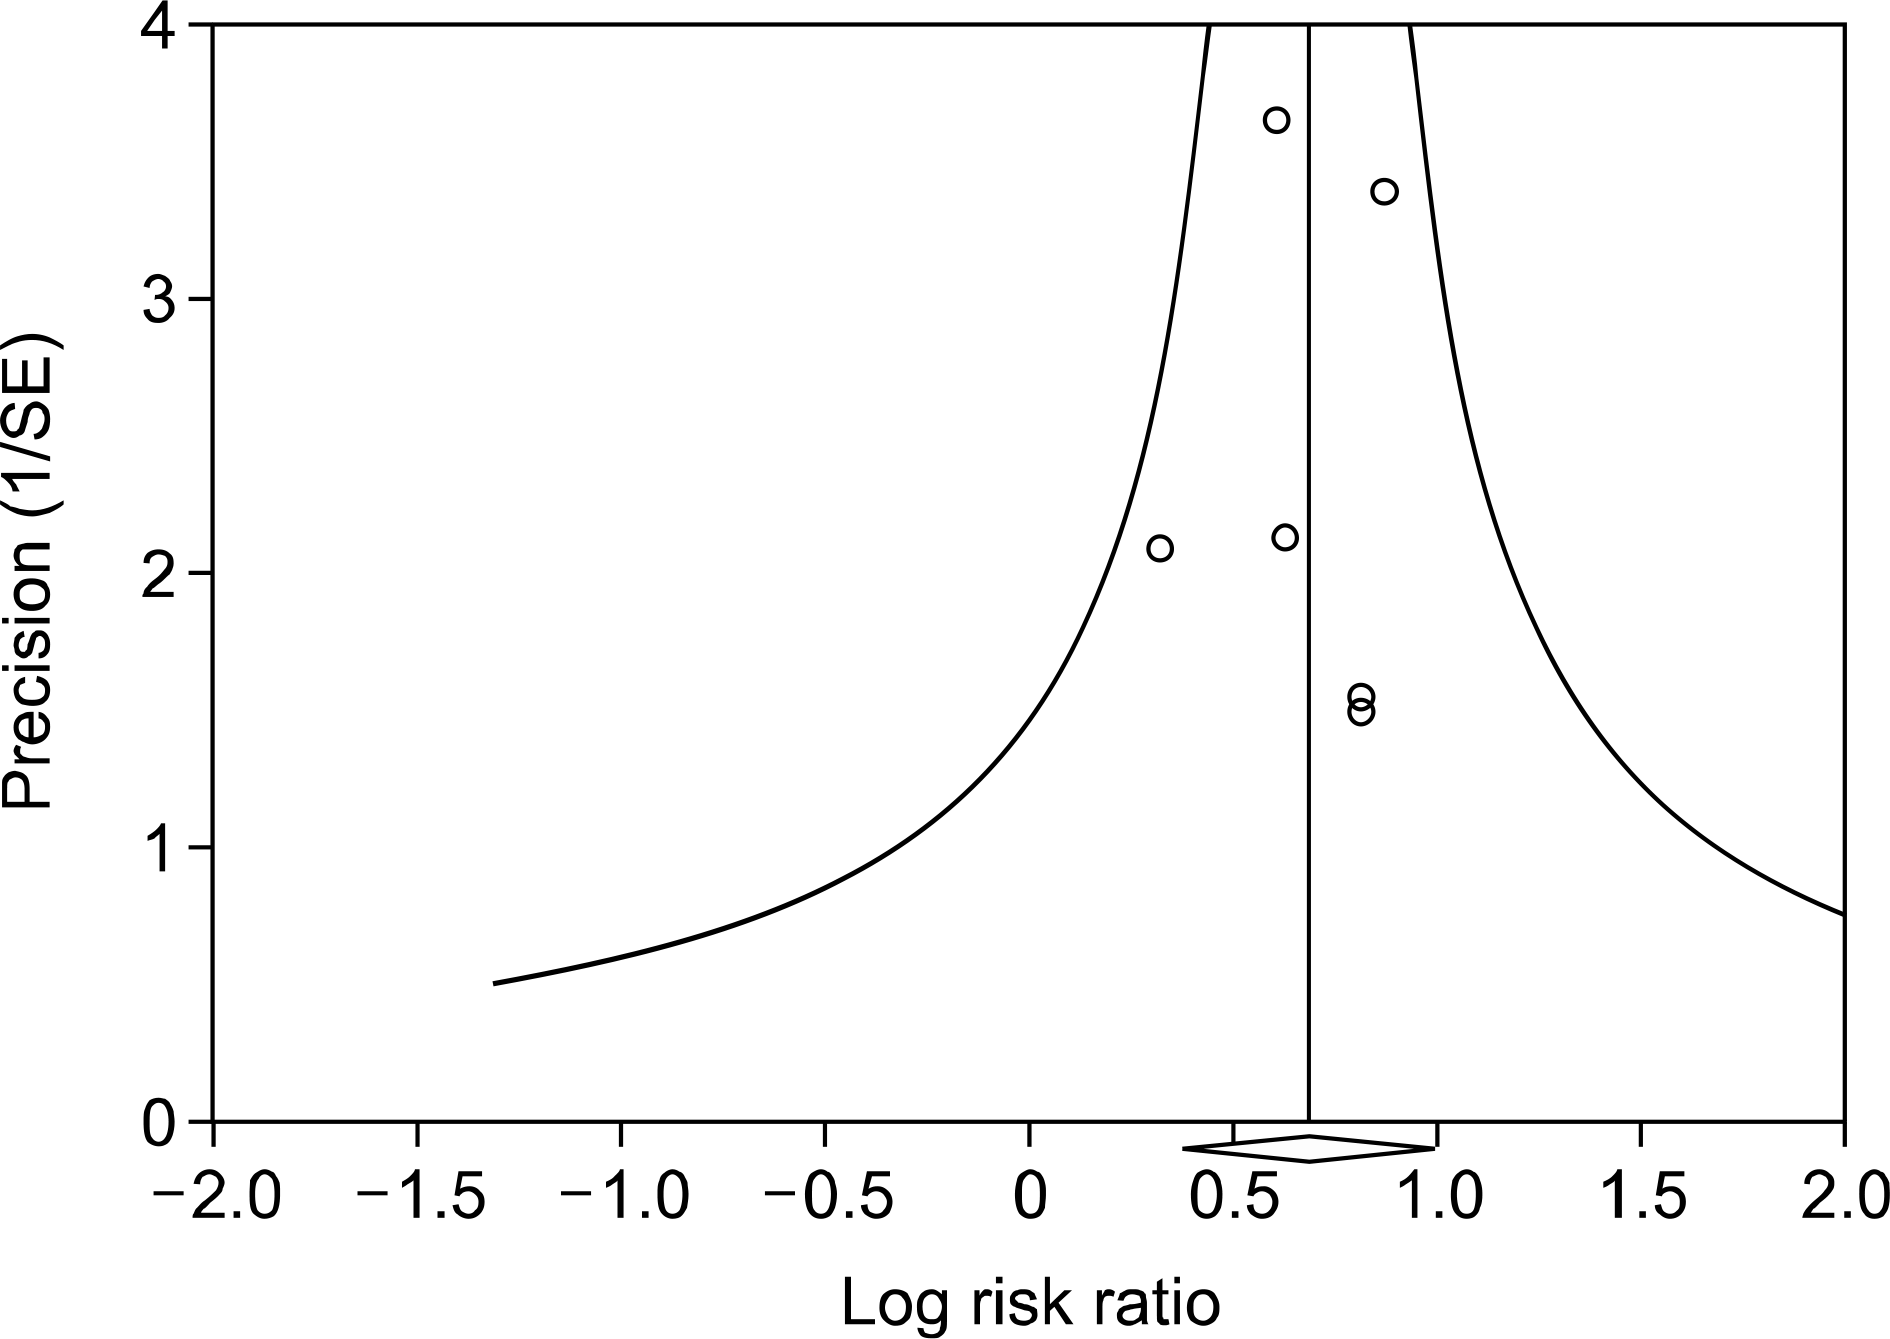
Figure 3.
Funnel plot of studies that examined the association between sugar sweetened beverages consumption and gout risk (Egger's regression test p-value=0.845). SE: standard error.

Table 1.
Characteristics of the individual studies included in the meta-analysis
| Study [Ref] | Country | Ethnicity | Subjects' age (yr), range | Sex (%), male | Study period | Study design | Case (n) | Total (n) | RR (95% CI) for highest vs. lowest intakes | Adjustment for confounders | Study quality |
|---|---|---|---|---|---|---|---|---|---|---|---|
| Batt-1, 2014 [7] | USA | Caucasian | 23∼94 | 77.8 | 2006∼2011 | Cross-sectional | 412 | 592 | 2.38* (0.64∼8.84), Ptrend=0.020 (>5 servings/d vs. 0) | Age, sex, BMI, alcohol (continuous variable), fruit intake (continuous variable), kidney disease | 8 |
| Batt-2, 2014 [7] | USA | Polynesian | 23∼81 | 80.3 | 2006∼2011 | Cross-sectional | 190 | 502 | 1.44* (0.59∼3.53), Ptrend = 0.011 (>5 servings/d vs. 0) | Age, sex, BMI, alcohol (continuous variable), fruit intake (continuous variable), kidney disease | |
| Batt-3, 2014 [7] | USA | Polynesian | 18∼81 | 87.9 | 2006∼2011 | Cross-sectional | 323 | 540 | 2.17* (0.98∼4.77), Ptrend = 0.050 (>5 servings/d vs. 0) | Age, sex, BMI, alcohol (continuous variable), fruit intake (continuous variable), kidney disease | 8 |
| Batt-4, 2014 [7] | USA | Caucasian | 45∼65 | 75.0 | ND | Cohort | 148 | 7,075 | 2.31* (0.65∼8.19), Ptrend = 0.026 (>5 servings/d vs. 0) | Age, sex, BMI, alcohol (continuous variable), fruit intake (continuous variable), kidney disease, high blood pressure and relatedness | 8 |
| Choi, 2010 [8] | USA | Caucasian† | 30∼55 | 0 | 1984∼2006 | Cohort | 778 | 78,906 | 1.85 (1.08∼3.16), Ptrend = 0.002 (>2 servings/d vs. 1 </mo) | Age, total energy intake, BMI, menopause status, use of hormonal therapy, diuretic use, history of hypertension, and intake of alcohol, total meats, seafood, dairy products, total vitamin C, SSB, and the beverages | 8 |
| Choi, 2008 [9] | Canada | Caucasian ‡ | 40∼75 | 100 | 1986∼1998 | Cohort | 755 | 46,393 | 2.39 (1.34∼4.26), Ptrend<0.001 (>2 servings/d vs. 1 </mo) | Age, total energy intake, body mass index, diuretic use, history of hypertension, and history of chronic renal failure; intake of alcohol, total meats, seafood, purine rich vegetables, dairy foods, and total vitamin C; and sweetened soft drinks, diet soft drinks, sweetened cola, and other sweetened soft drinks | 8 |
Table 2.
Meta-analysis of studies on sugar sweetened beverages consumption and risk of gout


 PDF
PDF ePub
ePub Citation
 Print
Print


 XML Download