Abstract
Objective
Methods
Results
REFERENCES
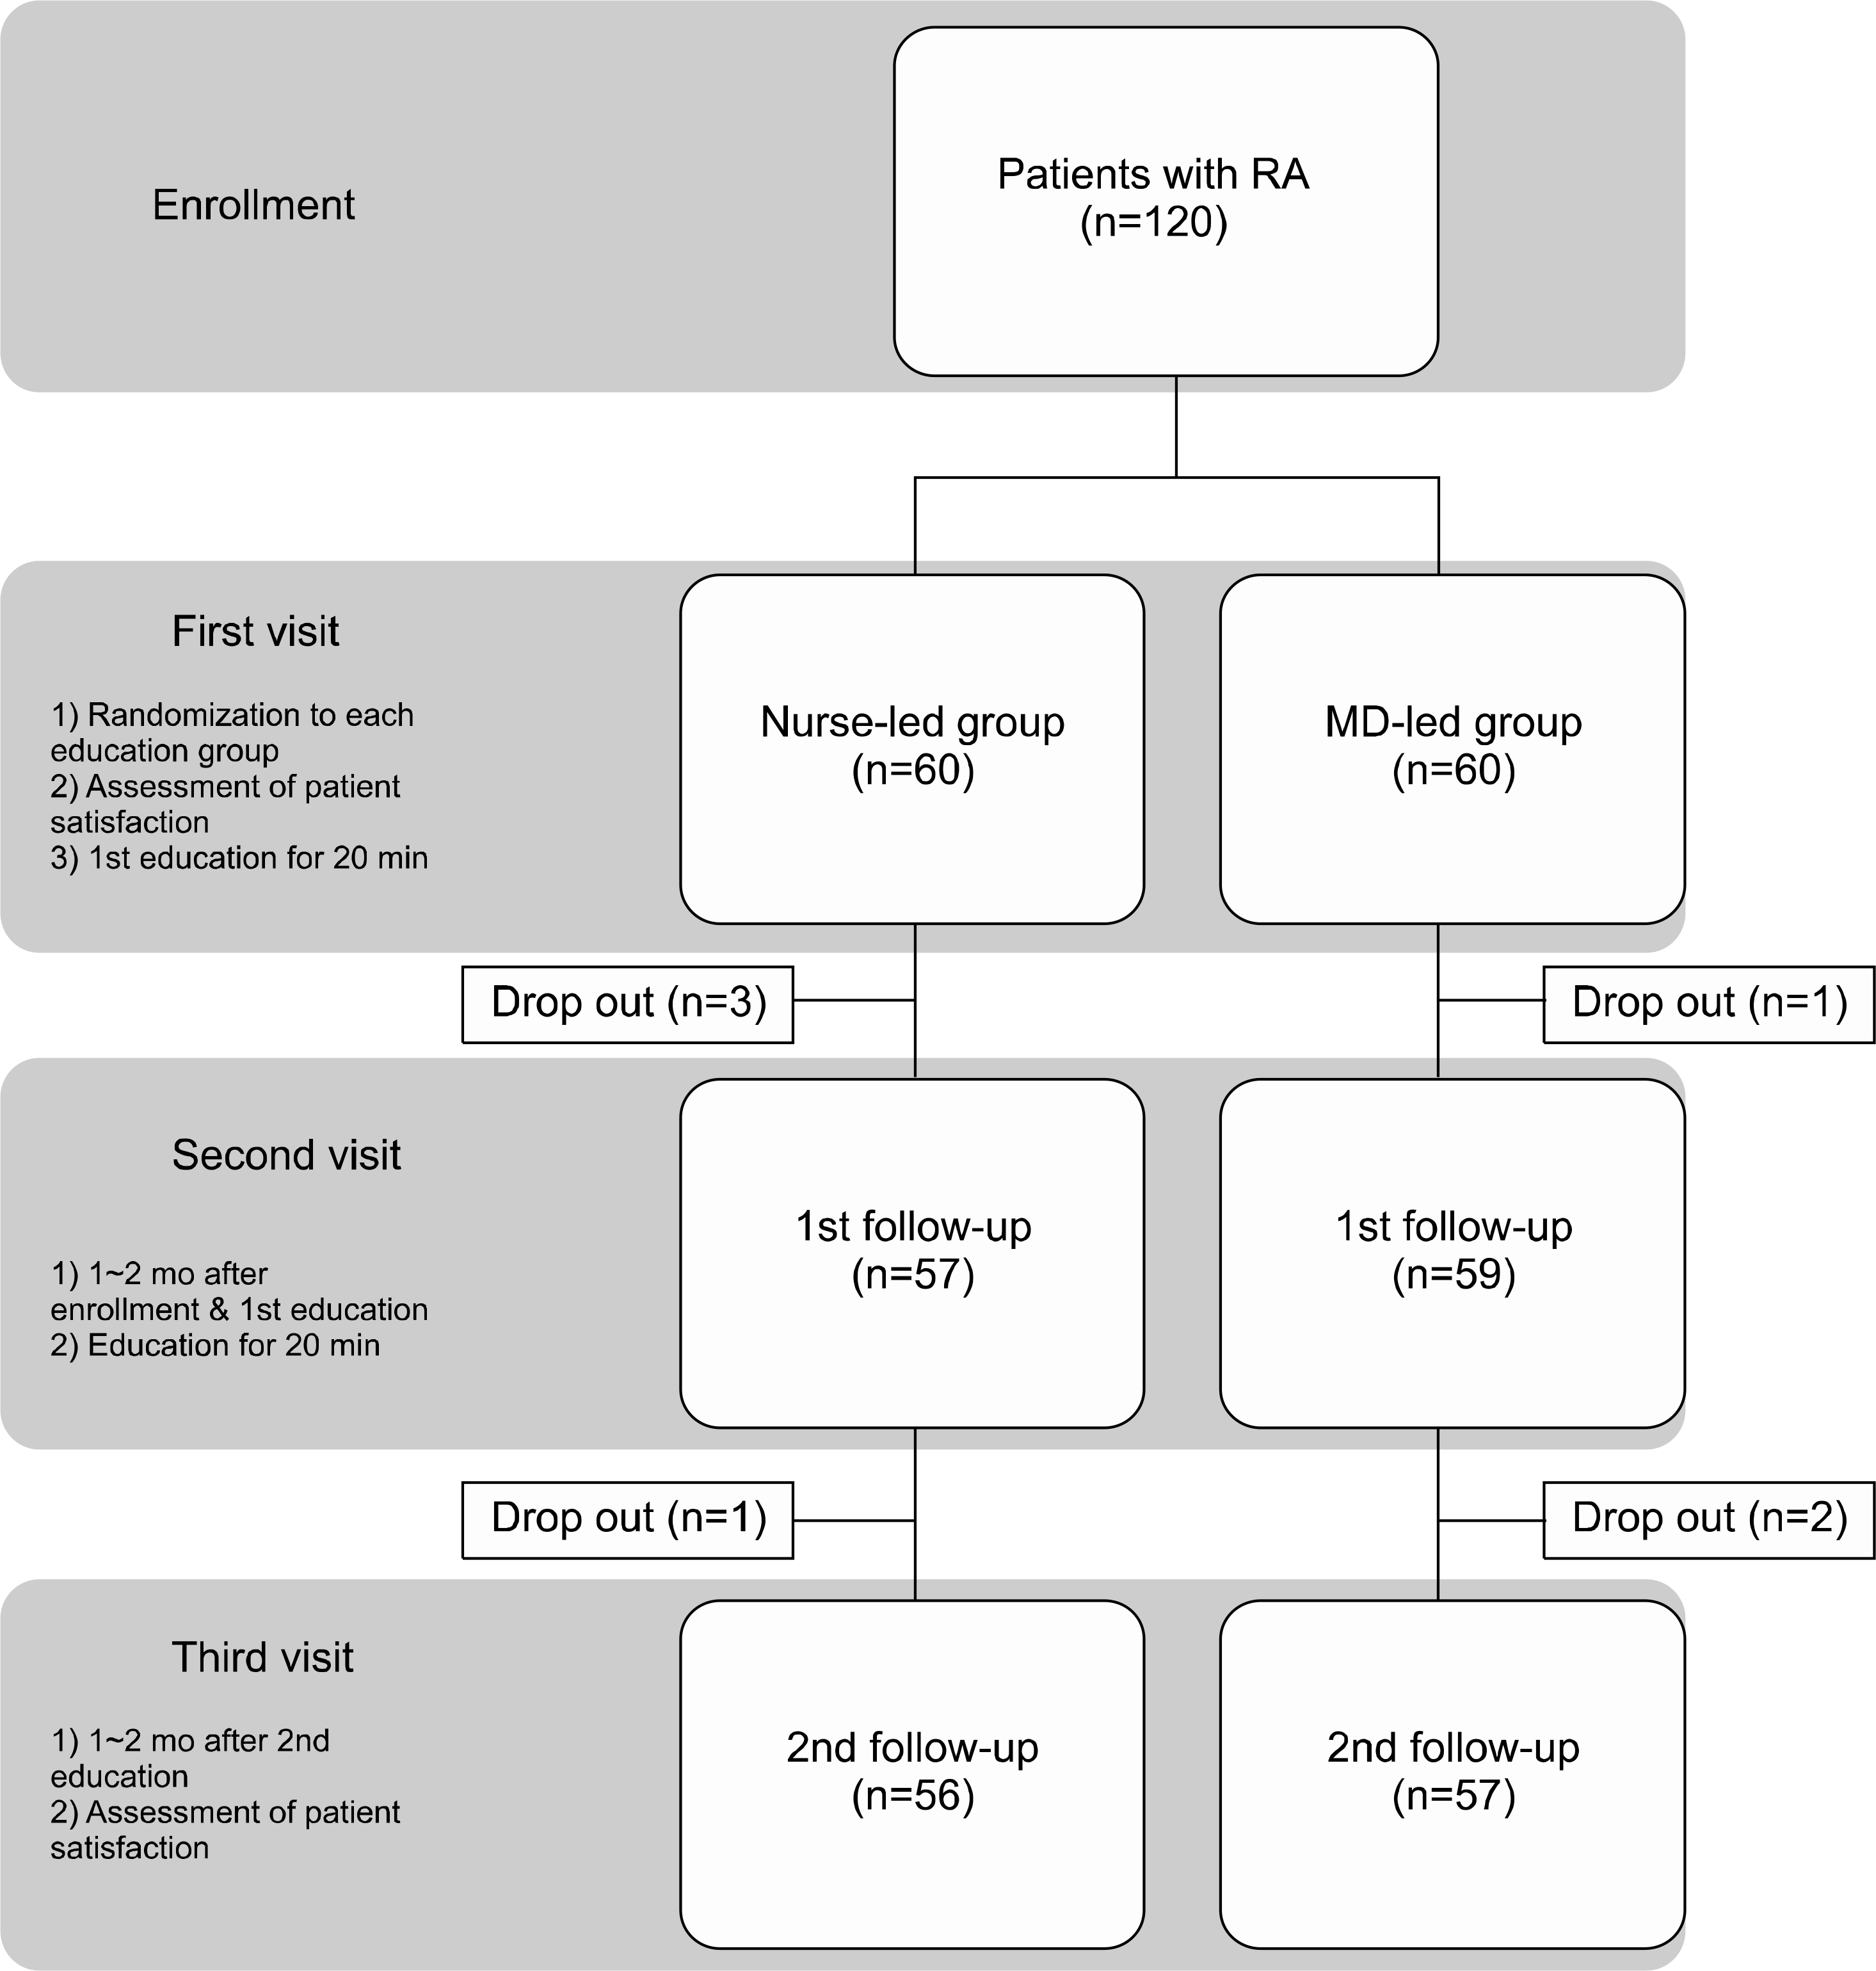
Figure 1.

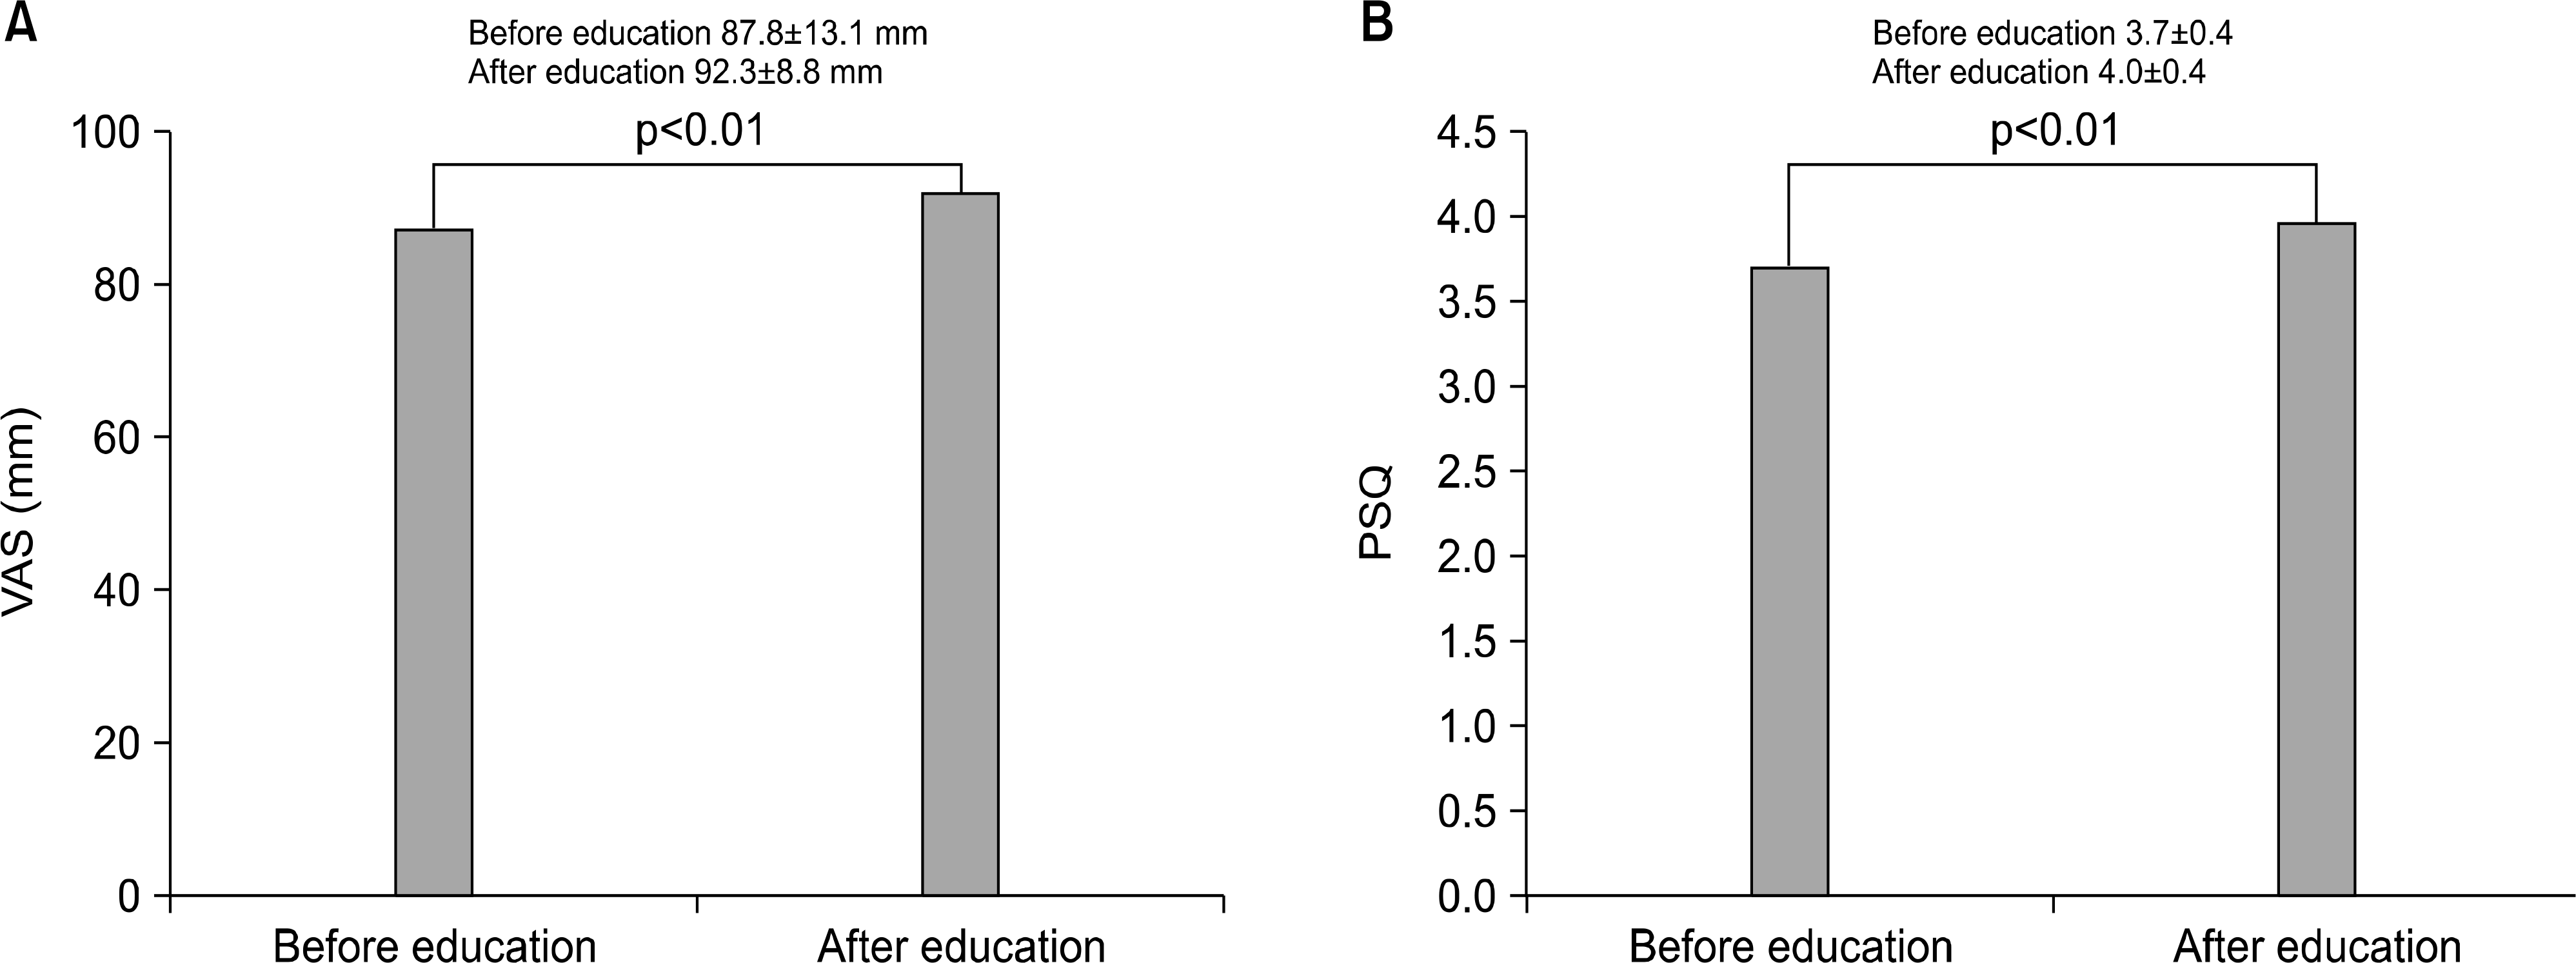
Figure 2.

Table 1.
Values are presented as median (range), number (%), or mean±standard deviation. BMI: body mass index, CCP: cyclic citrullinated peptides, CRP: C-reactive protein, DAS28: disease activity score with 28 joint, DMARDs: disease modifying antirheumatic drugs, ESR: erythrocyte sedimentation rate, HAQ-DI: health assessment questionnaire disability index, MD: medical doctor, MTX: methotrexate, RF: rheumatoid factor, VAS: visual analogue scale.
Table 2.
| PSQ | Total | Nurse-led education (n=60) | MD-led education (n=60) | p-value |
|---|---|---|---|---|
| General satisfaction | ||||
| Before education | 3.2±0.4 | 3.2±0.5 | 3.2±0.3 | 0.76 |
| After education | 3.4±0.4 | 3.3±0.4 | 3.4±0.3 | 0.26 |
| Change between pre and post-education | 0.2±0.4* | 0.1±0.5 | 0.2±0.3 | 0.32 |
| Giving of information | ||||
| Before education | 3.7±0.5 | 3.7±0.6 | 3.7±0.4 | 0.85 |
| After education | 4.2±0.4 | 4.2±0.4 | 4.1±0.4 | 0.38 |
| Change between pre and post-education | 0.4±0.5* | 0.5±0.5 | 0.4±0.5 | 0.28 |
| Empathy with the patient | ||||
| Before education | 3.8±0.5 | 3.8±0.6 | 3.8±0.5 | 0.36 |
| After education | 4.1±0.6 | 4.1±0.6 | 4.1±0.5 | 0.86 |
| Change between pre and post-education | 0.3±0.7* | 0.3±0.7 | 0.3±0.7 | 0.57 |
| Technical quality and competence | ||||
| Before education | 4.2±0.5 | 4.2±0.6 | 4.2±0.4 | 0.80 |
| After education | 4.4±0.5 | 4.5±0.6 | 4.4±0.5 | 0.35 |
| Change between pre and post-education | 0.2±0.7* | 0.3±0.7 | 0.2±0.6 | 0.33 |
| Attitude towards the patient | ||||
| Before education | 3.7±0.6 | 3.7±0.7 | 3.8±0.5 | 0.76 |
| After education | 3.9±0.6 | 4.0±0.7 | 3.9±0.6 | 0.30 |
| Change between pre and post-education | 0.2±0.6* | 0.3±0.7 | 0.1±0.6 | 0.20 |
| Access and continuity | ||||
| Before education | 3.6±0.5 | 3.6±0.6 | 3.6±0.5 | 0.74 |
| After education | 3.8±0.7 | 3.8±0.7 | 3.7±0.6 | 0.55 |
| Change between pre and post-education | 0.2±0.7* | 0.2±0.6 | 0.2±0.7 | 0.75 |
| Overall satisfaction | ||||
| Before education | 3.7±0.4 | 3.7±0.5 | 3.7±0.4 | 0.81 |
| After education | 4.0±0.4* | 4.0±0.4 | 4.0±0.4 | 0.43 |
| Change between pre and post-education | 0.3±0.4 | 0.3±0.4 | 0.2±0.4 | 0.26 |
Table 3.
Values are presented as mean±standard deviation. Patients group were classified according to disease duration and antirheumatic drugs. Group I: patients who were less than 2 years after RA diagnosis, Group II: patients who were more than 2 years after RA diagnosis, Group III: patients treated with biologic disease modifying antirheumatic drugs. PSQ: patients' satisfaction questionnaire, RA: rheumatoid arthritis, VAS: visual analogue scale.
Table 4.
| Feature | Total (n=120) | p-value | Nurse-led group (n=60) | MD-led group (n=60) | p-value |
|---|---|---|---|---|---|
| DAS28-ESR | |||||
| Before education | 3.8±1.3 | 3.9±1.3 | 3.8±1.3 | 0.62 | |
| After education | 3.6±1.2 | 3.6±1.1 | 3.7±1.3 | 0.51 | |
| Improvement | 0.2±1.1 | 0.20* | 0.3±1.1 | −0.002±1.1 | 0.13 |
| HAQ-DI | |||||
| Before education | 0.6±0.6 | 0.7±0.6 | 0.5±0.5 | 0.16 | |
| After education | 0.7±0.6 | 0.7±0.6 | 0.6±0.6 | 0.17 | |
| Improvement | −0.07±0.44 | 0.07* | −0.05±0.53 | −0.10±0.35 | 0.63 |
| EQ-5D | |||||
| Before education | 0.8±0.1 | 0.8±0.1 | 0.8±0.1 | 0.56 | |
| After education | 0.8±0.1 | 0.8±0.1 | 0.8±0.1 | 1.00 | |
| Improvement | 0.02±0.12 | 0.01* | 0.04±0.11 | 0.01±0.14 | 0.19 |
Table 5.
Values are presented as mean±standard deviation. Group I: patients who were less than 2 years after RA diagnosis, Group II: patients who were more than 2 years after RA diagnosis, Group III: patients treated with biologic disease modifying antirheumatic drugs. MD: medical doctor, DAS28: disease activity score with 28 joint, ESR: erythrocyte sedimentation rate, HAQ-DI: health assessment questionnaire disability index, EQ-5D: European quality of life-5 dimension, RA: rheumatoid arthritis.


 PDF
PDF ePub
ePub Citation
 Print
Print


 XML Download