Abstract
Meta-analysis is a statistical tool for combining the results of different studies on the same topic, providing a precise estimate of the effect size and increasing statistical strength, which is particularly important when the strength of the primary study is limited because of a small sample size. Properly conducted meta-analysis provides an invaluable link between past and future studies by quantitatively synthesizing evidence while minimizing bias. Recently, because studies on meta-analysis have been published increasingly, there is a need for rheumatologists to understand meta-analysis. In order to help rheumatologists in use of a meta-analysis, the author describes the basic steps in statistical analysis of a meta-analysis: 1) search for presence of between-study heterogeneity, 2) performing statistical analysis of meta-analysis, 3) checking publication bias, 4) search for causes of heterogeneity, and 5) interpreting and presenting meta-analysis results.
REFERENCES
3. Noble JH Jr. Meta-analysis: Methods, strengths, weaknesses, and political uses. J Lab Clin Med. 2006; 147:7–20.

5. Fleiss JL. The statistical basis of meta-analysis. Stat Methods Med Res. 1993; 2:121–45.
7. Higgins JP, Thompson SG, Deeks JJ, Altman DG. Measuring inconsistency in meta-analyses. BMJ. 2003; 327:557–60.

8. Lee YH, Woo JH, Choi SJ, Ji JD, Song GG. Fc receptor-like 3-169 C/T polymorphism and RA susceptibility: a meta-analysis. Rheumatol Int. 2010; 30:947–53.
9. Borenstein M, Hedges LV, Higgins J, Rothstein HR. A basic introduction to fixed‐ effect and random‐ effects models for meta‐ analysis. Res Synth Method. 2010; 1:97–111.
11. Han SW, Sa KH, Kim SI, Lee SI, Park YW, Lee SS, et al. FCRL3 gene polymorphisms contribute to the radiographic severity rather than susceptibility of rheumatoid arthritis. Hum Immunol. 2012; 73:537–42.

12. Chen JY, Wang CM, Wu YJ, Kuo SN, Shiu CF, Chang SW, et al. Disease phenotypes and gender association of FCRL3 single-nucleotide polymorphism-169T/C in Taiwanese patients with systemic lupus erythematosus and rheumatoid arthritis. J Rheumatol. 2011; 38:264–70.
13. Wu H, Yang LH, Zuo J, Liang YL, Li PQ, Liu W, et al. Fc receptor-like 3 gene polymorphisms confer susceptibility to rheumatoid arthritis in a Chinese population. Hum Immunol. 2010; 71:1203–8.

14. Takata Y, Inoue H, Sato A, Tsugawa K, Miyatake K, Hamada D, et al. Replication of reported genetic associations of PADI4, FCRL3, SLC22A4 and RUNX1 genes with rheumatoid arthritis: results of an independent Japanese population and evidence from meta-analysis of East Asian studies. J Hum Genet. 2008; 53:163–73.

15. Choi CB, Kang CP, Seong SS, Bae SC, Kang C. The-169C/T polymorphism in FCRL3 is not associated with susceptibility to rheumatoid arthritis or systemic lupus erythematosus in a case-control study of Koreans. Arthritis Rheum. 2006; 54:3838–41.
16. Ikari K, Momohara S, Nakamura T, Hara M, Yamanaka H, Tomatsu T, et al. Supportive evidence for a genetic association of the FCRL3 promoter polymorphism with rheumatoid arthritis. Ann Rheum Dis. 2006; 65:671–3.

17. Kochi Y, Yamada R, Suzuki A, Harley JB, Shirasawa S, Sawada T, et al. A functional variant in FCRL3, encoding Fc receptor-like 3, is associated with rheumatoid arthritis and several autoimmunities. Nat Genet. 2005; 37:478–85.

18. Maehlen MT, Nordang GB, Syversen SW, van der Heijde DM, Kvien TK, Uhlig T, et al. FCRL3-169C/C genotype is associated with anti-citrullinated protein antibody-positive rheumatoid arthritis and with radiographic progression. J Rheumatol. 2011; 38:2329–35.
19. Owen CJ, Kelly H, Eden JA, Merriman ME, Pearce SH, Merriman TR. Analysis of the Fc receptor-like-3 (FCRL3) locus in Caucasians with autoimmune disorders suggests a complex pattern of disease association. J Clin Endocrinol Metab. 2007; 92:1106–11.

20. Thabet MM, Wesoly J, Slagboom PE, Toes RE, Huizinga TW. FCRL3 promoter 169 CC homozygosity is associated with susceptibility to rheumatoid arthritis in Dutch Caucasians. Ann Rheum Dis. 2007; 66:803–6.

21. Newman WG, Zhang Q, Liu X, Walker E, Ternan H, Owen J, et al. Rheumatoid arthritis association with the FCRL3-169C polymorphism is restricted to PTPN22 1858T-homo-zygous individuals in a Canadian population. Arthritis Rheum. 2006; 54:3820–7.
22. Eyre S, Bowes J, Potter C, Worthington J, Barton A. Association of the FCRL3 gene with rheumatoid arthritis: a further example of population specificity? Arthritis Res Ther. 2006; 8:R117.

23. Hu X, Chang M, Saiki RK, Cargill MA, Begovich AB, Ardlie KG, et al. The functional-169T–>C single-nucleotide polymorphism in FCRL3 is not associated with rheumatoid arthritis in white North Americans. Arthritis Rheum. 2006; 54:1022–5.
24. Martínez A, Sánchez E, Valdivia A, Orozco G, López-Nevot MA, Pascual-Salcedo D, et al. Epistatic interaction between FCRL3 and NFkappaB1 genes in Spanish patients with rheumatoid arthritis. Ann Rheum Dis. 2006; 65:1188–91.
25. El-Gabalawy HS, Robinson DB, Daha NA, Oen KG, Smolik I, Elias B, et al. Non-HLA genes modulate the risk of rheumatoid arthritis associated with HLA-DRB1 in a susceptible North American Native population. Genes Immun. 2011; 12:568–74.

27. Simes RJ. Confronting publication bias: a cohort design for meta-analysis. Stat Med. 1987; 6:11–29.

28. Egger M, Davey Smith G, Schneider M, Minder C. Bias in meta-analysis detected by a simple, graphical test. BMJ. 1997; 315:629–34.

30. Schmid CH. Exploring heterogeneity in randomized trials via meta-analysis*. Drug Inf J. 1999; 33:211–24.

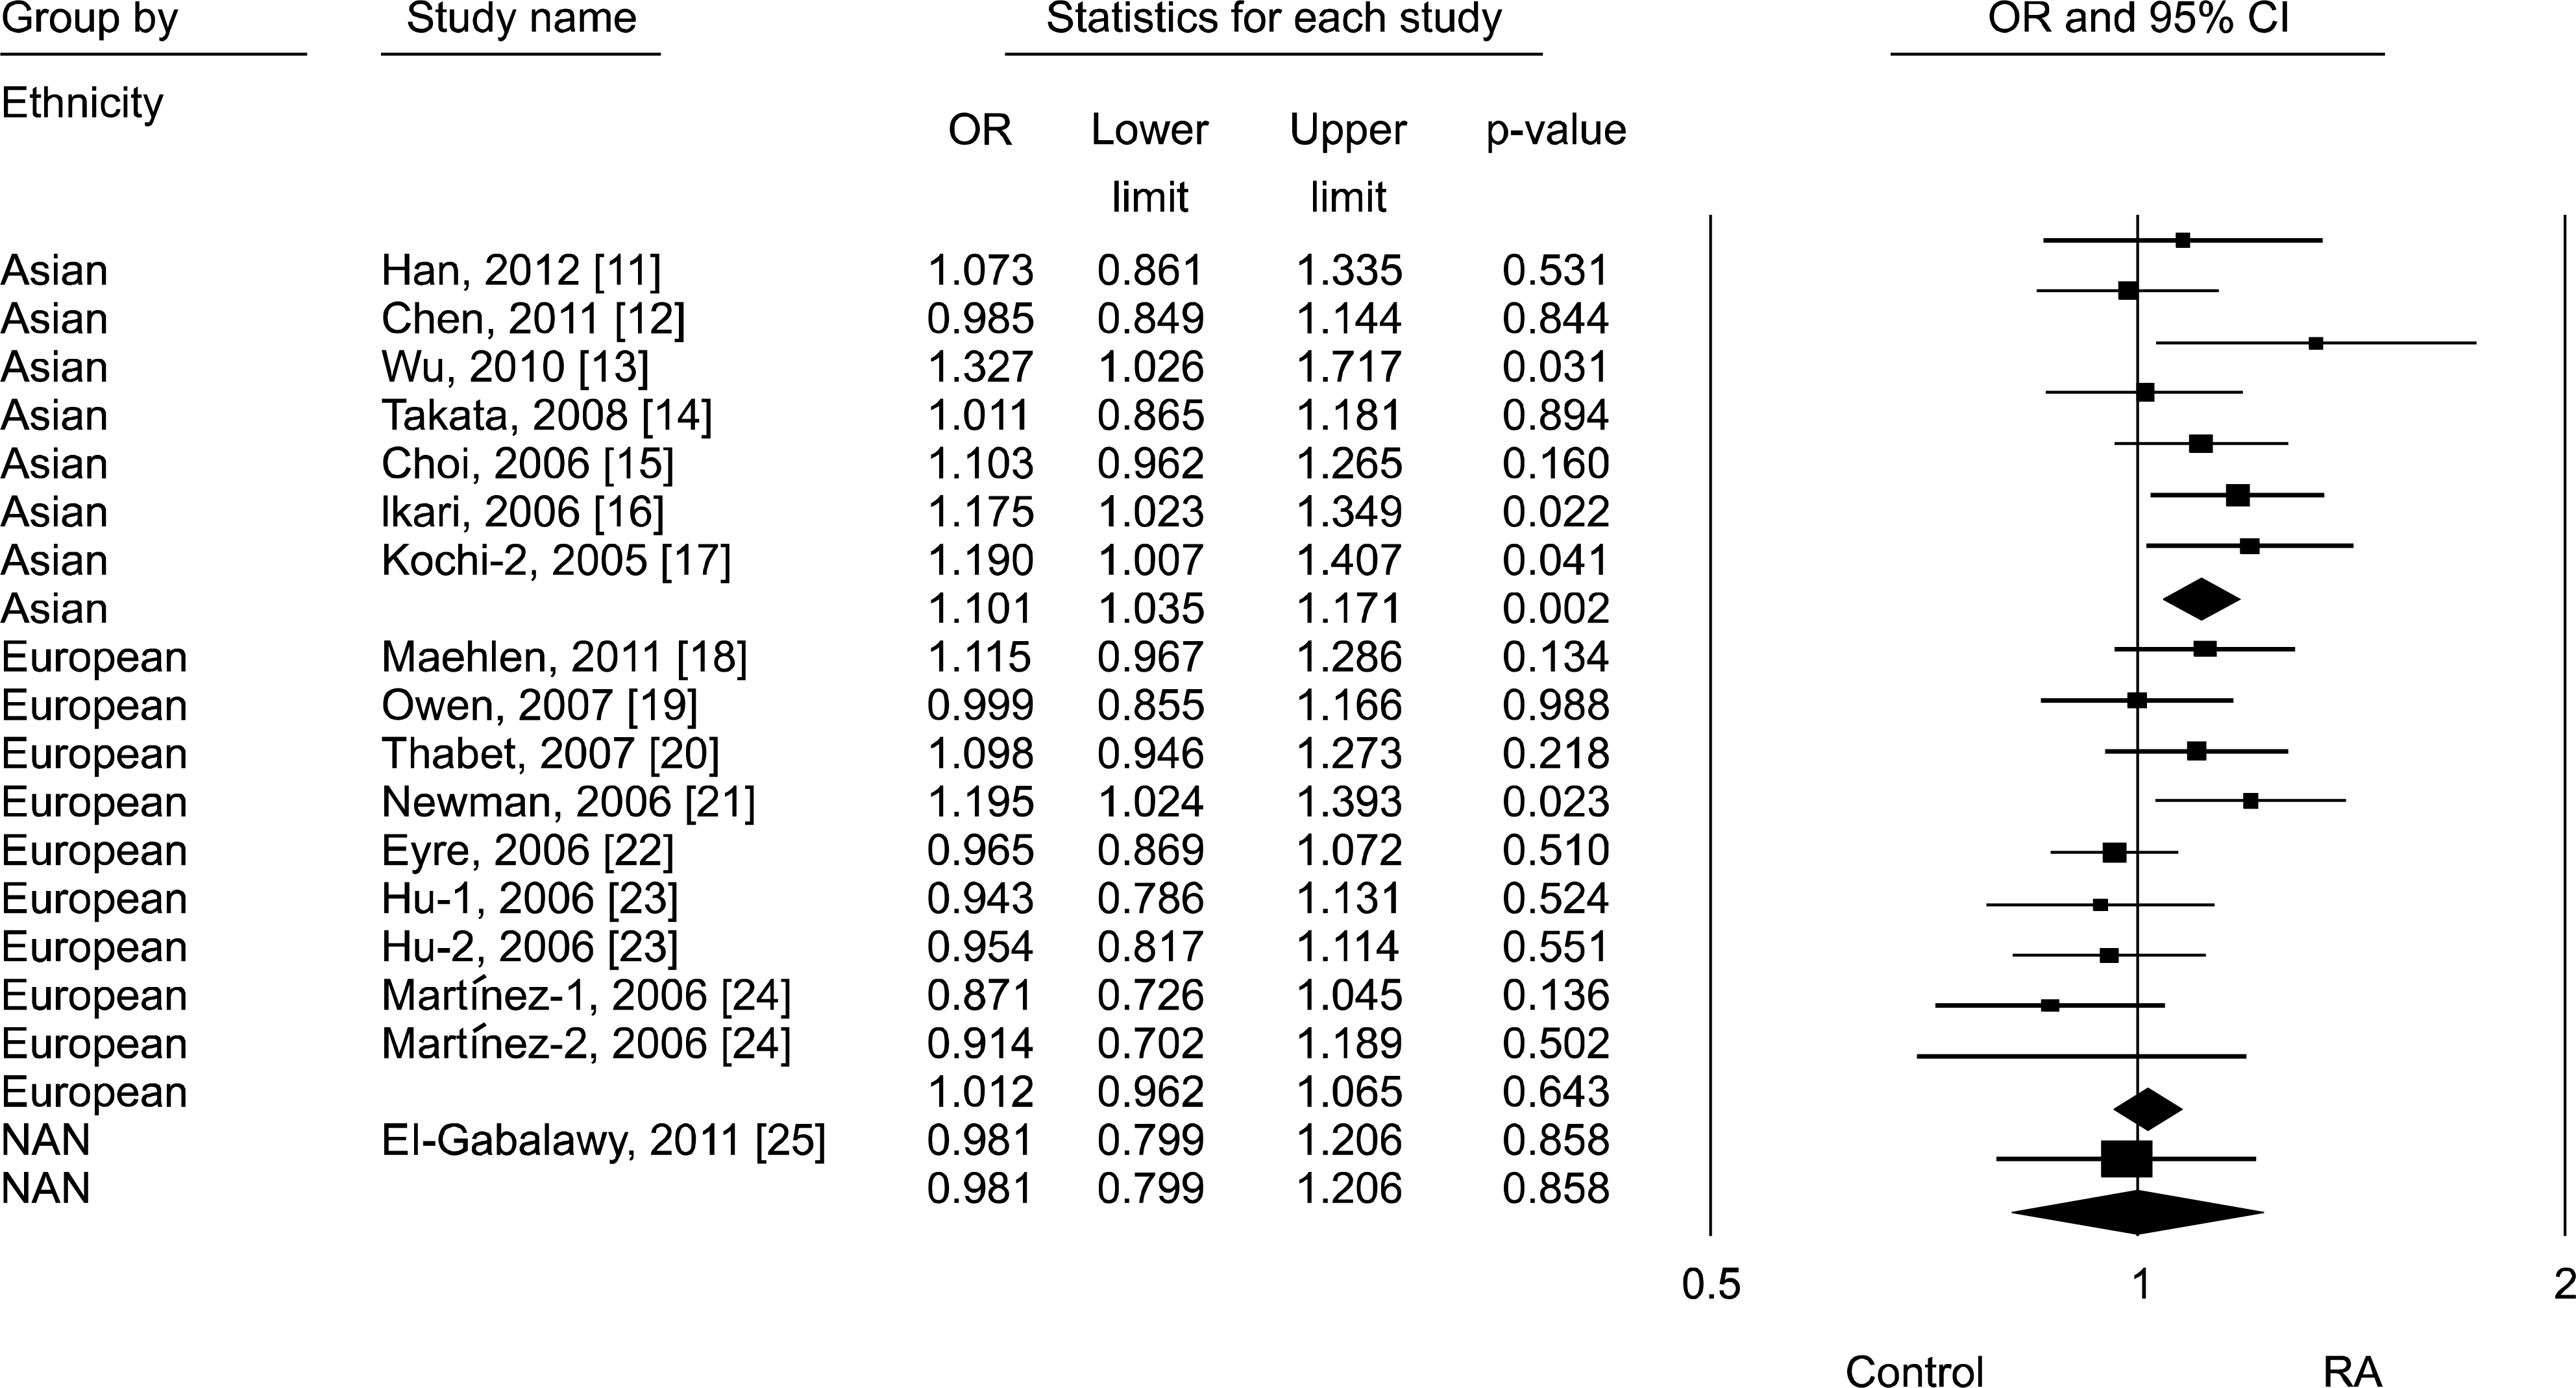
Figure 1.
Forrest plot of odds ratios (ORs) and 95% confidence interval (CIs) of individual studies and pooled data for the association between the C allele of the Fc receptor-like 3-169 C/T polymorphism and rheumatoid arthritis (RA) in each ethnic group. NAN: North American Native.

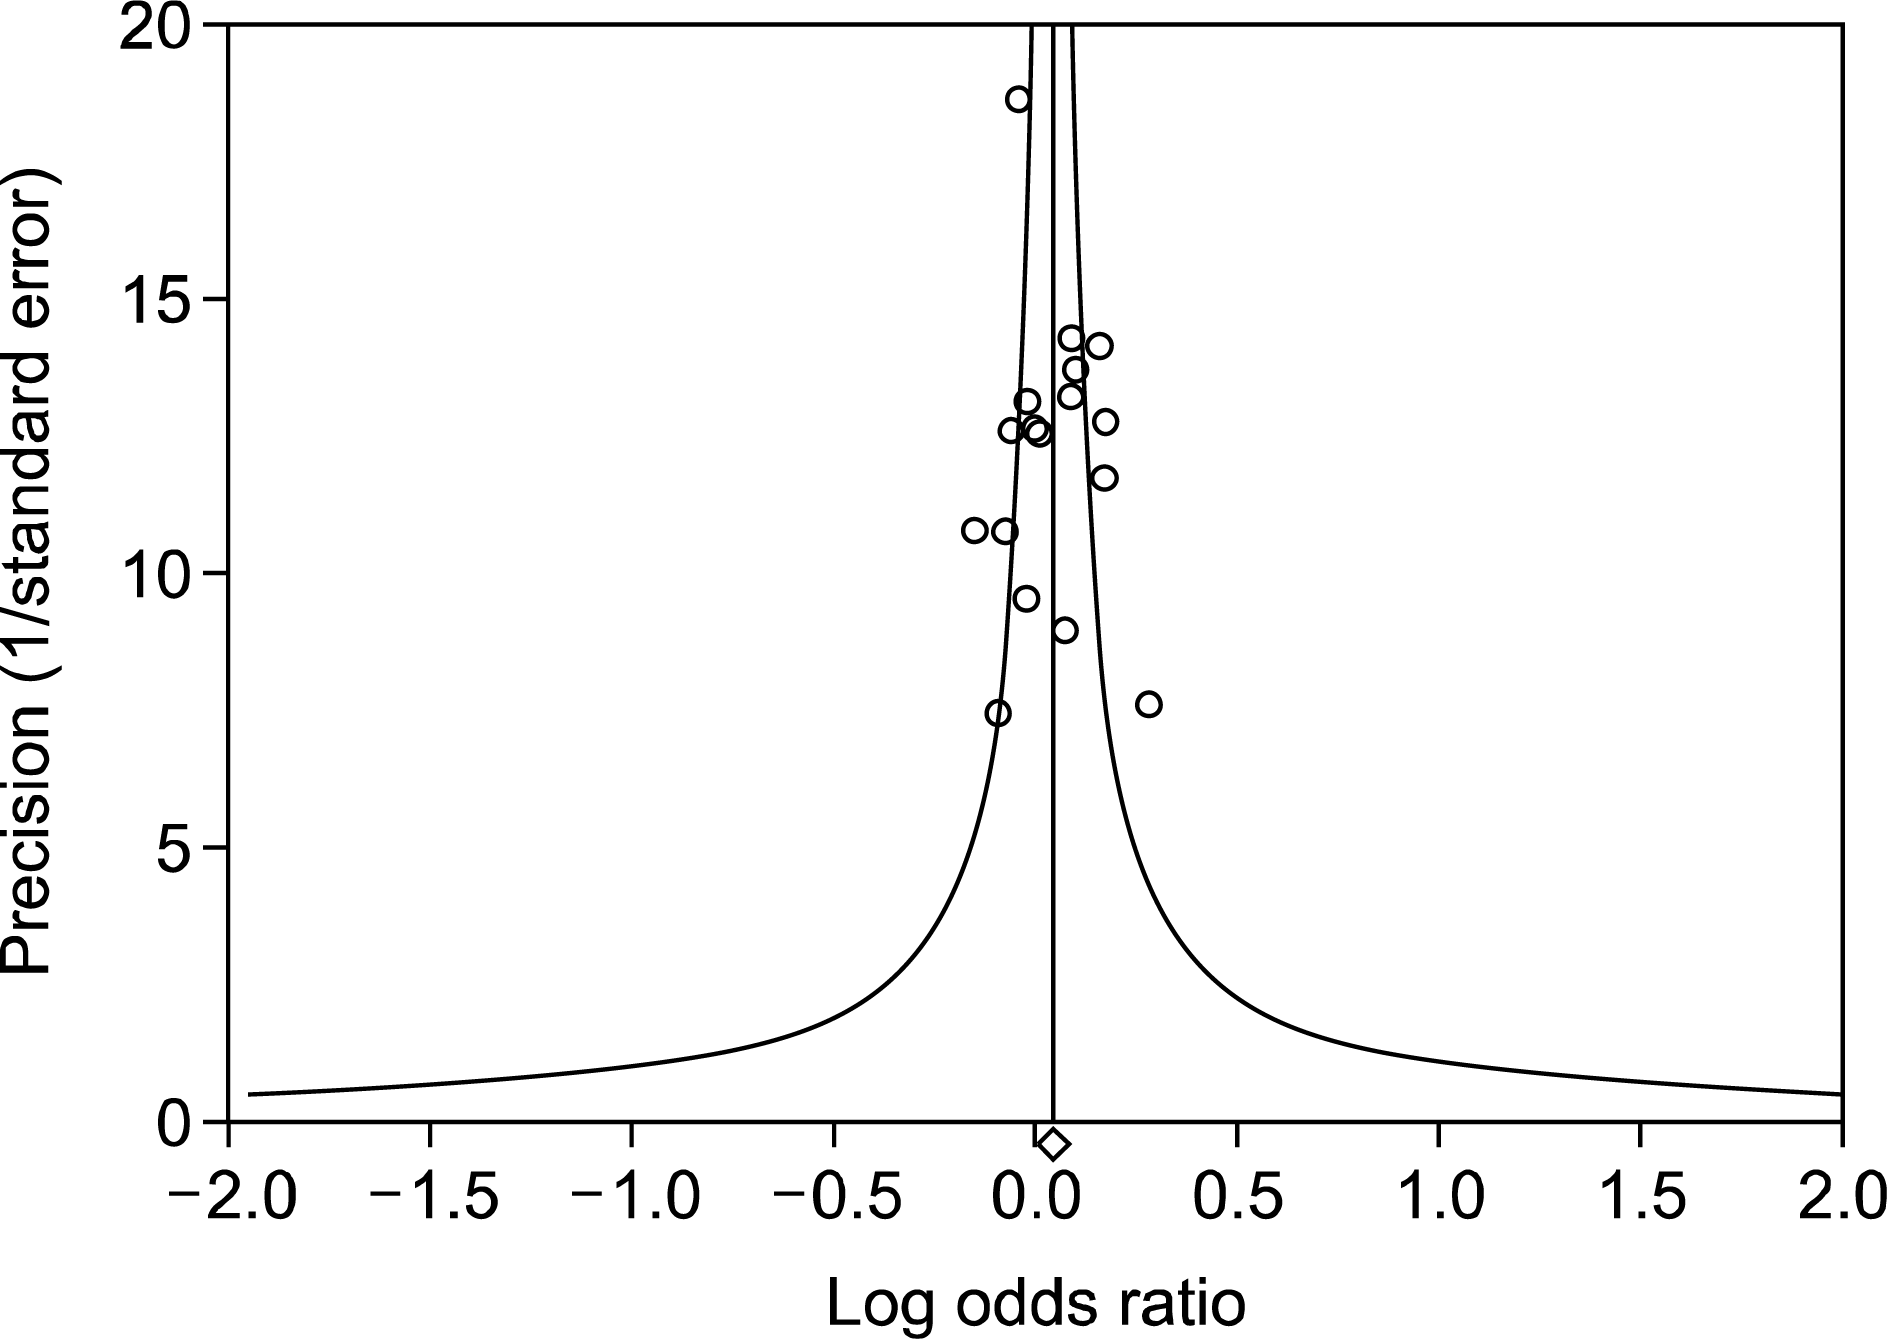
Figure 2.
Funnel plot of studies regarding the association between the Fc receptor-like 3-169 C allele and rheumatoid arthritis showed no evidence of asymmetry and Egger's regression test showed no significant p-value (Egger's regression test p-value=0.863), indicating no evidence of publication bias in the meta-analysis.

Table 1.
Process of statistical analysis of meta-analysis
Table 2.
Meta-analysis of the associations between the FCRL3-169 C/T polymorphism and rheumatoid arthritis


 PDF
PDF ePub
ePub Citation
 Print
Print


 XML Download