

 PDF
PDF ePub
ePub Citation
 Print
Print


Abstract
Objective
The purpose of this study is to evaluate the diagnostic performance of minor salivary gland biopsy (MSGB) for patients with primary Sjogren's syndrome (pSS).
Methods
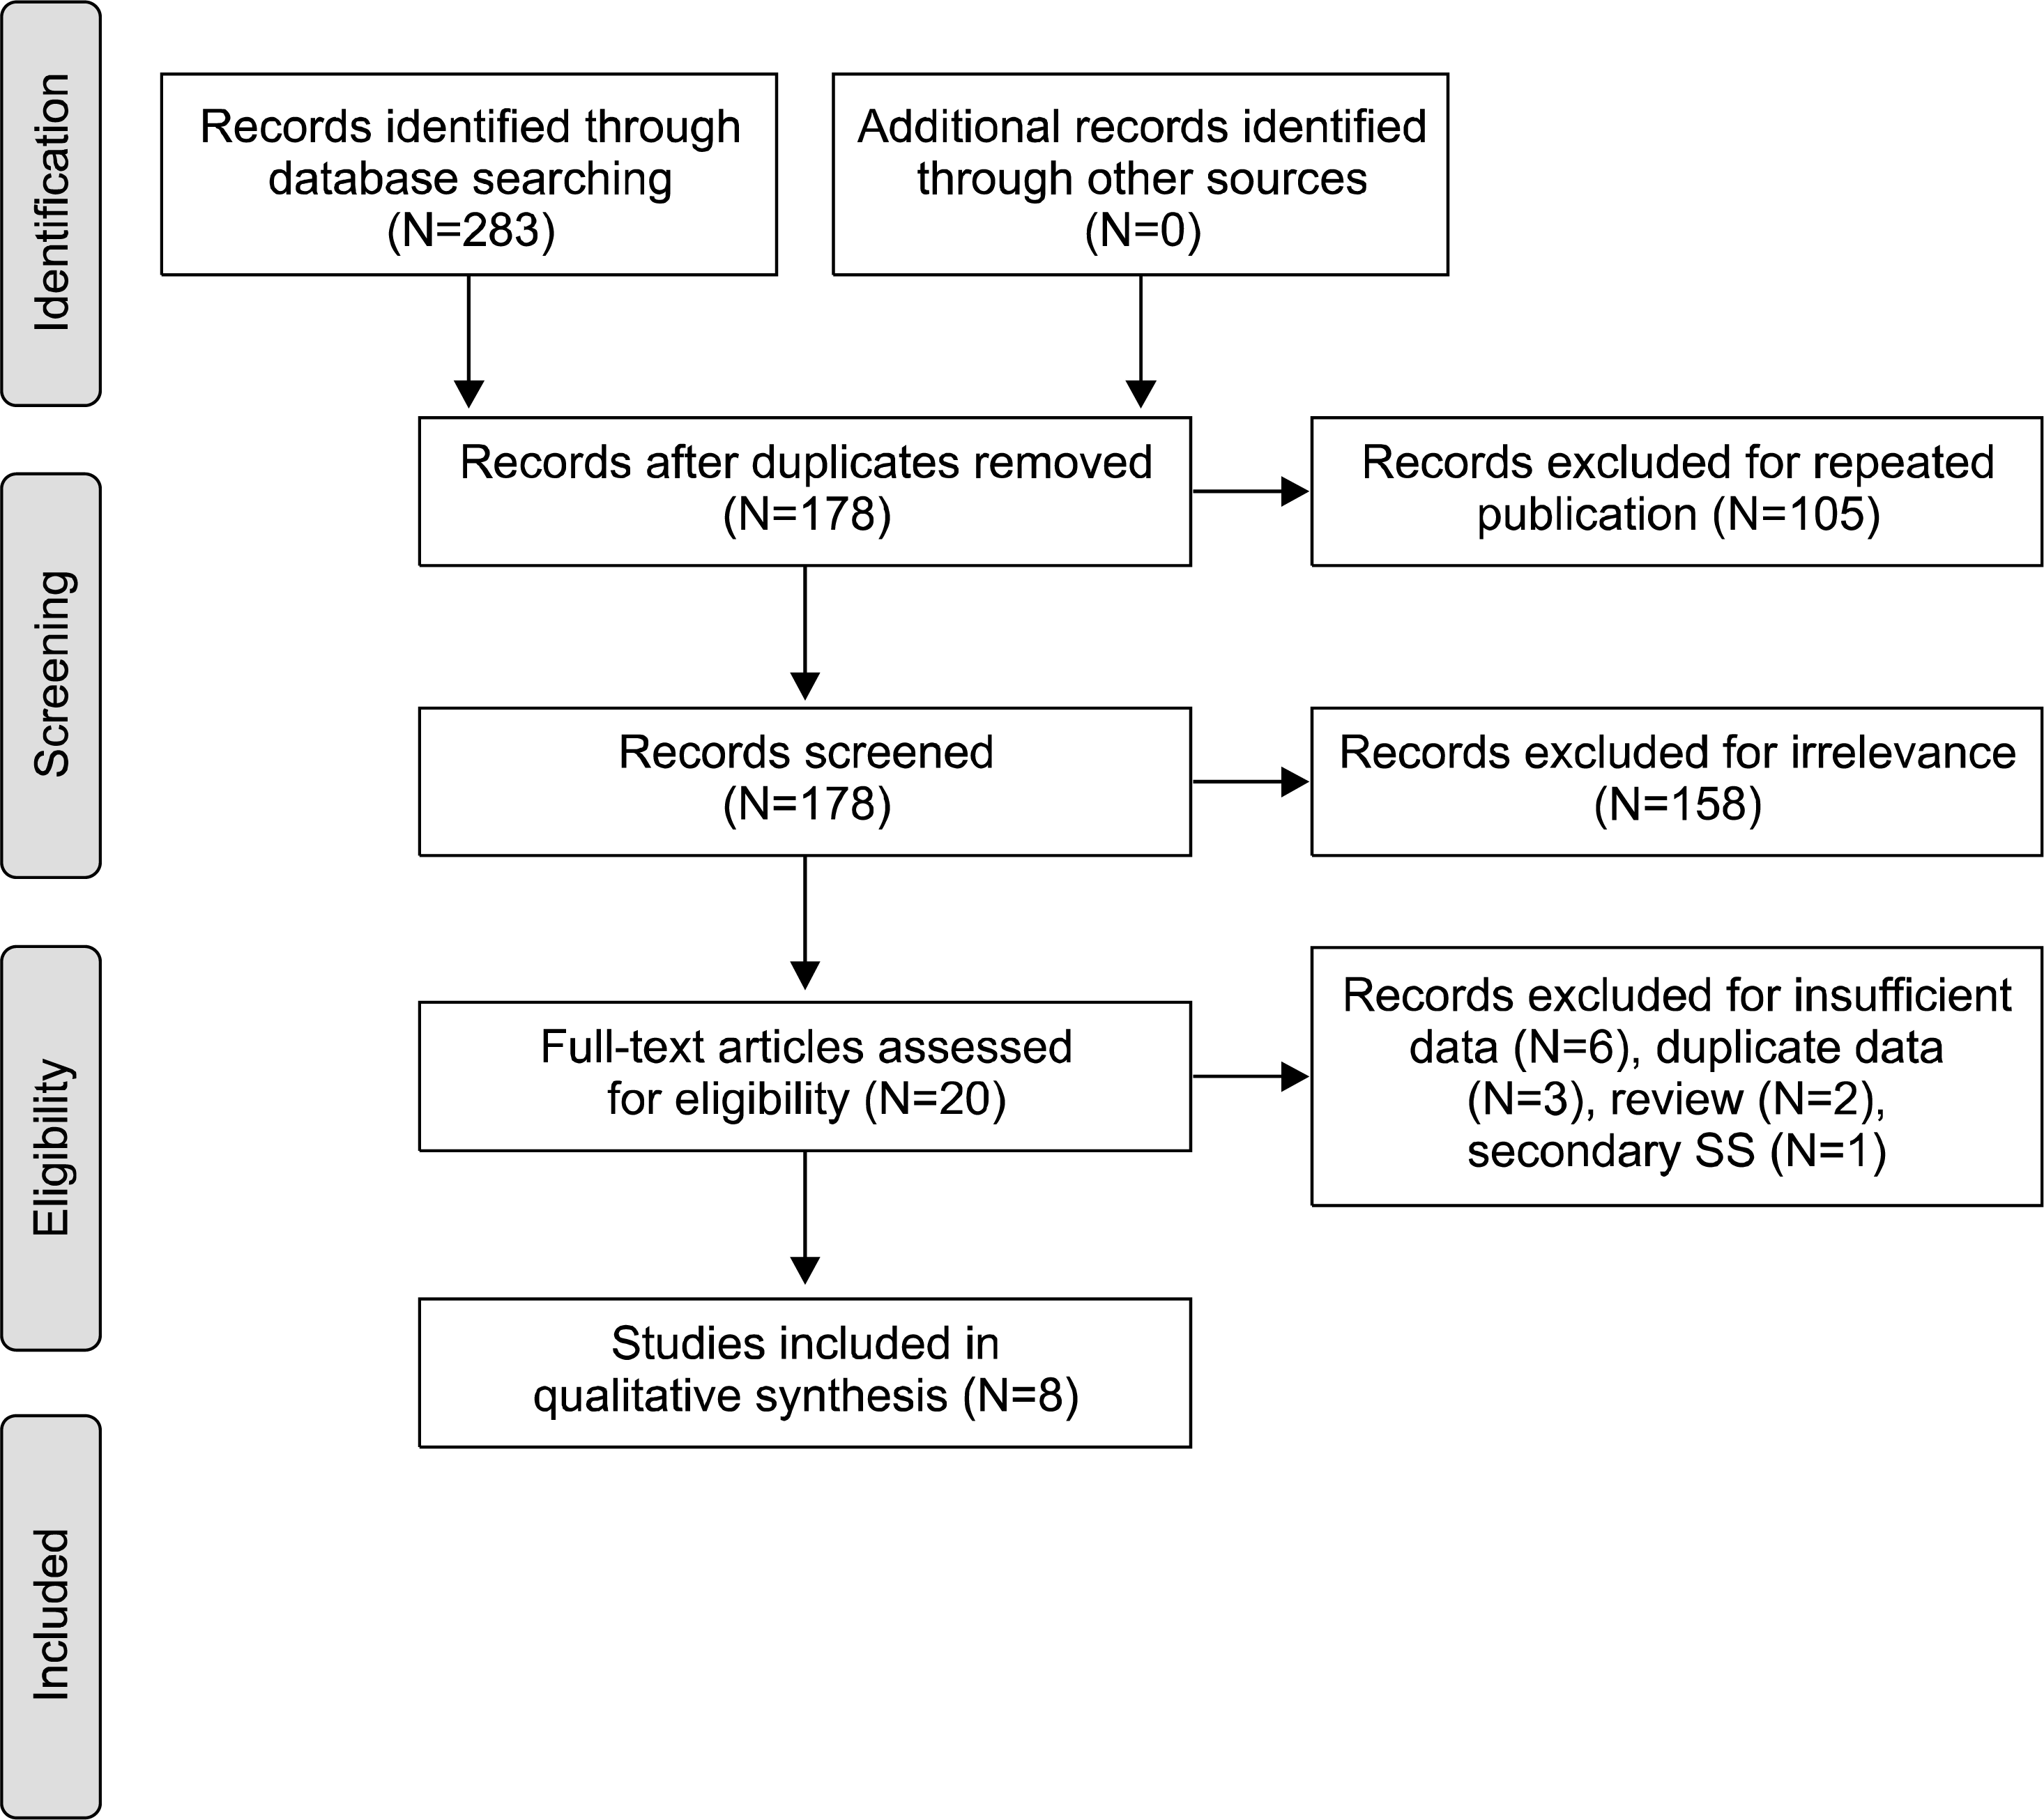
We have conducted a search from Medline, Embase, and Cochrane Library databases, and performed a meta-analysis on the diagnostic accuracy of MSGB in pSS patients.
Results
A total of eight studies, including 583 pSS and 627 non-pSS patients, were available for the meta-analysis. The pooled sensitivity and specificity of MSGB were 75.7% (95% confidence interval [CI], 72.0∼79.1) and 90.7% (88.1∼92.9), respectively. The positive likelihood ratio, negative likelihood ratio, and diagnostic odds ratio were 9.475 (4.051∼22.16), 0.266 (0.208∼0.340), and 38.92 (19.12∼72.21), respectively. The area under the curve was 0.901 and the Q* index was 0.902, indicating a high diagnostic accuracy. Some between-study heterogeneity was found in the meta-analyses; however, there was no evidence of a threshold effect (Spearman correlation co-efficient=0.419; p=0.301). Meta-regression showed that the study quality, sample size, study design, and diagnostic criteria were not sources of heterogeneity, and subgroup meta-analyses did not change the overall diagnostic accuracy.
Go to : 
REFERENCES
1. Kruszka P, O'Brian RJ. Diagnosis and management of Sjö gren syndrome. Am Fam Physician. 2009; 79:465–70.
2. Vitali C, Bombardieri S, Jonsson R, Moutsopoulos HM, Alexander EL, Carsons SE, et al. European Study Group on Classification Criteria for Sjö gren's Syndrome. Classification criteria for Sjö gren's syndrome: a revised version of the European criteria proposed by the American-European Consensus Group. Ann Rheum Dis. 2002; 61:554–8.
3. Shiboski SC, Shiboski CH, Criswell L, Baer A, Challacombe S, Lanfranchi H, et al. Sjö gren's International Collaborative Clinical Alliance (SICCA) Research Groups. American College of Rheumatology classification criteria for Sjö gren's syndrome: a da-ta-driven, expert consensus approach in the Sjö gren's International Collaborative Clinical Alliance cohort. Arthritis Care Res (Hoboken). 2012; 64:475–87.
4. van Stein-Callenfels D, Tan J, Bloemena E, van Vugt RM, Voskuyl AE, Santana NT, et al. The role of a labial salivary gland biopsy in the diagnostic procedure for Sjö gren's syndrome; a study of 94 cases. Med Oral Patol Oral Cir Bucal. 2014; 19:e372–6.
5. Cornec D, Jousse-Joulin S, Pers JO, Marhadour T, Cochener B, Boisramé-Gastrin S, et al. Contribution of salivary gland ultrasonography to the diagnosis of Sjö gren's syndrome: toward new diagnostic criteria? Arthritis Rheum. 2013; 65:216–25.
6. Obinata K, Sato T, Ohmori K, Shindo M, Nakamura M. A comparison of diagnostic tools for Sjö gren syndrome, with emphasis on sialography, histopathology, and ultrasonography. Oral Surg Oral Med Oral Pathol Oral Radiol Endod. 2010; 109:129–34.
7. Nakamura H, Kawakami A, Iwamoto N, Okada A, Yamasaki S, Tamai M, et al. A single centre retrospective analysis of AECG classification criteria for primary Sjogren's syndrome based on 112 minor salivary gland biopsies in a Japanese population. Rheumatology (Oxford). 2010; 49:1290–3.

8. Milic VD, Petrovic RR, Boricic IV, Marinkovic-Eric J, Radunovic GL, Jeremic PD, et al. Diagnostic value of salivary gland ultrasonographic scoring system in primary Sjogren's syndrome: a comparison with scintigraphy and biopsy. J Rheumatol. 2009; 36:1495–500.
9. Yazisiz V, Avci AB, Erbasan F, Kiriş E, Terzioğlu E. Diagnostic performance of minor salivary gland biopsy, serological and clinical data in Sjö gren's syndrome: a retrospective analysis. Rheumatol Int. 2009; 29:403–9.
10. Caporali R, Bonacci E, Epis O, Bobbio-Pallavicini F, Morbini P, Montecucco C. Safety and usefulness of minor salivary gland biopsy: retrospective analysis of 502 procedures performed at a single center. Arthritis Rheum. 2008; 59:714–20.
11. Teppo H, Revonta M. A follow-up study of minimally invasive lip biopsy in the diagnosis of Sjö gren's syndrome. Clin Rheumatol. 2007; 26:1099–103.
12. Kessel A, Toubi E, Rozenbaum M, Zisman D, Sabo E, Rosner I. Sjö gren's syndrome in the community: can serology replace salivary gland biopsy? Rheumatol Int. 2006; 26:337–9.
13. Song GG, Lee YH. Diagnostic accuracies of sialography and salivary ultrasonography in Sjö gren's syndrome patients: a meta-analysis. Clin Exp Rheumatol. 2014; 32:516–22.
14. Whiting P, Rutjes AW, Reitsma JB, Bossuyt PM, Kleijnen J. The development of QUADAS: a tool for the quality assessment of studies of diagnostic accuracy included in systematic reviews. BMC Med Res Methodol. 2003; 3:25.
15. Higgins JP, Thompson SG. Quantifying heterogeneity in a meta-analysis. Stat Med. 2002; 21:1539–58.
16. Egger M, Smith GD, Phillips AN. Meta-analysis: principles and procedures. BMJ. 1997; 315:1533–7.
17. DerSimonian R, Laird N. Meta-analysis in clinical trials. Control Clin Trials. 1986; 7:177–88.
18. Lijmer JG, Bossuyt PM, Heisterkamp SH. Exploring sources of heterogeneity in systematic reviews of diagnostic tests. Stat Med. 2002; 21:1525–37.
19. Zamora J, Abraira V, Muriel A, Khan K, Coomarasamy A. Meta-DiSc: a software for meta-analysis of test accuracy data. BMC Med Res Methodol. 2006; 6:31.
20. Goules AV, Tzioufas AG, Moutsopoulos HM. Classification criteria of Sjö gren's syndrome. J Autoimmun. 2014; 48-49:42–5.
21. Egger M, Smith GD. Meta-Analysis. Potentials and promise. BMJ. 1997; 315:1371–4.
22. Guellec D, Cornec D, Jousse-Joulin S, Marhadour T, Marcorelles P, Pers JO, et al. Diagnostic value of labial minor salivary gland biopsy for Sjö gren's syndrome: a systematic review. Autoimmun Rev. 2013; 12:416–20.
Go to :
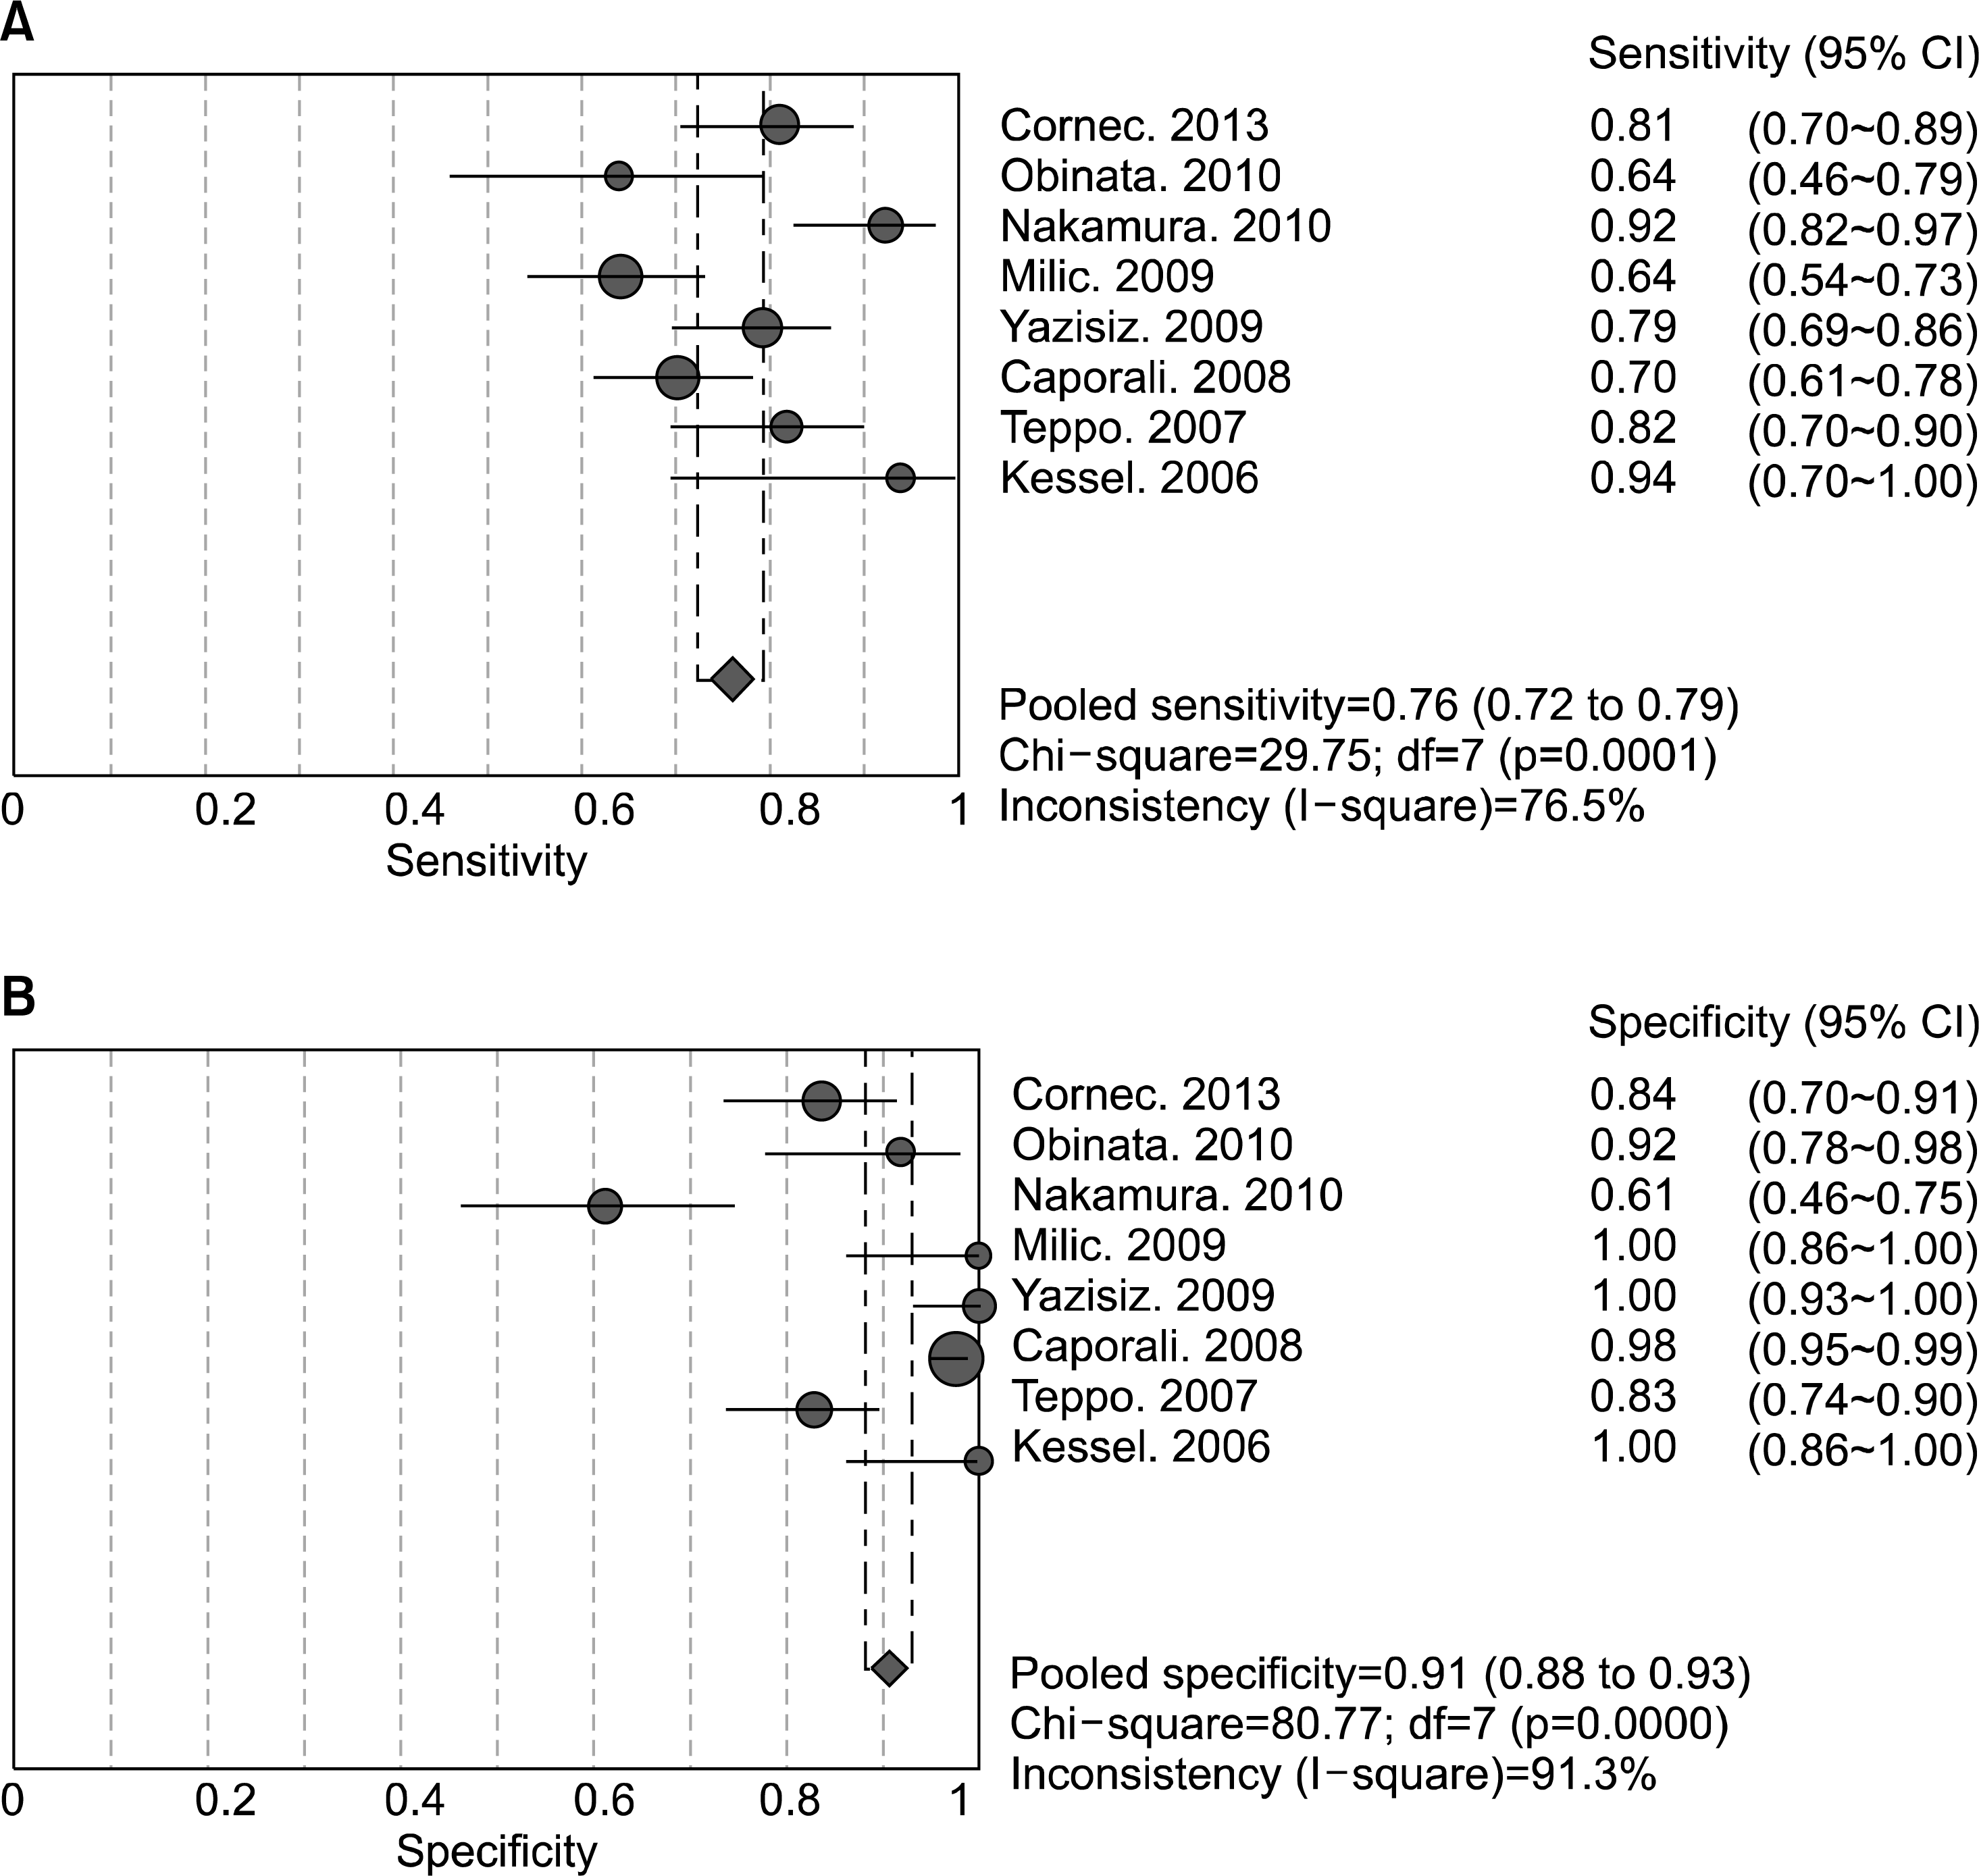 | Figure 2.Sensitivity (A) and specificity (B) estimates for minor salivary gland biopsy for the diagnosis of primary Sjogren's syndrome. Circles and lines represent point estimates and 95% confidence intervals, respectively. Circled areas represent relative study sizes. |
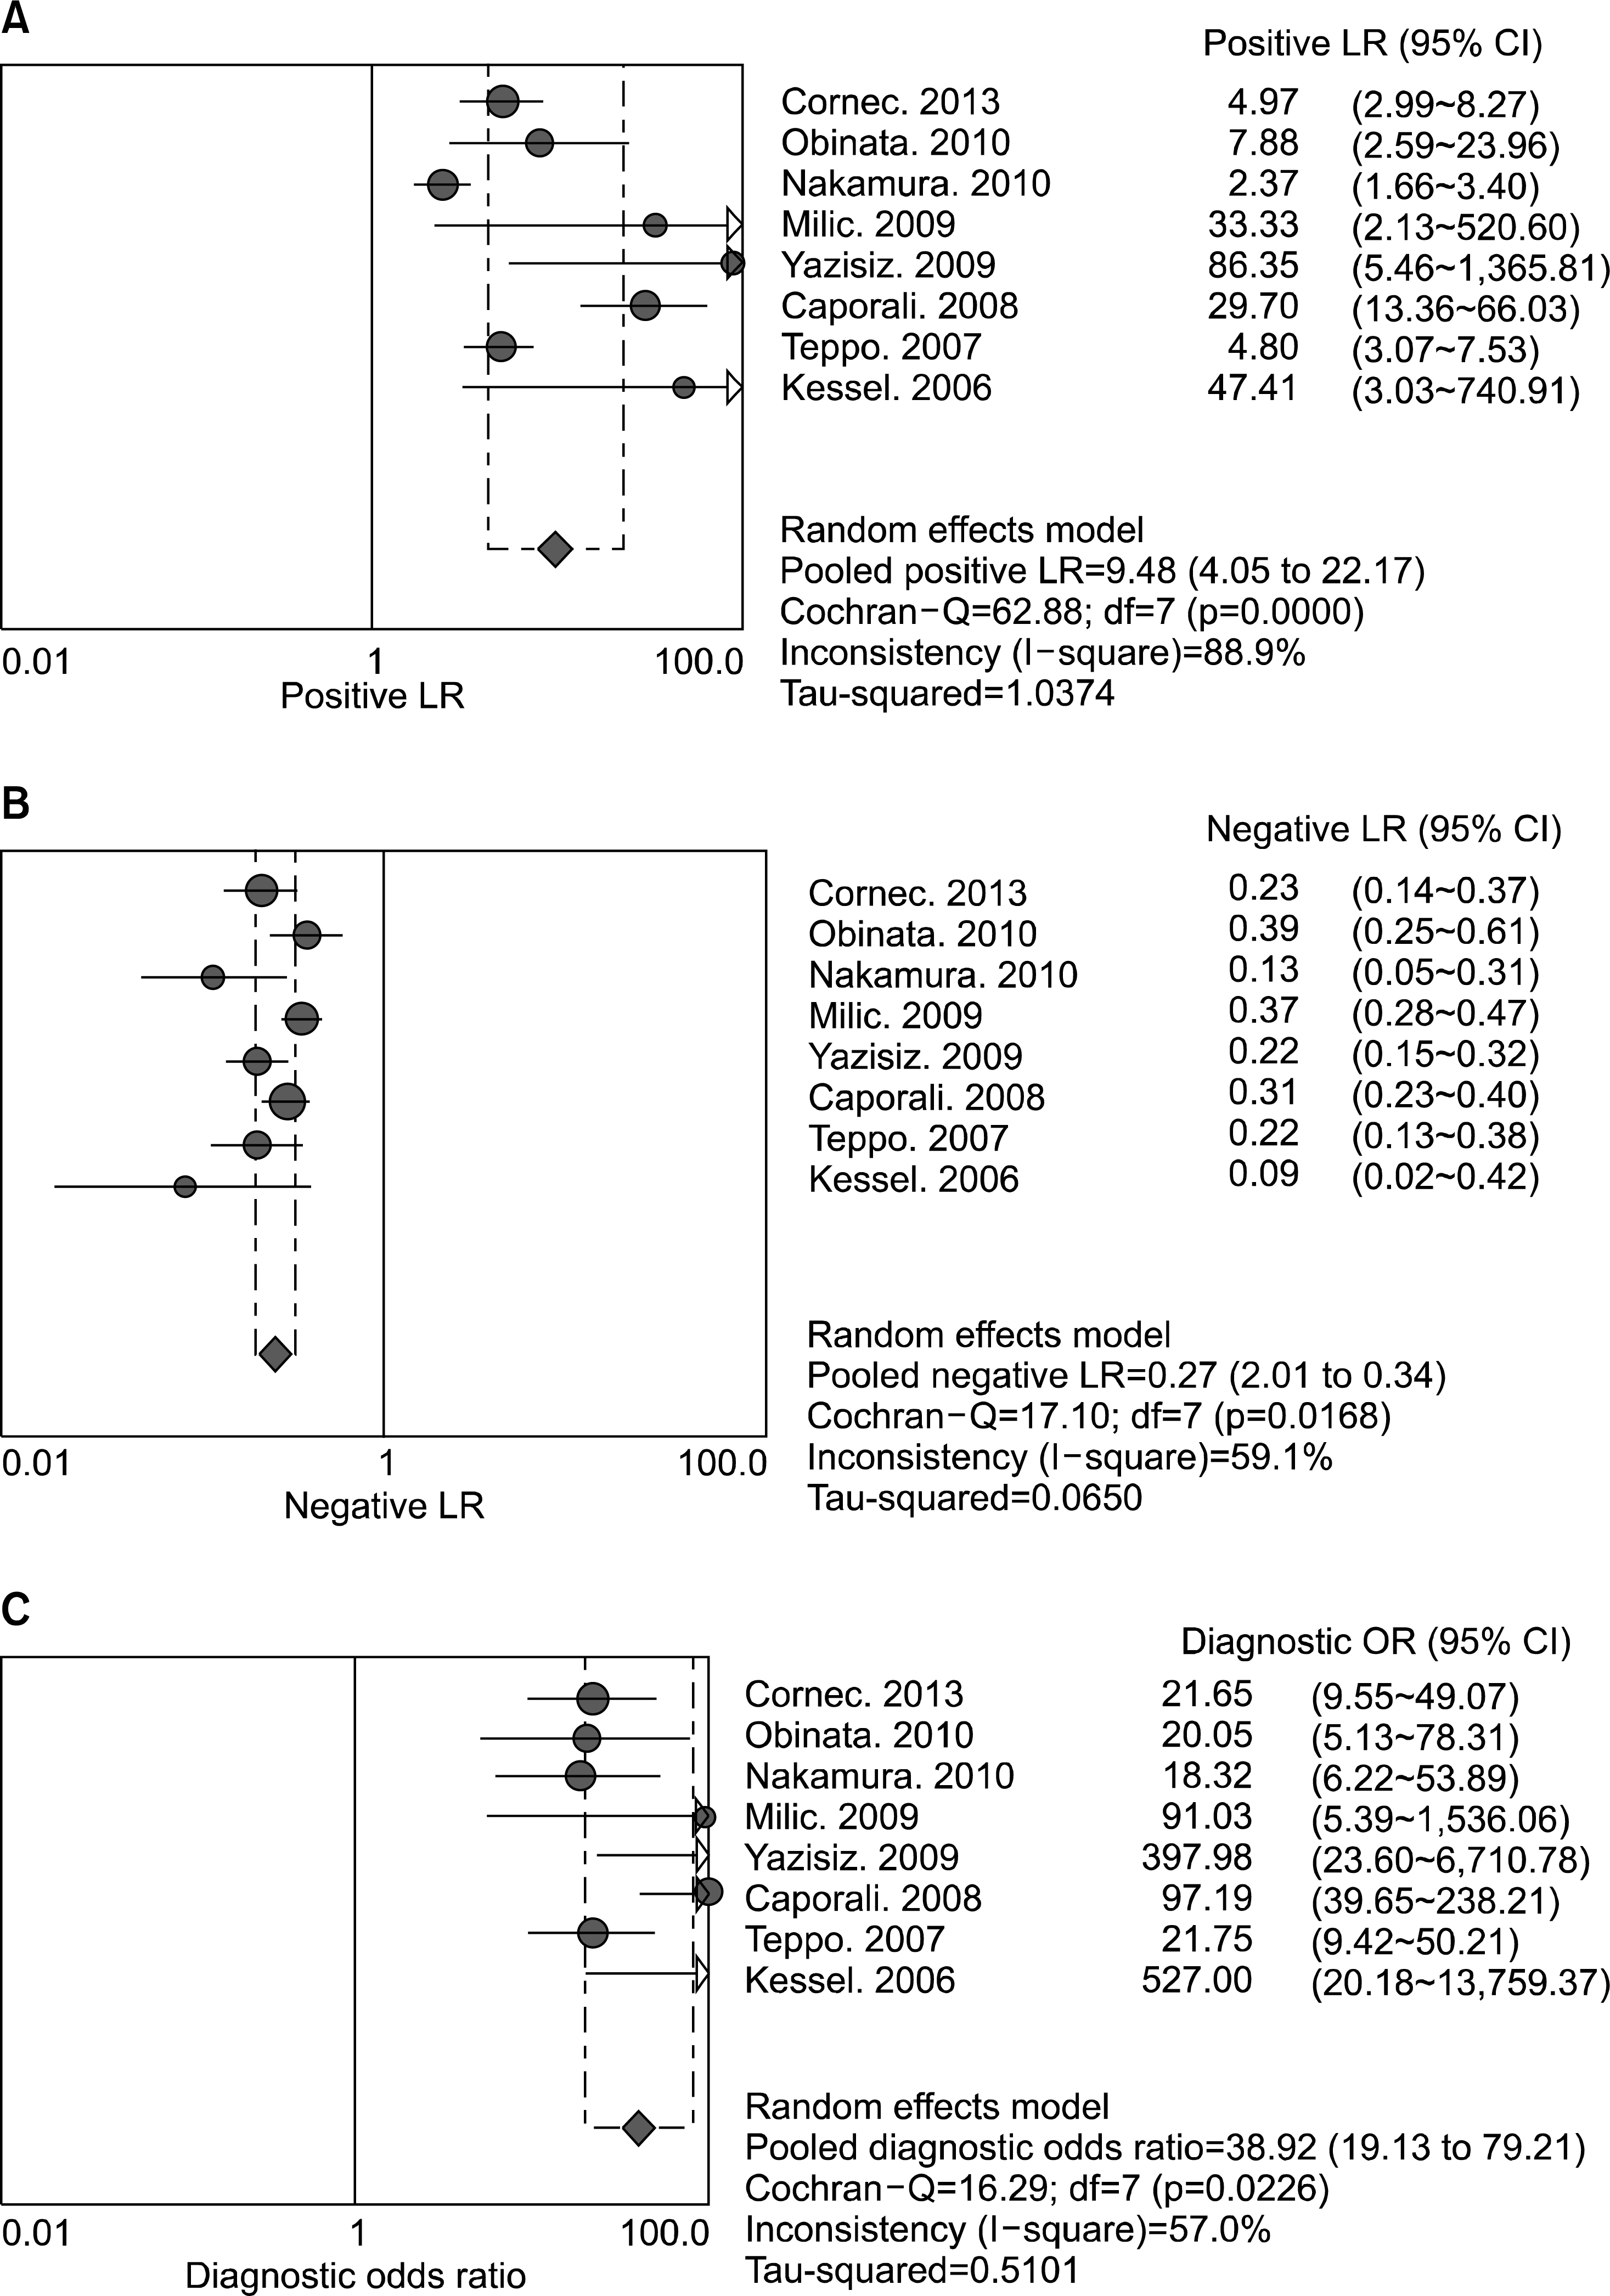 | Figure 3.Positive (A) and negative (B) likelihood ratios, and diagnostic odds ratio (C) estimates for minor salivary gland biopsy for the diagnosis of primary Sjogren's syndrome. Circles and lines represent point estimates and 95% confidence intervals, respectively. Circled areas represent the relative study size. |
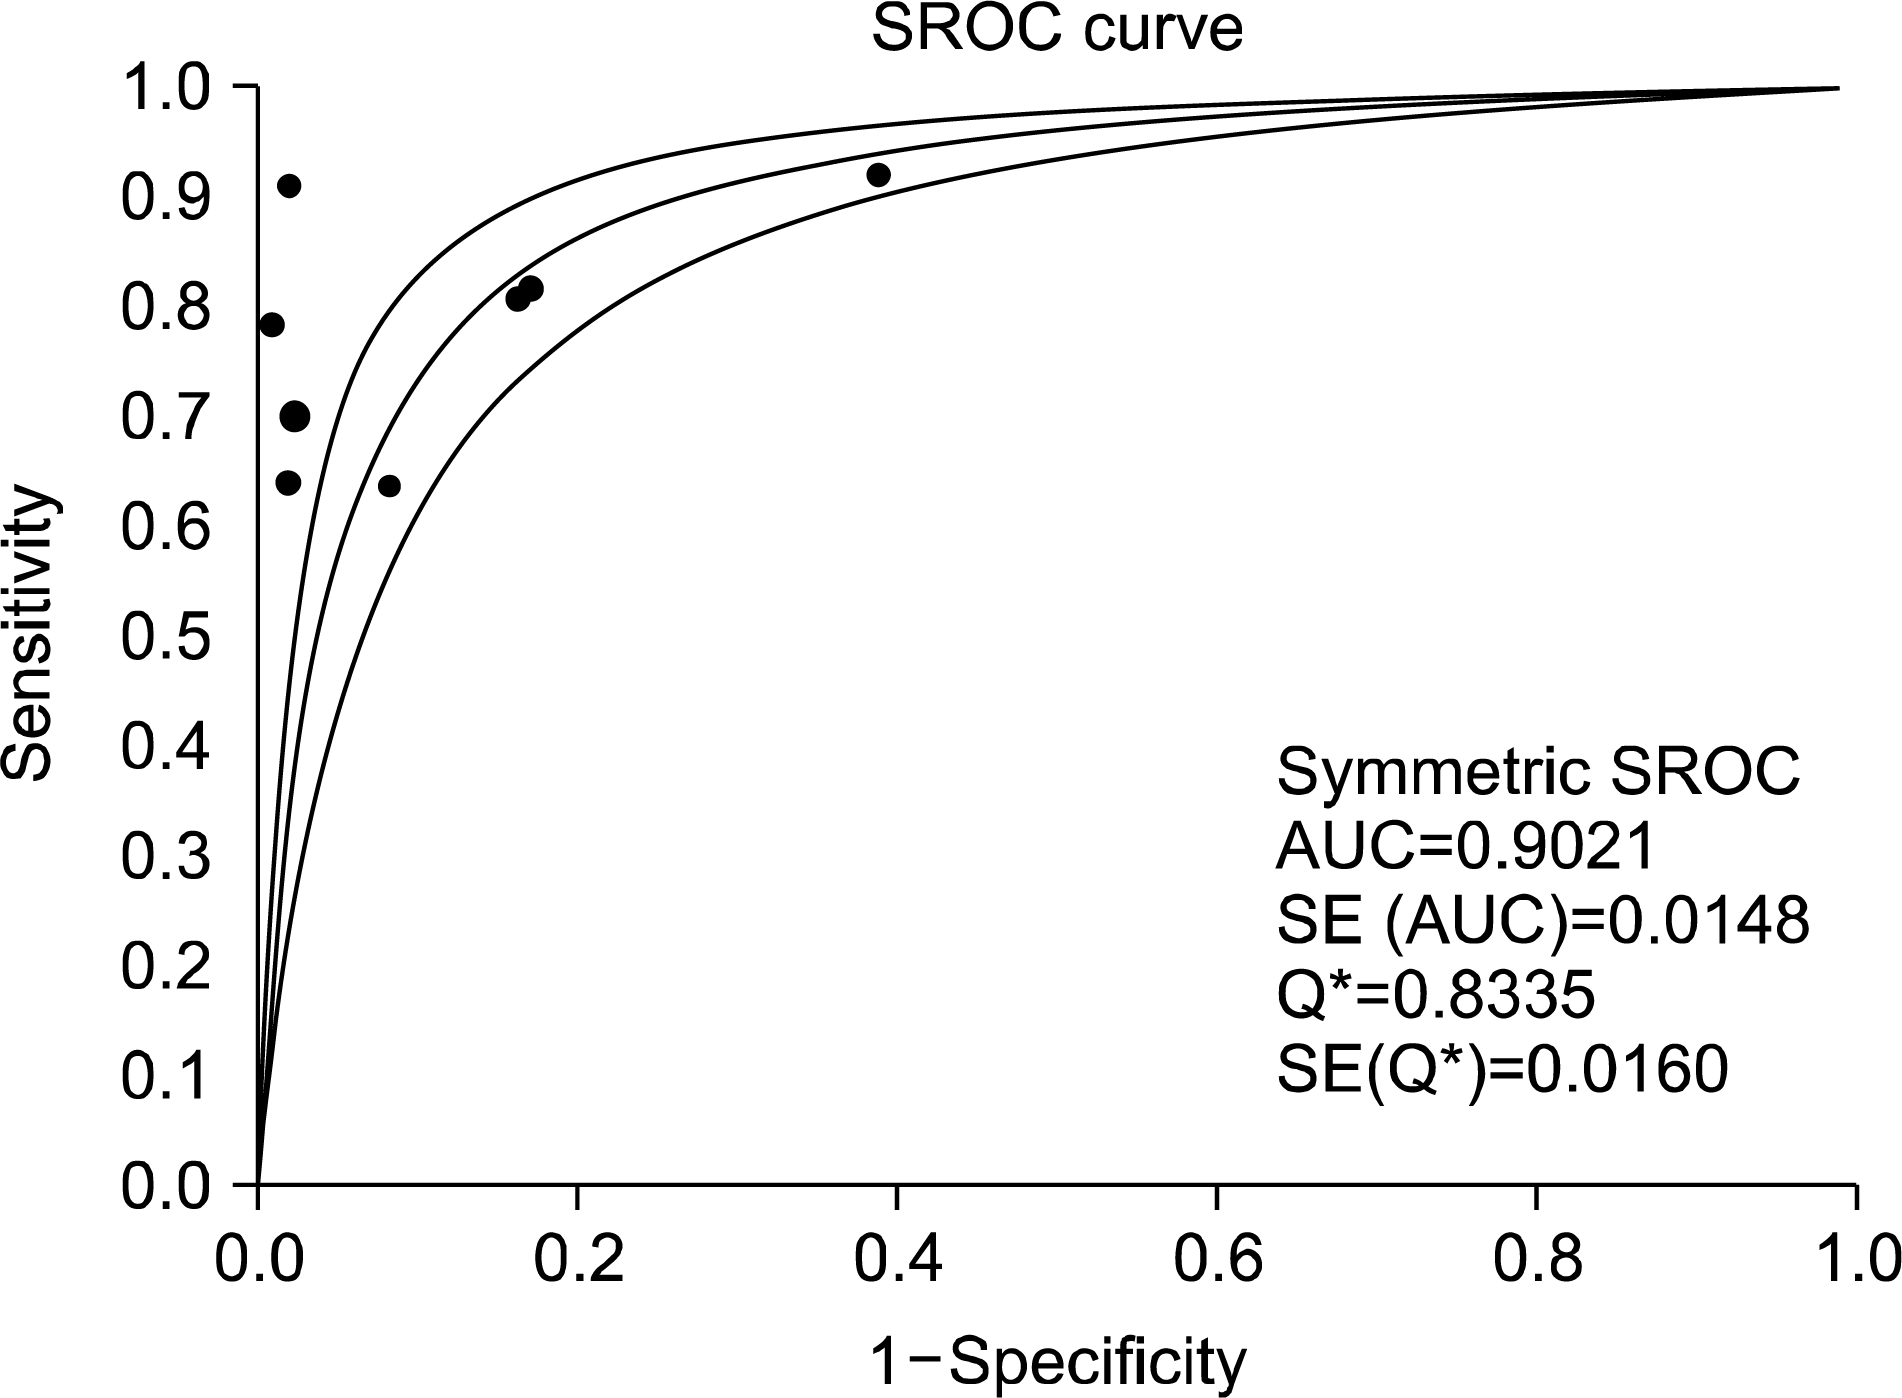 | Figure 4.Summary receiver-operating characteristic curves for minor salivary gland biopsy for the diagnosis of primary Sjogren's syndrome. Solid circles represent individual studies included in this meta-analysis. The curve shown is a regression line that summarizes the overall diagnostic accuracy. SE (AUC): standard error of the area under the curve, Q*: an index defined by the point on the SROC curve where the sensitivity and specificity are equal, SE(Q*): Q* index standard error. |
Table 1.
Characteristics of individual studies included in the meta-analysis
| Author | Country | Diagnostic criteria | pSS | Non-pSS | Study design | Cut-off | TP | TN | FN | FP | Anti-Ro (%) | Anti-La (%) | Study quality* |
|---|---|---|---|---|---|---|---|---|---|---|---|---|---|
| Cornec, 2013 (5) | France | Expert Opinion | 78 | 80 | Prospective | FS ≥1 | 63 | 67 | 15 | 13 | 56.4† | Na | 10 |
| Obinata, 2010 (6) | Japan | Revised Japanese criteria | 36 | 37 | Retrospective | FS ≥1 | 23 | 34 | 13 | 3 | Na | Na | 12 |
| Nakamura, 2010 (7) | Japan | AECG | 63 | 49 | Retrospective | FS ≥1 | 58 | 30 | 5 | 19 | 58.7 | 17.5 | 11 |
| Milic, 2009 (8) | Serbia | AECG | 107 | 28 | Prospective | FS ≥1 | 70 | 28 | 37 | 0 | Na | Na | 10 |
| Yazisiz, 2009 (9) | Turkey | AECG | 99 | 54 | Retrospective | FS ≥1 | 78 | 54 | 21 | 0 | 17.7 | 8.3 | 10 |
| Caporali, 2008 (10) | Italy | AECG | 124 | 254 | Retrospective | Cumulative FS ≥1 | 87 | 248 | 37 | 6 | 80.6 | 29.6 | 11 |
| Teppo, 2007 (11) | Finland | AECG | 60 | 100 | Retrospective | FS ≥1 | 49 | 83 | 11 | 17 | Na | Na | 11 |
| Kessel, 2006 (12) | Israel | AECG | 16 | 25 | Prospective | FS ≥1 | 15 | 25 | 1 | 0 | 62.5 | 37.5 | 9 |
Table 2.
Summary results of the meta-analysis
Table 3.
Estimates of summary receiver operating characteristic curve parameters
Table 4.
Meta-regression analysis of potential sources of heterogeneity
 XML Download