

 PDF
PDF ePub
ePub Citation
 Print
Print


INTRODUCTION
The prevalence of allergic rhinitis (AR) varies across countries because of different economic conditions, level of industrialization, contrasting allergen exposure, and lifestyle. Although there are differences in AR prevalence, an increasing trend is consistently observed worldwide [1]. In the Asia-Pacific region in particular, there is a reported significant increase in prevalence, especially among the low and medium-income countries [2]. AR, being a chronic condition, significantly affects quality of life and reduces productivity and performance, resulting to a higher socioeconomic burden [34]. AR comorbidities such as asthma, atopic dermatitis, sleep disordered breathing, rhinosinusitis, and otitis media similarly impact on quality of life [5]. Several studies document patient perception on quality of life, compliance, and satisfaction with treatment of AR. Most of these studies report that patients consider AR to have a significant impact on their quality of life [678]. In an Asia-Pacific study of 1,043 adults, of which 80 were Filipinos, nearly half of the respondents report that AR caused impairments in daily activities and sleep. Impact on quality of life is reported to be highest for the Philippines [9]. However, in developing countries like the Philippines, healthcare access and usage may vary according to socioeconomic class (SEC). Knowledge of the effect of this variable on patient attitudes, practices, and health seeking behavior allows better understanding of compliance and adherence to treatment. The results may help guide the formulation of strategies for the prevention and management of AR. Therefore, this study seeks to survey Filipino adults across 3 socioeconomic groups on their awareness of, attitudes on, and practices regarding AR.
MATERIALS AND METHODS
Respondents
This study was approved by the Institutional Scientific and Ethical Review Boards of St. Luke's Medical Center. A cross section of Filipinos living in the National Capital Region, aged 20–54 years old, who had clinically defined AR, and were the decision maker or mostly the decision maker for healthcare in their household needs/purchases were surveyed from December 2014 to February 2015. Excluded were physicians, pharmacists, nurses, nutritionists, healthcare practitioners, their immediate family members, close friends or employees and those who were employed, had immediate family members, or close friends engaged or employed in the following sectors: manufacture/distribution/supply of pharmaceutical products, mass media, market research agencies, advertising, public relations, promotion agencies, supermarket, grocery, sari-sari stores, drugstore and convenience stores.
Weights were applied to reflect the population distribution of the 3 SECs (ABC1, C2, DE) in the Philippines. The target sample size was 300 (unweighted)/301 (weighted) for a margin of error of 5.7%. Sample size was based on budgetary constraints (i.e., the cost for a third party research agency to conduct the field surveys).
Questionnaire
A questionnaire, modeled after previously published surveys, was designed for this study. The questionnaire was divided into three domains to address awareness, attitudes, and practices. Questions under the awareness domain were designed to assess knowledge on the symptoms and management of AR. Questions under the attitudes domain were designed to assess need for medical consultation, satisfaction with medications/interventions used, and satisfaction with medical care received for AR. For the domain on practices, questions were designed to elicit most commonly used medications/interventions for AR and compliance with self or physician prescribed medications/interventions. The questionnaire was translated into English and Pilipino; it was validated and pilot tested for clarity as a survey tool.
Data collection, encoding, and analysis
A computerized list of the 1,706 barangays (i.e., the smallest local government unit in the Philippines) in the 17 cities of the National Capital Region was generated. Primary sampling units, consisting of 60 barangays with representative ABC1, C2, and DE areas, were randomly selected from the list. Secondary sampling units consisting of households were randomly selected from each representative barangay. The SEC of a household was initially based on house appearance; final household classification was based on the proprietary point system. Target number of households/barangay was 15 (5 households/SEC).
For ABC1 areas, the cluster sampling method was used. If a household selected was classified as ABC1 and the neighboring household was also identified as an ABC1 home, the second household was automatically selected for the survey. Similarly, if the next neighboring household was also classified as an ABC1 household, it was selected as the next target sample site. Sampling continued until the predetermined number 5 households/barangay was reached.
For C2 and DE areas, sampling began with a random start and subsequently every 6th house from the 1st house was selected as the next sample site (i.e., sampling interval of 5). Finally, a Kish Grid was used to identify the adult respondent from each selected household. The face to face structured interviews were conducted by experienced interviewers from the research agency GfK. To ensure accuracy of data collection, 20% of the interviews were spot checked and back checked, 10% were directly observed and all survey results were assessed for completion and consistency of data. Data was encoded on IBM SPSS Statistics ver. 22.0 (IBM Co., Armonk, NY, USA).
Weights were applied to reflect the population distribution of the 3 SECs (ABC1, C2, DE) in the Philippines. The answers for each question in the survey were reported as a percentage of the total responses/socioeconomic group. Z test was used to test for significant differences between groups. Level of significance was set at p < 0.05.
Definitions
Clinically defined AR: presence of 2 or more of the following symptoms—watery rhinorrhea, nasal obstruction, sneezing, or nasal/ocular pruritus for more than one hour per day within the last 6 months.
ARIA: Allergic Rhinitis and its Impact on Asthma
Mild AR: absence of troublesome symptoms including troubled sleep, absence of impairment of activities, leisure and/or sports, and absence of impairment at school or work (ARIA definition)
Moderate-severe AR: presence of at least 1 of the following: troublesome symptoms, troubled sleep, impairment of daily activities, leisure and/or sports, impairment of school or work (ARIA definition)
SECs were based on a proprietary point system. Households were rated according to 7 major criteria/categories: House durability, house maintenance, location of house, education of household head, occupation of household head, household income, and number of household utilities. Each major criteria/category had a corresponding number of sub items. The first 3 criteria/categories were based on the interviewer's observation. The rest of the criteria were based on the interviewee's response. The total points from all 7 criteria/categories determined the SEC of the household. The ABC1 group was pegged at 14% of the highest, C2 the next 15%, and DE the remaining 71% of household incomes in the country.
The following were the point scores used to classify each household according to the 7 criteria/categories:
SEC ABC1: point scores of 25–36, 21–31, 18–26, 14–21, 11–16, 7–11, 4–6
SEC C2: point scores of 20–24, 17–20, 14–17, 12–13, 9–10, 6, 3
SEC DE: point scores of 7–19, 6–16, 5–13, 4–11, 3–8, 2–5, 1–2
National Capital Region: Region composed of 17 cities—Caloocan, Las Pinas, Makati, Malabon, Mandaluyong, Manila, Marikina, Muntinlupa, Navotas, Paranaque, Pasay City, Pasig, Pateros, Quezon City, San Juan, Taguig, and Valenzuela
RESULTS
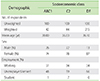
A total of 1,661 respondents were randomly selected and invited to participate in the survey to reach the predetermined sample size of 301 (weighted). The characteristics of the respondents stratified according to socioeconomic group are summarized in Table 1.
Awareness and attitudes
The most common symptoms experienced in the previous month by the respondents were nasal obstruction/congestion (87%), watery rhinorrhea (80%), sneezing (72%), and nasal/ocular pruritus (57%). Respondents in groups ABC1 (40%) and DE (46%) commonly experienced a combination of 3 of these symptoms. Group C2 experienced mostly a combination of 2 of the symptoms (41%) versus ABC1 (38%) and DE (27%). All 4 symptoms were experienced by 22% of ABC1, 25% of C2, and 27% of DE. The differences between groups were not statistically significant.
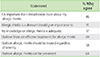
Most of the respondents attributed their symptoms to "colds" (ABC1 77%, C2 79%, DE 78%). The second most common condition that the symptoms were attributed to was allergy (ABC1 14%, C2 10%, DE 6%). Only the ABC1 group had respondents who specifically used the term AR for their symptoms (5%). Among the respondents who did not mention allergies as their ailment, 26% said they were aware of and 74% were not aware of AR; the difference was significant. Stratified according to SEC, 43% of ABC1, 34% of C2, and 21% of DE said they were aware of AR. The difference in awareness between ABC1 versus DE was significant. Similarly, there was a significant difference between nonawareness of group DE (79%) versus ABC1 (57%). Among the respondents who reported awareness of AR, 41% believed it was an important disease; 46% agreed it was important to learn about the disease. Sixty-four percent believed AR could be prevented and 69% believed effective treatments existed (Table 2).
When asked which activities were most affected by their symptoms, sleep (62%) was most commonly cited, followed by household chores (24%) and work/school (12%). Only 2% of respondents claimed that activities were not affected by their symptoms. When stratified according to SEC, sleep was most commonly affected in group DE (65%) and ABC1 (60%); there was a significant difference between groups DE and C2 (49%). The second most commonly affected activity in groups C2 and DE was household chores (27% and 25%, respectively). Work/school was the second most affected activity in group ABC1 (20%); there was a significant difference between effect on work/school for groups ABC1 and C2 (21%) versus group DE (8%). Based on the activities affected, most of the respondents were classified as having moderate-severe symptoms (ABC1 100%, C2 97%, DE 98%).
Practices
Across all SEC, respondents self-medicated for their symptoms (ABC1 91%, C2 91%, DE 93%). One percent of groups ABC1 and C2 and 4% of DE used a combination of self-medicated and physician prescribed medicines for their symptom relief. Of those who reported using prescription medicines only, 92% reported compliance with physician instructions on dosage and duration of therapy. Eighty percent reported satisfaction with physician explanation and management of AR.
The top 3 primary sources of information for AR medications/interventions were, for groups ABC1 and C2, family (65% and 67%, respectively), television (35% and 40%, respectively), Internet (24% and 21%, respectively) and family (53%), television (35%), and friends (24%) for group DE.
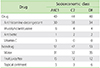
Stratified according to SEC, the use of drugs versus nondrugs for symptom relief were as follows, 40% versus 51% respectively for ABC1, 44% versus 47% for C2, and 40% versus 53% for DE. Over the counter (OTC) antihistamine-decongestant preparations were the drugs most preferred for symptom relief (ABC1 30%, C2 38%, and DE 34%). Among the respondents who consulted a physician, antihistamines were the most commonly prescribed drug. Hydration/water therapy was the most preferred nondrug intervention (ABC1 31%, C2 32%, and DE 35%) (Table 3).
DISCUSSION
The following cardinal symptoms characterize AR: nasal obstruction, watery rhinorrhea, sneezing, and nasal/ocular pruritus. In the Philippines, the prevalence of nasal symptoms from AR among adults in the last 12 months is reported to be 20% [10]. There is evidence that urbanization and adoption of a "westernized" lifestyle promote a higher prevalence [1]. The survey respondents come from the National Capital Region which has an estimated population of 12,220,500 for year 2015. It is the second most populous region in the country; it is a highly urbanized area where exhaust from about 2.4 million registered vehicles pose a major risk to the development of AR [1112].
However, these 4 cardinal symptoms are not exclusive to AR. They are also present in patients with nonallergic, infectious, structural, and other nasal pathologies. In this study, respondents attribute these symptoms to "colds". This perception is the most likely reason most of the respondents do not consult a physician and tend to self-medicate for their symptoms. Clinical criteria and history are the basis for a presumptive diagnosis of AR in this survey. Certainly, without physical examination and/or skin testing as confirmatory procedures, nonallergic or infectious rhinitis cannot be completely ruled out as differential diagnoses.
More than half of the respondents report experiencing nasal symptoms in the previous month. A combination of two or more symptoms is most commonly experienced; there is no statistically significant difference in the number of symptoms concurrently experienced by the 3 groups. Congestion/obstruction is cited as the most common AR symptom experienced by all groups. This finding is consistent with the report of American, Latin American, and Asia-Pacific surveys where nasal congestion is noted to be the most prevalent and troublesome of symptoms during an AR attack [13]. Nasal congestion occurs in the early and late phase allergic response; it is primarily a product of submucosal venous capacitance vessel vasodilation that results from eosinophil and mediator release [14]. This symptom may be the most difficult to control especially during the late phase reaction which is characterized by tissue destruction secondary to prolonged exposure to inflammation. When nasal obstruction is the primary manifestation, intranasal corticosteroids are the recommended first line drugs. There is evidence that second-generation oral antihistamines are ineffective for this symptom [15]. Nasal congestion, compared with other symptoms of AR, has the greatest impact on patients' quality of life. It leads to increased physician consultations and problems related to sleep, daily activities, and work productivity [1617].
For the 3 groups, sleep is cited as the activity most affected by AR symptoms. Sleep is an important activity that restores physical and psychological health; deprivation impacts negatively on daytime activities, work/school productivity, and results in a decline in quality of life. The report of disturbed sleep is consistent with the report of nasal congestion/obstruction as the most common symptom experienced by respondents. Among the symptoms of AR, nasal congestion is the principal cause of sleep disturbance. The supine position increases nasal resistance and adds to allergy-mediated nasal congestion. Moreover, the release of inflammatory mediators follows a circadian variation, peaking early in the morning, at the time when adrenergic activity is at its minimum. Increased airway resistance during sleep may predispose AR patients to various forms of sleep-disordered breathing, from benign primary snoring to the more life-threatening obstructive sleep apnea syndrome [18].
Based on self-reported symptom severity, majority of the respondents have moderate-severe disease. Nevertheless, most of the respondents prefer to self-medicate rather than seek physician consultation for their symptoms. Only 20% of the respondents report seeing a physician within the last year for their symptoms. For respondents who consult a physician, few actively seek specific information about the disease. Patient satisfaction with their physicians' explanation of the disease and over-all medical care is high (80%).
Most of the respondents consider AR as a nonlife threatening illness; only 41% believe it is an important disease. A study of AR sufferers with different classes of severity reports that patients' perspectives are independent of persistence and severity of symptoms. The authors conclude that this explains why AR remains underdiagnosed and undertreated even in the most severe forms [19]. The revised ARIA guidelines emphasize the global importance of AR and recommend methods for prevention [20]. The finding that only 17% of the respondents admit that their knowledge of AR is adequate is an indication of the need to educate Filipinos on AR.
Although the respondents, regardless of SEC, have common perceptions on AR manifestations, symptom complexes, affected activities, and symptom severity, there are areas where differences reflect the socioeconomic disparity between the groups. There is a significant difference in the second most commonly affected activity among the SEC groups. Group ABC1 report work and school as the second most affected activity while groups C2 and DE report a greater impact on household chores. Females constitute a majority of the respondents in all 3 groups. Respondents from ABC1 are mostly employed, belong to a higher income bracket, and are more likely to have the resources to hire household help. Groups C2 and DE have statistically higher unemployment rates and lower income, and therefore, are more likely to do the household chores themselves.
Another significant difference between SEC groups is the level of AR awareness between ABC1 and DE. AR awareness is observed to be directly proportional to family salary/expenditure and level of education. Only group ABC1 has respondents who specifically cited "allergic rhinitis" as the cause of their symptoms. In general, group ABC1 has higher levels of education and better access to various educational media. Respondents from the 3 SECs cite family as the major source of health information; ABC1 may have more quality-time learning from more educated family members. Respondents from group DE, on the other hand, attain lower educational levels and have less disposable income to spend on learning and/or healthcare related activities. Internet access for information, for example, is less likely to be readily available to DE. This explains why it is not among the top 3 sources for health information in this group.
For symptom relief, respondents from the 3 SECs prefer nondrug intervention to drug therapy. Hydration, followed by intake of fruit juice, is the top choice for nondrug therapy. Currently, there is scarce evidence regarding hydration as an effective management for AR. For drug therapy, OTC antihistamine-decongestant preparations are the preferred choice. The use of OTC drugs can be partially attributed to the perception of colds as the main etiology of symptoms. Even for patients who see a physician, OTC drugs in combination with prescription drugs are an attractive option because they are cheap and readily available. In the Philippines, healthcare services are available through the private and public sector. Private services are used by about 30% of the population that can afford fee-for-service. The national health insurance program (Philhealth) coverage for National Capital Region is only 57% [21]. Out-patient services, ancillary procedures, and medications are not covered by Philhealth. This limited service coverage means that out-of-pocket payments are the major source for health financing. Cost, therefore, is an important consideration for most patients. In a previous survey, general and specialist physicians in the Philippine NCR perceive cost to be the primary reason for noncompliance of patients with therapeutic regimens. Similarly, the finding of antihistamines as the most commonly used prescription drugs is also consistent with the same survey where antihistamines are reported as the preferred single drug treatment of Filipino physicians for mild or moderate-severe AR [22].
In conclusion, regardless of SEC, Filipino adults are not aware of AR. Lack of awareness and gaps in knowledge on AR can result to an underestimation of the condition, decrease in health seeking behavior, unmet patient needs, and undertreatment of disease. All these factors contribute to a decrease in the quality of life of AR patients. It is recommended that health promotion initiatives through patient education and public information be done among AR patients with the family, being the most common source of health information for this population, as the medium.
 XML Download