

 PDF
PDF ePub
ePub Citation
 Print
Print


INTRODUCTION
Asthma is recognised as a chronic inflammatory disorder of the airways causing typical symptoms of recurrent wheezing, breathlessness, chest tightness and cough. These symptoms correlate with widespread but variable airflow obstruction which is often reversible either spontaneously or with treatment. Another characteristic physiological feature of asthma is increased airway hyperresponsiveness, with a variety of stimuli capable of inducing airflow obstruction. Measures of airway inflammation such as the fraction of exhaled nitric oxide, inflammatory cells in induced sputum, or airway inflammation in bronchial biopsies help support and confirm the diagnosis of asthma. Recent advances characterising airway inflammation using this approach have been able to classify asthma into inflammatory phenotypes with different natural histories and responses to anti-inflammatory medication [1]. However, these research tools are often not clinically practical or widely available. Hence, the standard criteria for the diagnosis of asthma clinically remain the presence of the typical symptoms, plus evidence of airflow obstruction which is either (1) variable, or (2) reversible, or (3) inducible.
Measuring lung function in asthma
The standard technique for measuring variability in airflow obstruction is the portable peak flow meter. This simple tool for monitoring asthma control has also been useful in aiding diagnosis, particularly for occupational asthma. While specific inhalation testing remains the gold standard, serial measurement of peak expiratory flow (PEF) has been used in epidemiological studies of occupational asthma. A simple comparison between pre- and postshift for demonstrating variability with a significant fall between pre- and postshift measurements supports the diagnosis of occupational asthma [2]. Lung function testing for the demonstration of reversible or inducible airflow obstruction relies on the standard spirometric measurement of forced expiratory volume in 1 second (FEV1). An improvement in FEV1 of greater than 12% and 200 mL from baseline in response to bronchodilator administration defines significant reversibility of airflow obstruction which is diagnostic of asthma. Conversely, a fall in FEV1 from baseline of 15% for indirect challenges (e.g., inhaled hypertonic saline, mannitol, adenosine monophosphate or exercise challenge) or 20% for direct challenges (e.g., inhaled methacholine or histamine) signifies significant inducibility of airflow obstruction which is diagnostic of asthma.
What is lacking in these measures of lung function for asthma?
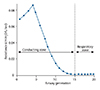
Whilst these techniques of measuring variability, reversibility or inducibility of airflow obstruction remain fundamental to our current clinical diagnosis of asthma, they rely on a single summation measure of airflow at the lips to a forced expiratory manoeuvre (PEF and FEV1). The complex asymmetrical dichotomous branching structure of the airway tree through 23 generations from the trachea to the terminal bronchioles and alveolar ducts indicate potential for complex flows with regional heterogeneity in different segments of the airway tree, particularly towards the periphery of the lung. In a normal airway tree, the region of maximum resistance to airflow is in the proximal 4 to 8 generations of airway (Fig. 1). Hence, this region of maximum resistance may be regarded as the "choke point" of the airway tree to a forced expiratory manoeuvre, and is the major determinant of measures such as PEF and FEV1. The bulk of bronchial smooth muscle in the airway tree is wrapped around airways of these generations and any rapid change in resistance in this part of the airway tree will be reflected by significant changes in the PEF and FEV1. Hence, it follows that bronchial smooth muscle spasm and relaxation in these proximal generations of airways are the major contributor to the observed variability, reversibility and inducibility of airflow obstruction used in the diagnosis of asthma.
Emerging importance of small airways in asthma
Airways with an internal diameter less than 2 mm that do not contain cartilage in their walls and extend from the 8th generation airways to the periphery of the lung are collectively referred to as the "small airways" [3]. Compared to the large (> 2 mm) airways, the cross-sectional surface area and airway volume of the small airways are far greater, but contribute only 10% of the total airway resistance [4, 5]. Current measures of airway resistance and airflow with standard spirometric techniques such as FEV1 and PEF, do not capture the resistance in this part of the airway tree. Hence, these distal small airways are regarded as the "silent zone" of the airway tree, since extensive disease can be present with little abnormality in conventional lung function tests. In chronic obstructive pulmonary disease (COPD), obstruction of these small airways due to loss of parenchymal support with emphysema and bronchiolitis with mucus production and airway wall thickening, is the primary pathophysiology responsible for its clinical manifestations. However, pathology and dysfunction in these small airways have also long been suspected to contribute to the pathogenesis and natural history of asthma. Studies in the 1970s using density dependence of maximum expiratory flow with inhalation of helium-oxygen mixtures showed physiological abnormalities in the distal airways in asthma [6]. In the early 1990s direct measurement of pressure-flow relationship with a fiberoptic bronchoscope wedged into a subsegmental bronchus showed significant physiological and mechanical changes in the distal airways in a small group of symptomatic asthma patients compared with normal subjects [7]. However, these techniques are invasive and/or are not clinically practical.
How do we measure small airways function?
The main techniques most widely researched which can measure small airways function without requiring the forced expiratory manoeuvre are the forced oscillation technique (FOT) and the multiple breath washout technique (MBW).
Forced oscillation technique
The FOT measures mechanical properties of the respiratory system from the response to small externally produced oscillatory (vibratory) forces. Forced oscillations at varying frequency from a loudspeaker are applied from the mouth, where the respiratory system pressure-flow relation responses are also measured. From the instantaneous pressure-flow relationship response, flow resistance (measured as "impedance," analogous to the resistance to an alternating current in electrical circuits), the reactance (the combined effect of elastance-pressure required to change volume and inertance-pressure required to accelerate flow) of the respiratory system can be computed [8]. Varying the frequency of the impulse measures helps distinguish the mechanical properties of the large (higher frequencies) and small airways (lower frequencies). FOT measured at the lower frequencies is sensitive to small airways obstruction but consensus is yet to be reached regarding the sensitivity for bronchodilation. FOT has also been shown to be a reliable method in the assessment of bronchial hyperresponsiveness in adults and children [9], but there is a need for further large scale studies in adults to validate existing reference equations. Hence, FOT is a promising technique which is simple to administer, does not require a forced expiratory manoeuvre, and helps to detect small airways dysfunction even when standard spirometric values such as FEV1 are normal [10].
Multiple breath washout technique
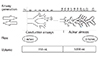
The principle for the MBW test evolves from the two different ways gas is transported in the lung: (1) by convection, or (2) by diffusion. Convective flow refers to the movement of a gas at the mean velocity of the airstream, requires the presence of a pressure gradient, and is the mechanism of gas transport in the more proximal conducting airways. With the exponential increase in cross-sectional area of the cumulative conducting airways as they approach the alveoli, the convective velocity progressively falls to zero towards the alveolar sacs [11]. For this reason, the transport of gas in the very peripheral structures is by molecular diffusion rather than convection, driven by a concentration gradient to fill the alveolar spaces (Fig. 2). Between zones of convective and diffusive transport is an intermediate zone called the diffusion front [12]. This corresponds anatomically to the terminal respiratory bronchioles just at the entrance of the acinus. It is then possible, by utilising the MBW, to quantitate the asymmetry of lung structures, either proximal to the diffusion front (Scond, in the conductive airways) where convective gas transport takes place, or distal to the diffusion front (Sacin, acinar structures) [13, 14]. As the physiological outcome being measured is the degree of ventilatory heterogeneity, a decrease in either Sacin or Scond reflects an improvement in lung function. MBW has a high sensitivity and reproducibility for detecting the presence of uneven ventilation in the periphery of the lung (ventilation heterogeneity), which in turn is a manifestation of conductive and/or acinar small airways dysfunction.
The contribution of small airways to ventilation heterogeneity in asthma
This ventilation heterogeneity in the periphery of the lung as detected by the MBW and FOT has emerged as an important marker of asthma disease activity, even in the absence of changes in standard spirometric measurements. Ventilatory heterogeneity in the conductive region (Scond) of the lung has been shown to be a strong determinant of the inducibility of airflow obstruction, i.e., airway hyperresponsiveness [15] as well as asthma symptom control [16]. It also a marker of, and may predispose to catastrophic asthma, through complex pulmonary airway tree behaviour in sudden airway narrowing and avalanche-like reopening [17]. In a group of patients with a severe exacerbation of asthma, that there was a significant correlation between ventilation heterogeneity in the acinar (Sacin), region of the lung and FEV1 percent predicted [18] but not with ventilation heterogeneity in the small conducting airways (Scond). Patients with ventilatory heterogeneity have also been shown to have more frequent asthma exacerbations [19]. This mounting physiological evidence supports the importance of small airways dysfunction in asthma, even in the absence of currently accepted spirometric evidence of asthma activity. These results add a further dimension to our understanding of asthma, and help gain significant insights on clinically important asthma phenotypes, by defining acinar or conductive "physiotypes" of ventilation heterogeneity.
How do we image small airways function in asthma?
High-resolution computed tomography (CT) has been used to assess airway wall thickness of larger airways to determine airway remodelling and demonstrate evidence of small airways obstruction with gas trapping on expiration [20]. Small airways are difficult to image as their cross-sectional area is smaller than the spatial resolution of conventional CT. Hence, CT results are limited mainly to structural analyses of larger airways. Magnetic resonance imaging (MRI) has capability of exquisite spatial resolution of solid organs but relies on a unique tissue contrast of water and fat protons (1H) in their local tissue environments. MR imaging of the lung is difficult because of its low physical and proton density giving rise to a weak MR signal. MR imaging of the lung is further complicated by the many air-tissue interfaces that introduce magnetic susceptibility effects, causing a rapid decay of the MR signal in the lung. However, recent advances in contrast enhanced CT and MRI imaging have opened up an exciting new research field of functional lung imaging.
Xenon ventilation computed tomography
Xenon ventilation CT using dual source and dual energy is a new technique for functional lung imaging which visualises lung ventilation and allows quantification of regional ventilation defects as well as gas trapping behind obstructed airways [21, 22]. Using this technique, abnormalities of regional ventilation were found to be highly associated with measures of asthma control, airway hyperreactivity (as assessed by methacholine-induced bronchoconstriction) and subsequent bronchodilator response to salbutamol, but not with baseline FEV1 in a group of asthmatic subjects [23]. This suggests ventilation heterogeneity on xenon CT is more indicative of distal small airways obstruction rather than central airway bronchomotor tone, and can be used as a novel parameter to assess the status of asthma control and symptom severity [24].
Hyperpolarised gas lung MRI ventilation imaging
Hyperpolarised helium-3 (3He) or xenon-129 (129Xe) belong to a new class of MR contrast agents that, when inhaled, can be used to obtain high spatial and temporal resolution images of the lung airspaces. The use of hyperpolarised noble gases increases the signal by a factor of approximately 105 which enables acquisition of the data from the gas itself with the first MR image reported less than 20 years ago [25, 26]. 3He and 129Xe are hyperpolarised by a transfer of angular momentum from circularly polarised laser light to the electron and nuclear spins of the atoms in a process called "optical pumping." 3He has a very low solubility in blood or tissue, making it relatively biologically inert and remains almost entirely within the airspaces of the lung. In contrast to 3He, 129Xe has a very high solubility in blood and lipid-rich tissue. After inhalation, Xe is absorbed into the pulmonary tissue, then enters the blood and is distributed throughout the body by circulation [27]. Hence, combined visualisation of the gas phase and dissolved phase by 129Xe allows for simultaneous assessment of ventilation/perfusion. While current capability to generate hyperpolarised gas for MR imaging is predominantly restricted to specialised centres in Europe and North America, feasibility of imaging with long distance transport as far as Australia for has also been shown [28].
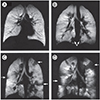
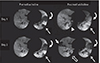
Static ventilation imaging with hyperpolarised 3He gas during a breath hold following the inhalation [29, 30] shows well-ventilated regions of the lung to appear bright, while poorly ventilated regions of the lung appear dark and (analogous to nuclear medicine ventilation imaging). In asthma, ventilation defects were induced by exercise, or methacholine, and reversed with bronchodilator indicating that hyperpolarised 3He MRI detects the reversible ventilation defects known to characterise asthma [31]. Additionally, ventilation defects are seen in some asymptomatic asthmatics with normal spirometry, and increases with worsening severity (Fig. 3). Furthermore, using methacholine challenge to induce bronchoconstriction, some ventilation defects persisted or recurred in the same location with time or repeated bronchoconstriction, while others resolved [32, 33]. This suggests some regional some changes of airflow obstruction are relatively fixed within the lung, while others have a much more dynamic variability (Fig. 4). Hence, hyperpolarised 3He ventilation defects in asymptomatic asthmatics may be indicative of a subclinical inflammatory process, and may be able to non-invasively characterise early pathophysiological effects of small airways dysfunction in asthma.
CONCLUSION
There is mounting evidence that pathology and dysfunction in small airways are implicated in the pathogenesis and natural history of asthma. Physiological techniques of FOT and MBW have shown ventilation heterogeneity due to small airways dysfunction is an important marker of asthma disease activity, even in the absence of abnormalities in standard spirometric measurements. Recent advances in imaging research, particularly with xenon contrast enhanced CT and hyperpolarised gas magnetic resonance imaging, have also given insights into the dynamic nature of ventilation heterogeneity in asthma and its significance. The challenge is to integrate these new physiological and imaging insights to further our understanding of asthma and facilitate potential new treatments.
 XML Download